FIGURE 45-1. Cumulative incidence of further progression of retinopathy during the Epidemiology of Diabetes Interventions and Complications (EDIC) study in the former conventional therapy and intensive therapy cohorts from the Diabetes Control and Complications Trial (DCCT). Data are based on regression analysis adjusted for the level of retinopathy at the end of the DCCT, whether patients received therapy as primary prevention or as secondary intervention, and for the duration of diabetes and the A1c value on enrollment in the DCCT.
(From DCCT/EDIC Research Group: Retinopathy and nephropathy in patients with type 1 diabetes four years after a trial of intensive therapy. N Engl J Med 342[5]:387, 2000.)
Although the DCCT conclusively demonstrated that intensive therapy can reduce the risk for microvascular complications, the effect on macrovascular disease was initially less clear. By the end of the DCCT, the intensive therapy arm displayed a relative risk reduction of 34% (95% CI: 7% to 54%) for the development of elevated low-density lipoprotein (LDL) cholesterol levels. Nevertheless, even though intensive therapy was associated with a 41% relative risk reduction (95% CI: −10% to 68%) for macrovascular complications, this difference was not statistically significant.2 It is important to note, however, that the macrovascular benefits derived from near-normal glycemic control in the former intensive treatment arm of the DCCT have emerged over time in the EDIC study. Indeed, after mean follow-up of 17 years, it was observed that intensive therapy during the DCCT had reduced the subsequent risk for any cardiovascular disease (CVD) event by 42% (95% CI: 9% to 63%; P = .02) and the risk for nonfatal myocardial infarction (MI), stroke, or cardiovascular death by 57% (95% CI: 12% to 79%; P = .02) (Fig. 45-2).9 This remarkable risk reduction was largely explained by differences in the updated mean A1c during the DCCT. Furthermore, the reduction in CVD events was consistent with earlier observations that intensive therapy had reduced the progression of atherosclerosis (as measured by carotid artery intima media thickness [IMT]) and the prevalence of coronary artery calcification (CAC) during the DCCT/EDIC study, with both effects associated with the reduction in mean A1c achieved with intensive therapy.10,11 Thus, intensive therapy (with associated reduced glycemic exposure) during the mean 6.5 years of the DCCT first significantly reduced surrogate measures of atherosclerotic disease (carotid IMT, CAC) and later reduced clinical CVD events over the course of the EDIC study (Fig. 45-3). These data demonstrate that the long-term risk associated with past glycemic exposure extends to both microvascular and macrovascular disease.12 Indeed, it has been hypothesized that glycemic exposure early in the course of the disease may have an effect of metabolic imprinting (referred to as “metabolic memory”) that contributes to future risk for vascular complications.9 Taken together, these data further underscore the importance of initiating intensive therapy as early as safely possible in the management of type 1 diabetes.
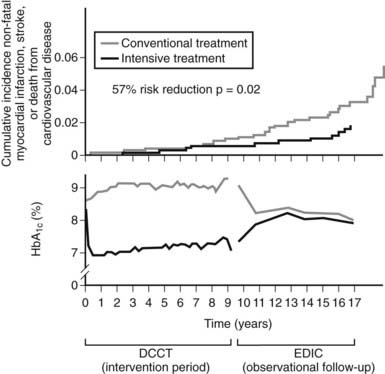
FIGURE 45-2. Differences in A1c (lower panel) and cardiovascular event rates (upper panel) over time between the intensive and conventional diabetes treatment arms of the Diabetes Control and Complications Trial (DCCT)/Epidemiology of Diabetes Interventions and Complications study (EDIC) cohort.
(From Retnakaran R, Zinman B: Type 1 diabetes, hyperglycaemia and the heart. Lancet 371:1790–1799, 2008.)
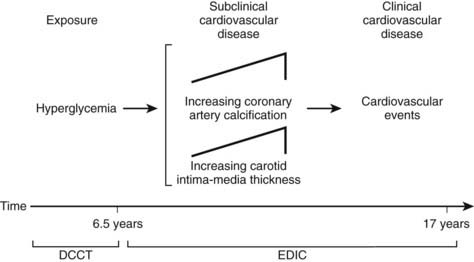
FIGURE 45-3. Pathophysiologic model of cardiovascular disease (CVD) in type 1 diabetes based on observations from the Diabetes Control and Complications Trial (DCCT)/Epidemiology of Diabetes Interventions and Complications study (EDIC).
(From Retnakaran R, Zinman B: Type 1 diabetes, hyperglycaemia and the heart. Lancet 371:1790–1799, 2008.)
Overall, the DCCT helped to clarify the relationship between A1c and diabetic complications. For every 10% reduction in A1c, the risk of developing retinopathy was reduced by approximately 45%.13 Moreover, a continuous curvilinear relationship was observed between A1c and the incidence of retinopathy, the risk of progressive retinopathy being decreased substantially at A1c levels below 7%. Although the risk for progressive retinopathy was further reduced at A1c concentrations below 7% (i.e., no threshold effect), this benefit was achieved at the cost of a significantly increased risk for hypoglycemia, given an observed continuous and inverse relationship between hypoglycemic risk and A1c (Fig. 45-4). Thus, the DCCT firmly established the importance of glycemic control in the management of type 1 diabetes, demonstrated the feasibility of intensive therapy in improving glycemic control, and identified the limitations imposed on such control by hypoglycemia. In doing so, this study has provided a framework for current treatment goals.
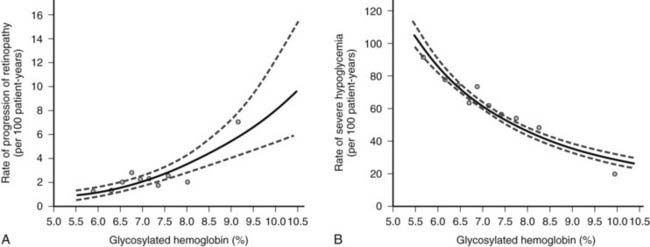
FIGURE 45-4. Risk for sustained progression of retinopathy (A) and rate of severe hypoglycemia (B) in patients receiving intensive therapy, in relation to mean A1c value during the Diabetes Control and Complications Trial (DCCT).
(From the DCCT Research Group: The effect of intensive treatment of diabetes on the development and progression of long-term complications in insulin-dependent diabetes mellitus. N Engl J Med 329[14]:984, 1993.)
GLYCEMIC GOALS
On the basis of the findings of the DCCT and other studies, the ultimate objective in the treatment of type 1 diabetes is metabolic normalization, that is, the achievement of sustained euglycemia and the avoidance of hypoglycemia. In this context, the 2008 American Diabetes Association (ADA) treatment guidelines suggest the following therapeutic targets for nonpregnant adults with type 1 or type 2 diabetes: (1) A1c less than 7.0% (referenced to nondiabetic range 4.0% to 6.0%); (2) preprandial plasma glucose 70 to 130 mg/dL; and (3) peak postprandial plasma glucose less than 180 mg/dL (Table 45-1).14 The evidence-based 2008 Canadian Diabetes Association Clinical Practice Guidelines recommend similar targets of A1c less than or equal to 7.0%, preprandial plasma glucose 72 to 126 mg/dL, and 2-hour postprandial plasma glucose 90 to 180 mg/dL.15 The American Association of Clinical Endocrinologists recommends slightly more stringent goals of A1c less than or equal to 6.5%, fasting glucose less than 110 mg/dL, and postprandial glucose less than 140 mg/dL.16
Table 45-1. American Diabetes Association Recommendations for Treatment Targets in Nonpregnant Adults With Diabetes
| Target | |
|---|---|
| Glycemic Control | |
| A1c | <7.0% |
| Preprandial plasma glucose | 70-130 mg/dL |
| Postprandial plasma glucose | <180 mg/dL |
| Blood Pressure | <130/80 mm Hg |
| Lipids | |
| LDL | <100 mg/dL |
| HDL | >40 mg/dL* |
| Triglycerides | <150 mg/dL |
Goals might have to be individualized for the given patient.
HDL, High-density lipoprotein; LDL, low-density lipoprotein.
* For women, it has been suggested that the HDL goal should be increased by 10 mg/dL.
Adapted from American Diabetes Association: Standards of medical care in diabetes. Diabetes Care 31(Suppl 1):S12–S54, 2008.
Glycemic targets might have to be individualized in individuals for whom the potential harm from hypoglycemia may outweigh the benefits of better glycemic control. These cases include patients with irreversible end-stage complications, developing children, and individuals who are unable to sense hypoglycemic symptoms. In such cases, clinicians generally set higher glycemic targets to reduce the risk for hypoglycemia.
ACUTE COMPLICATIONS
The major acute complications of type 1 diabetes are ketoacidosis and hypoglycemia. These topics are discussed in detail in Chapters 46 and 47, respectively. The risk for these acute complications can be reduced through the judicious use of insulin therapy. Specifically, the risk for ketoacidosis can be reduced through appreciation of the concept that patients with type 1 diabetes require insulin therapy at all times. Appropriate management of special situations, such as intercurrent illness, requires adherence to this principle (see the section entitled “Adjustment of Insulin Therapy in Special Situations”).
As was observed in the DCCT (see Fig. 45-4B), tight glycemic control typically is associated with an increased risk for hypoglycemia. Patients therefore must be educated about the recognition of hypoglycemic symptoms and the use of appropriate treatment measures when such symptoms arise. Patients are advised to keep rapidly absorbable sources of carbohydrate, such as glucose tablets, close at hand at all times. In general, 15 g of carbohydrate is needed to increase blood glucose levels by approximately 38 mg/dL within 20 minutes.17,18 Besides glucose tablets, other treatments that provide a similar amount of glucose include (1) 15 mL (1 tablespoon) or three packets of table sugar dissolved in water, (2) 175 mL ( cup) of juice, and (3) 15 mL (1 tablespoon) of honey. In addition, patients with type 1 diabetes should have an emergency glucagon injection kit. Both the patient and his or her family members should be trained in the use and intramuscular or subcutaneous injection of glucagon (0.5 to 1 mg) as a means of rapidly increasing blood glucose concentration when the patient is severely hypoglycemic. Finally, the avoidance of hypoglycemia is particularly important for patients who are unable to sense hypoglycemic symptoms (discussed in the section entitled “Complications of Insulin Therapy”).
CHRONIC COMPLICATIONS
The chronic microvascular complications of type 1 diabetes include retinopathy, neuropathy, and nephropathy (discussed in Chapters 52, 53, and 54, respectively). To reduce the impact of these complications, management strategies include regular surveillance for early detection of complications and tight glycemic control for both primary prevention and secondary intervention, as demonstrated in the DCCT.
Macrovascular disease, as manifested by cerebrovascular, peripheral vascular, and coronary artery disease, is a major chronic complication of type 1 diabetes (discussed in Chapter 51). Regular surveillance for vascular disease and management of cardiovascular risk factors is essential. In particular, modification of reversible cardiovascular risk factors, such as hypertension, dyslipidemia, and cigarette smoking, is an important management goal. The 2008 ADA treatment guidelines suggest a target blood pressure of less than 130/80 mm Hg in patients with diabetes. In addition, the following treatment targets for lipids are recommended: LDL less than 100 mg/dL, triglycerides less than 150 mg/dL, and HDL greater than 40 mg/dL in men and HDL greater than 50 mg/dL in women (see Table 45-1).14
QUALITY OF LIFE
Type 1 diabetes is a chronic condition that requires a complex health care strategy that demands significant patient effort through frequent insulin injections, regular self-monitoring of blood glucose levels, and constant attention to nutrition and physical activity. As such, effective management requires that the patient take responsibility for his or her care. In this context, it should be noted that quality of life is an important feature that can affect a patient’s willingness to pursue a demanding treatment plan. Recognition of this concept at all times by the health care team will facilitate the success of treatment initiatives. Moreover, in recognition of the importance of quality of life, many research studies now utilize validated instruments such as the Diabetes Quality of Life Questionnaire to measure patient well-being as a therapeutic outcome.19
Team Approach to Management
Given the complexity of modern treatment regimens, comprehensive care for patients with type 1 diabetes is best accomplished through a team approach. The core members of the diabetes health care team include the patient, the primary physician, a diabetes nurse educator, and a registered dietitian. Other individuals participating in the patient’s care may include a pharmacist, a medical social worker, a foot care specialist, an ophthalmologist, and other medical specialists such as cardiologists, nephrologists, and neurologists. At all times, the patient’s central role as a member of the health care team must be recognized. Accordingly, the efforts of the health care team should always be pursued from a patient-centered perspective. Inherent in this approach is the central importance of patient education, as the patient’s active participation in his or her care demands an understanding of the issues associated with the treatment plan. As will be discussed in later sections of this chapter, the patient needs to be equipped with the knowledge and skills required for activities such as self-monitoring of blood glucose control, glycemic pattern management, estimation of the carbohydrate content of meals, insulin dose adjustment, and appropriate insulin administration.
Monitoring
Type 1 diabetes is a chronic condition involving complex treatment regimens and multiple management goals. As such, regular monitoring of patient status is an essential component of comprehensive care. Patient monitoring in type 1 diabetes addresses two fundamental issues. First of all, frequent acute assessment of metabolic status guides adjustment of the treatment regimen, which, by nature, must be dynamic and able to accommodate day-to-day physiologic variability. Second, regular surveillance of both important clinical outcomes and associated surrogate markers allows for the detection and treatment of chronic complications and attendant comorbidities.
GLYCEMIC CONTROL
Regular monitoring of glycemic status by both patients and health care providers is fundamental to diabetes care. Glycemic monitoring involves frequent, acute measurement of blood glucose levels by the patient and periodic evaluation of chronic glycemic control through laboratory measurement of markers of glucose concentration such as A1c.
Acute Measurement of Glycemic Control
Self-monitoring of blood glucose (SMBG) by patients is an invaluable tool that has empowered patient-driven management of type 1 diabetes. This technique involves using a small lancet to draw a drop of capillary blood from the fingertip. The patient applies a small drop of blood (usually 3 to 5 µL) to a testing strip, from which a portable glucose meter can determine the glucose concentration of the blood by enzymatic means within 5 to 30 seconds. In this way, patients can immediately determine their capillary blood glucose concentration at any time.
Patients with type 1 diabetes should monitor blood glucose frequently. In the DCCT, insulin doses for patients in the intensive treatment arm were adjusted according to the results of SMBG performed at least four times a day.20 Blood glucose typically is measured before administration of insulin prior to a meal and at bedtime. Meaningful data can be derived from measurements at other times as well. For instance, nocturnal hypoglycemia resulting from excessive bedtime insulin can be detected by blood glucose measurement in the early hours of the morning. Similarly, postprandial monitoring 2 hours after a meal can assess the adequacy of the preprandial insulin dose. Patients should check their blood glucose level before driving a motor vehicle, particularly if they have difficulty sensing hypoglycemic symptoms, as hypoglycemia (and hence neurologic impairment) while driving can be very dangerous for the patient and others. Patients should also consider SMBG at times when blood glucose might be changing rapidly, such as during the postexercise period or when experiencing symptoms of hypoglycemia.
Self-monitoring of blood glucose is of value only to the extent that the information it provides is used to guide treatment. With each measurement, patients are encouraged to use a logbook to record the blood glucose value, the time of day, and the temporal relationship to food intake. Data obtained from SMBG should be used in two ways: variable insulin dose scales and pattern management. Variable insulin dose scales refer to algorithms that guide the patient as to the appropriate dose adjustment of preprandial insulin based on the current degree of glycemia (discussed in the section entitled “Implementation of Intensive Insulin Therapy”). Pattern management describes the two-step process of using the glucose profile recorded over several days to identify glycemic patterns and then adjusting the daily insulin regimen for the coming days in a proactive fashion on the basis of these patterns. Therefore, both variable insulin dose scales and pattern management are essential components of patient education.
Given the value of blood glucose data, it is important to consider potential problems that are inherent in the process of self-monitoring. To ensure proper meter function, glucose meters should be calibrated by a laboratory reference standard. The patient’s use of the meter and self-monitoring technique should be reviewed periodically in the clinic.21 Inappropriate handling of the testing strips can lead to defective function and inaccurate glucose results. Finally, some patients find lancing of the fingertip to be painful and hence are unwilling to measure blood glucose as frequently as recommended.
In response to patient concerns regarding pain associated with lancing of the fingertip, alternative site glucose meters have recently been introduced. By sampling from alternative sites such as the forearm, these devices can provide accurate blood glucose measurements while causing less pain than fingertip testing.22 However, it should be noted that alternative site testing might not provide accurate results at times of rapid change in blood glucose concentration (e.g., immediately after a meal or after exercise).23,24 Therefore, traditional fingertip testing is recommended at these times.
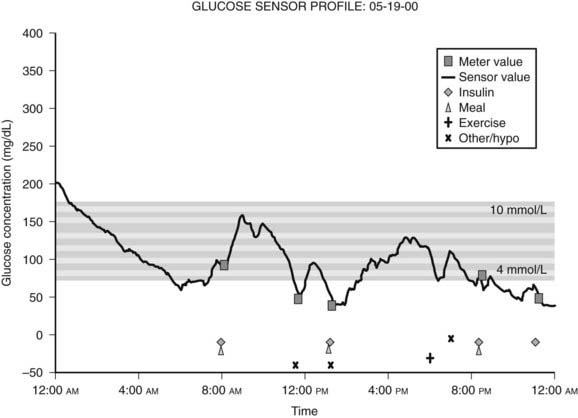
Because blood glucose concentrations are dynamic and fluctuate constantly, it is readily apparent that the limited data provided by even frequent SMBG might not be truly representative of an individual’s glucose excursions. In this context, continuous glucose monitoring (CGM) devices represent an important recent development. This technology utilizes the fact that glucose in interstitial fluid can reflect blood glucose levels.25 CGM systems typically consist of a pager-sized monitor worn by the patient that receives an electrical signal from a subcutaneous sensor that continuously measures the glucose concentration in interstitial fluid.26 Using this input, the monitor determines a blood glucose concentration every 5 minutes that can be downloaded to a computer to provide a graphic display of the patient’s glycemic profile over the period of time monitored (Fig. 45-5).27 During the period of monitoring (usually 3 days), the patient maintains a diary of meals, insulin doses, physical activity, and hypoglycemic symptoms to facilitate meaningful interpretation of the recorded data. Whereas older CGM systems yielded only retrospective glucose data, current models have the capability to provide patients with real-time access to their absolute blood glucose values and to relative trends in their glucose levels. Furthermore, these devices have alarms that can alert patients to either hypoglycemia or hyperglycemia, thereby precipitating appropriate corrective action. In addition, the technology exists wherein CGM systems have been combined with insulin pumps, although it should be noted that these systems currently require the input of the patient (since the insulin pump is not controlled by the CGM device).28 In this regard, it should be recognized (1) that CGM systems require calibration with SMBG readings, (2) that the accuracy of glucose measurements by these devices have been drawn into question in the past,29 and (3) that SMBG values remain the recommended data for guiding treatment decisions.14,30 Thus, the American Diabetes Association currently recommends that CGM be used as a supplemental tool to SMBG in selected patients with type 1 diabetes, particularly those with hypoglycemia unawareness.14 The latter consideration is a reflection of the fact that initial experience with CGM demonstrated higher rates of unrecognized nocturnal hypoglycemia than were previously suspected.31,32 Furthermore, several studies have since shown that CGM systems (particularly real-time devices) are associated with reductions in the total amount of time spent in hypoglycemia.30,33–35 To date, only a few studies have shown improvements in A1c.30,36,37 Although some challenges remain for this rapidly developing technology (including the acquisition of a broader evidence base from further clinical research), the role of CGM as a valuable tool in the management of type 1 diabetes is likely to grow in the near future.
Measurement of Chronic Glycemic Control
Glucose can attach to proteins in the blood through an irreversible, nonenzymatic process, resulting in the formation of glycated proteins.38 Because this process is irreversible, glucose remains attached to the protein until the latter is metabolized. The degree of glycation is a function of blood glucose concentration over time. Thus, measurement of glycated proteins provides a means of estimating chronic blood glucose concentration over a time period proportional to the half-life of the protein in question.
Erythrocytes are freely permeable to glucose. In the circulation, glucose attaches irreversibly to hemoglobin in red blood cells, leading to the formation of glycated hemoglobins called hemoglobin A1a, A1b, and A1c. Measurement of hemoglobin A1c (also known as A1c, glycohemoglobin, or glycosylated hemoglobin) has emerged as the most widely used test of chronic glycemic control. Specifically, the proportion of glycosylated hemoglobin to the total number of hemoglobin molecules reflects overall blood glucose concentration over the preceding 2 to 3 months.39 Therefore, regular measurement of A1c every 3 months is recommended as a method of determining overall glycemic control and evaluating the adequacy of the treatment regimen.21 For instance, a significantly elevated A1c value, consistent with suboptimal glycemic control, would suggest the need for a change in the treatment regimen. Analysis of daily glycemic patterns from the patient’s SMBG records can indicate the specific changes to be made.
Many different types of assays can be used for measurement of glycated hemoglobins.40 Some assays report A1c as a percentage of total hemoglobin, while other methods measure total glycated hemoglobin. Thus, nonstandardization of assays can complicate comparison of A1c measurements between laboratories. The National Glycohemoglobin Standardization Program, initiated in 1996, is an initiative that is designed to standardize laboratory A1c assays to the DCCT reference method.41
The DCCT provided insight into the correlation between A1c level and mean plasma glucose concentration (Fig. 45-6).42 This relationship has recently been studied with the use of CGM data.43 In practice, in some situations the measured A1c value may be discordant with the level that would be expected on the basis of the patient’s capillary blood glucose records. Such discrepancy might be due to glycemic excursions at unmonitored times of the day that are not reflected in SMBG records. Alternatively, the problem might be falsification of SMBG records by the patient.
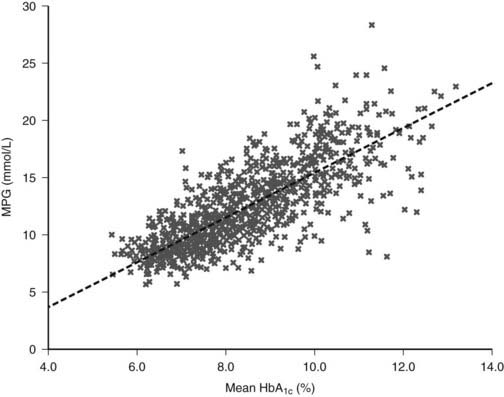
FIGURE 45-6. The relationship between mean plasma glucose and mean A1c in the Diabetes Control and Complications Trial (DCCT) (n = 1429; r = 0.82).
(From Rohlfing CL, Wiedmeyer HM, Little RR, et al: Defining the relationship between plasma glucose and HbA1c: Analysis of glucose profiles and HbA1c in the Diabetes Control and Complication Trial. Diabetes Care 25[2]:276, 2002.)
Another possibility in certain clinical settings is that the measurement of A1c might not be accurate. For instance, rapid red blood cell turnover leads to a disproportionate representation of younger erythrocytes, whose collective exposure to ambient blood glucose levels has been shorter than that of other red blood cells. Accordingly, A1c levels tend to be reduced under such conditions.44 Pregnancy and hemolytic anemias are examples of settings characterized by rapid red blood turnover and hence lowered A1c levels. Similarly, A1c concentration may be lowered in hemoglobinopathies, such as thalassemia and sickle cell disease, because of a diminished propensity for glycation of the abnormal hemoglobin molecule. Conversely, depending on the assay used, A1c values may be falsely elevated in the presence of hemoglobin F, the carbamylated hemoglobin formed in uremia, or acetaldehyde-bound hemoglobin (seen in alcohol abuse).45
In situations in which measurement of A1c might be unreliable, an alternative approach to the estimation of glycemic control is the measurement of glycated serum proteins or albumin. The term fructosamine has been applied to the glycated proteins measured by such assays.46 Given the 14- to 21-day half-life of albumin, a serum fructosamine measurement reflects mean blood glucose concentration over the preceding 1 to 2 weeks. Generally, serum fructosamine values correlate well with A1c measurements.47 However, certain caveats should be noted in measuring fructosamine. First of all, fructosamine values can be affected by conditions that alter the synthesis or clearance of serum proteins. Indeed, the question of whether or not to correct fructosamine assays for serum protein or albumin concentration remains controversial.48 Second, serum fructosamine levels show greater intrasubject variability than A1c measurements do.49 Third, unlike A1c, fructosamine has not yet been shown to correlate with the risk for diabetic complications.
KETONE TESTING
The presence of detectable levels of ketones in urine or blood may indicate impending or established ketoacidosis in patients with type 1 diabetes. Accordingly, patients should test for ketones in the following situations: when blood glucose concentrations are persistently elevated, during periods of acute illness or stress, or when the patient is experiencing symptoms compatible with ketoacidosis such as nausea, vomiting, and abdominal pain.48 Traditionally, patients have used urine dipsticks to test for ketonuria. In recent years, however, home monitors have been developed that can measure the capillary blood concentration of β-hydroxybutyrate, the most prevalent intermediate molecule in ketone formation.50 Blood ketone testing avoids some of the limitations of traditional urinary ketone testing, such as false-positive readings, the inability to detect β-hydroxybutyrate (urinary dipsticks measure different ketone bodies), and patient reluctance to perform urinary testing. In limited studies to date, home capillary blood ketone measurement appears to be more sensitive than urinary testing in the detection of ketosis.51,52 The use of blood ketone monitoring by patients is expected to increase in the future. In the clinical setting, serum ketone measurement is recommended over urinary testing.
COMPLICATION SURVEILLANCE
An essential component of ongoing care for patients with type 1 diabetes is surveillance for complications and comorbidities, as follows:
Insulin Therapy
PRINCIPLES OF INSULIN REPLACEMENT
Insulin replacement strategies in type 1 diabetes ideally aim to mimic the normal physiologic secretion of insulin by the pancreas.6 Therefore, to appreciate the rationale underlying the design of current insulin replacement regimens, an understanding of the basic structure and biochemistry of endogenous insulin is necessary (Fig. 45-7). This topic, discussed in detail in Chapter 32, is reviewed briefly here.
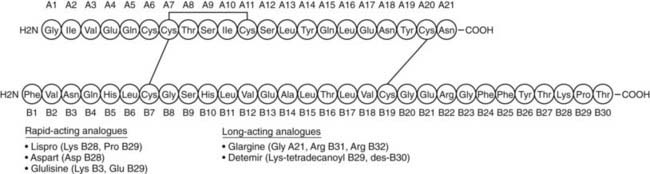
FIGURE 45-7. The amino acid sequence and structure of human insulin. The A and B chains are linked by two disulfide bonds. A third disulfide bridge is present within the A chain.
(Adapted from Cheng AY, Zinman B: Insulin analogues and the treatment of diabetes. In Raz I, Skyler JS, Shafrir E [eds]: Diabetes: From Research to Diagnosis and Treatment. London, Martin Dunitz Ltd, 2002, pp 331–346.)
The pancreatic β cells secrete endogenous insulin into the portal venous system in response to physiologic demand for glucose homeostasis as determined by nutrient intake and energy expenditure. Despite broad fluctuations in these determinants, healthy individuals are able to maintain plasma glucose concentration within a narrow range of 3.5 to 7.0 mmol/L throughout the day (Fig. 45-8).55 This normal glucose homeostasis requires tightly regulated insulin secretion that consists of two components: a basal secretion rate and surges of markedly increased secretion following ingestion of a mixed meal. Accounting for approximately 40% of total 24 hour pancreatic insulin output, the basal secretion of ≈1 µ/hr serves to limit hepatic glucose production and adipocyte lipolysis in the postabsorptive (fasting) state such as between meals and overnight.56 Conversely, with ingestion of a mixed meal, dietary secretagogues (e.g., glucose, amino acids) and gastrointestinal hormones (e.g., glucagon-like peptide 1) stimulate abrupt pulses of insulin secretion up to five times the basal rate. These pulses regulate postprandial glycemia by inhibiting hepatic glucose production and increasing peripheral glucose uptake. Insulin secretion is also affected by energy expenditure. For instance, with moderate exercise, insulin secretion rapidly decreases to prevent hypoglycemia.57 Conversely, with strenuous exercise, catecholamine-mediated hyperglycemia may occur, leading to increased insulin secretion in the postexercise period.58 Thus, the tight coupling of insulin secretion to plasma glucose concentration in healthy individuals (see Fig. 45-8) requires the complex integration of multiple signals of nutrient availability and energy expenditure.
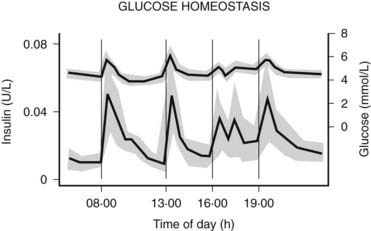
FIGURE 45-8. Twenty-four-hour plasma glucose and insulin profiles in healthy individuals (n = 12) (shown as mean values with 95% confidence interval).
(From Owens DR, Zinman B, Bolli GB: Insulins today and beyond. Lancet 358:739, 2001.)
In providing insulin replacement for patients with type 1 diabetes, the task at hand is to re-create this complex physiology. Insulin replacement strategies in type 1 diabetes aim to faithfully imitate both basal secretion and the appropriately integrated prandial surges that are seen in nondiabetic individuals. Generally, one component of the treatment regimen serves as basal insulin (i.e., simulates basal insulin secretion by the pancreas between meals, overnight, and in the fasting state), while a second component is considered meal insulin (i.e., simulates the normal prandial insulin surge). In this context, important factors to consider in the design of the treatment regimen include the types of insulin to be used for basal and meal coverage and the method of delivery.
INSULIN PREPARATIONS
For the first 60 years after the introduction of insulin therapy in 1922, the only commercially available preparations were animal insulins derived from bovine or porcine pancreatic extracts. Porcine and bovine insulin preparations differ from human insulin by one and three amino acids, respectively. The use of animal insulins, however, was inherently complicated by several issues, including potential supply limitations, incomplete purification, and a propensity to induce the formation of anti-insulin antibodies (which might affect the activity and absorption of the exogenous animal insulin and lead to unpredictable pharmacodynamics, although this relationship is controversial). These issues were reconciled with the introduction of recombinant human insulin in the 1980s.59 The past decade has seen further advances with the introduction of insulin analogues bearing molecular modifications that confer advantageous pharmacokinetics. Recombinant human insulin and the newer analogues are now the main preparations used in the treatment of type 1 diabetes.
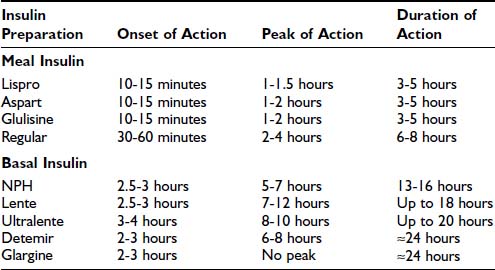
In selecting types of insulin for use in a treatment regimen, the most important parameters to consider are the onset, peak, and duration of action of the given insulin preparation (Table 45-2). Commercially available human insulins and analogues include rapid-, short-, intermediate-, and long-acting preparations. Its pharmacokinetic properties will determine whether a preparation should be used as either meal insulin or basal insulin. Specifically, rapid- and short-acting preparations are used as meal (or bolus) insulins, and intermediate- and long-acting preparations provide basal insulins.
Table 45-2. Approximate Pharmacokinetic Properties of Human Insulin and Insulin Analogues Following Subcutaneous Injection
Human Insulins
Human insulin was the first medication to be commercially manufactured using recombinant DNA technology.60 Currently available human insulins include short-, intermediate-, and long-acting preparations. Each preparation has advantages and disadvantages, which will be considered in turn.
Short-Acting Human Insulin: Regular
Regular recombinant human insulin is identical to the endogenous insulin polypeptide. In solution, however, regular insulin tends to self-associate, first forming dimers and subsequently hexamers. After subcutaneous injection, the absorption of hexameric insulin molecules is delayed, pending dissociation into monomers and dimers, which can diffuse rapidly from subcutaneous tissue into the systemic circulation.61 This slowed absorption has important pharmacokinetic implications, leading to (1) a modestly delayed onset of biologic action in vivo (30 to 60 minutes after injection), (2) a relatively late peak effect (2 to 4 hours after injection), and (3) a prolonged duration of action (6 to 8 hours) (see Table 45-2).62 Clearly, this pharmacokinetic profile is quite different from the rapid and short-lived endogenous insulin response to a mixed meal that is seen in individuals without diabetes. Therefore, although regular insulin was widely used in the past, its role as meal insulin has declined since the introduction of rapid-acting analogues.
Intermediate-Acting Human Insulin: NPH and Lente
The development of intermediate-acting human insulins reflected the need for an exogenous insulin preparation that could mimic the basal insulin secretion that is observed in individuals who do not have diabetes. The principle underlying the development of these insulins is that the rate of absorption of exogenous insulin from subcutaneous tissue can be significantly reduced by manipulating its suspension. First introduced in 1946, Neutral Protamine Hagedorn (NPH) insulin is a suspension of insulin complexed with protamine and zinc.63 NPH is poorly absorbed from subcutaneous tissue, leading to delayed onset of action (2.5 to 3 hours), late peak effect (5 to 7 hours), and prolonged duration of action (13 to 16 hours) (see Table 45-2).62 A second intermediate-acting insulin preparation is lente, a crystalline suspension of insulin with zinc and acetate. It exhibits a pharmacokinetic profile similar to that of NPH, but with a slightly later peak and longer duration of action.
The intermediate-acting insulins show substantial variation in subcutaneous absorption both within an individual patient and between patients, resulting in variable glycemic excursions.64 Indeed, variability in the absorption of intermediate-acting insulin may account for as much as 80% of day-to-day variation in blood glucose concentrations.65 Other factors that contribute to the unpredictability of NPH and lente are dose-dependent changes in pharmacokinetics and the practical variability associated with resuspension of these insulin preparations by the patient before subcutaneous injection.
Given their underlying pharmacokinetic profiles (duration of action of 13 to 18 hours) and clinical variability in action, the intermediate-acting insulins generally do not provide adequate basal insulin coverage. To increase their utility as basal insulins, these preparations are given twice daily in at least 20% of patients with type 1 diabetes.66 Moreover, their peak effect is an undesirable quality in a basal insulin, insofar as it is clearly dissimilar to the relatively peakless profile of basal insulin secretion seen in an individual without diabetes.
Related posts:

Stay updated, free articles. Join our Telegram channel

Full access? Get Clinical Tree


