FIGURE 54-1. Electron microscopic photomicrographs. A, Normal glomerular basement membrane (GBM) on the left compared to thickened GBM from a proteinuric type 1 diabetic patient on the right. B, Normal glomerular capillary loops and mesangial zone. C, Thickened GBM, mesangial expansion (predominantly with mesangial matrix), and capillary lumen narrowing in a proteinuric type 1 diabetic patient.
(From Parving H-H, Mauer M, Ritz E: Diabetic nephropathy. In Brenner BM [ed]: Brenner & Rector’s the kidney, ed 7, Philadelphia, 2004, Saunders, pp 1777–1818.)
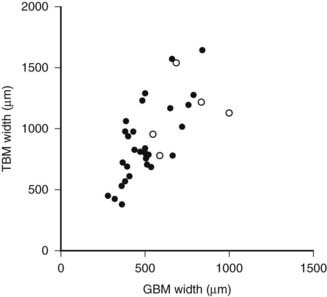
FIGURE 54-2. Relationship of proximal tubular basement membrane (TBM) width and glomerular basement membrane (GBM) width in 35 type 1 diabetic patients, 25 of whom were normoalbuminuric. The hypertensive patients are represented by the open circles. r = 0.64, P < 0.001.
(Data from Brito PL et al: Proximal tubular basement membrane width in insulin-dependent diabetes mellitus, Kidney Int 53:754–761, 1998.)
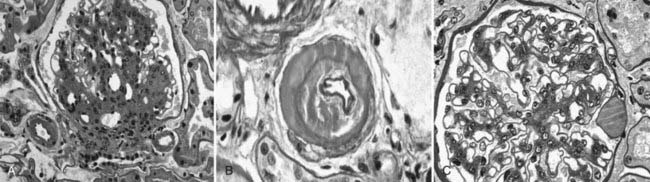
FIGURE 54-3. Light microscopic photomicrographs. A, Afferent and efferent arteriolar hyalinosis in a glomerulus from a type 1 diabetic patient. The glomerulus shows diffuse and nodular mesangial expansion (PAS stain). B, Glomerular arteriole showing almost complete replacement of the smooth-muscle wall by hyaline material and lumen narrowing (PAS stain). C, Glomerulus with minimal mesangial expansion and a capsular drop at 3 o’clock (PAS stain).
(From Parving H-H, Mauer M, Ritz E: Diabetic nephropathy. In Brenner BM [ed]: Brenner & Rector’s the kidney, ed 7, Philadelphia, 2004, Saunders, pp 1777–1818.)
Increases in the fraction of the glomerulus occupied by the mesangium, or mesangial fractional volume [Vv(Mes/glom)], may be measurable after only 4 to 5 years of type 1 diabetes,46 but in most cases, it may take 10 or more years to increase into the abnormal range.47 Mesangial expansion in diabetes mainly results from the accumulation of mesangial matrix material and less from the expansion of the cellular component of the mesangium (see Fig. 54-1C; Fig. 54-4).48 The cortical interstitium is the space between renal tubules, glomeruli, and blood vessels. As a fraction of cortical volume, interstitium [Vv(Int/cortex)] is initially decreased early in type 1 diabetes, perhaps due to expansion of the tubular compartment, which is 85% of the cortex. Moderate increases in Vv(Int/cortex) are primarily due to expansion of the cellular component of the interstitium, the initial explanation for interstitial expansion in type 1 diabetes, whereas increased interstitial fibrillar collagen comes later, with more marked interstitial expansion and in association with already reduced GFR.49
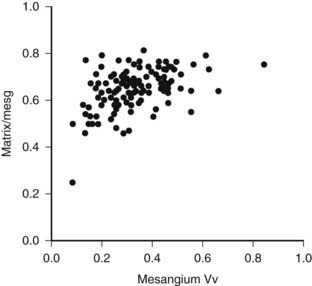
FIGURE 54-4. Mesangial matrix expressed as a fraction of the total mesangial (Matrix/mesg) plotted against mesangial fractional volume (Mesangium Vv) in longstanding type 1 diabetic patients. The normal value for matrix/mesg is approximately 0.5. Note that most diabetic patients have elevated values for matrix/mesg whether or not there is an increase in mesangium Vv (i.e., values above 0.24).
(Data from Steffes MW, Bilous RW, Sutherland DE, et al: Cell and matrix components of the glomerular mesangium in type I diabetes, Diabetes 41:679–684, 1992.)
Abnormalities of the junction of the glomerulus with its tubule, with obstruction of the proximal tubular take-off from the glomerulus and, in the extreme, complete detachment of the tubule from the glomerulus (atubular glomerulus) (Fig. 54-5A to D) occur late in the disease and, in type 1 diabetes, is largely restricted to patients with overt proteinuria (Fig. 54-6).50
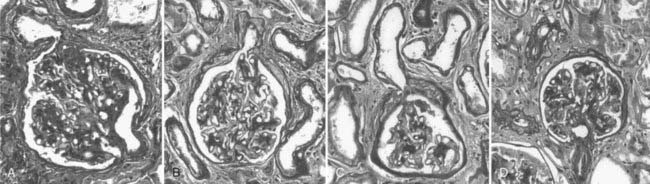
FIGURE 54-5. Glomerulotubular junction (GTJ) abnormalities (GTJA). A, Glomerulus attached to a short atrophic tubule (SAT). The arrow points to the atrophic segment. B, Glomerulus attached to a long atrophic tubule (LAT). The arrow points to the atrophic segment and tuft adhesion. C, Glomerulus attached to an atrophic tubule with no observable opening (ATNO) and a tip lesion (arrow). D, Atubular glomerulus (AG). *Tubular remnants that possibly belonged to the AG.
(From Najafian B, Crosson JT, Kim Y, et al: Glomerulotubular junction abnormalities are associated with proteinuria in type 1 diabetes, J Am Soc Nephrol 17:S53–S60, 2006.)
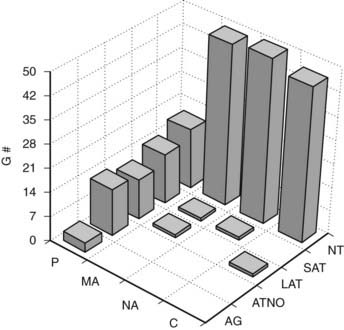
FIGURE 54-6. Frequency of glomerular tubular junction abnormalities (GTJA) in normoalbuminuric (NA), microalbuminuric (MA), and proteinuric (P) patients and control subjects (C). G#, Number of glomeruli; AG, atubular glomerulus; ATNO, atrophic tubule with no observable opening; LAT, long atrophic tubule; SAT, short atrophic tubule; NT, normal tubules.
(Data from Najafian B, Crosson JT, Kim Y, et al: Glomerulotubular junction abnormalities are associated with proteinuria in type 1 diabetes, J Am Soc Nephrol 17:S53–S60, 2006.)
The lesions of diabetic glomerulopathy also progress at varying rates within individual patients.51,52 A given patient may have relatively marked GBM thickening with less advanced mesangial expansion or vice versa (Fig. 54-7).39,51 However, both abnormalities are advanced in the majority of type 1 diabetic patients who develop clinical DN manifesting as proteinuria, hypertension, and declining GFR39,51,52 (see later). In addition to these classic diabetic glomerulopathy lesions (GBM and TBM thickening and mesangial expansion), focal and global glomerulosclerosis, tubular atrophy, interstitial expansion and fibrosis, and glomerulotubular junction abnormalities contribute to the progressive GFR loss which culminates in ESRD.50
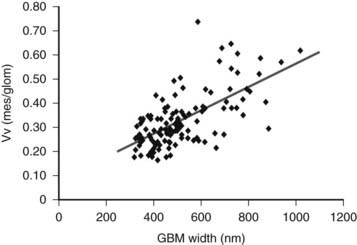
FIGURE 54-7. Relationship between glomerular basement membrane (GBM) width and mesangial fractional volume (Vv[Mes/glom]) in 125 longstanding type 1 diabetic patients, 88 of whom were normoalbuminuric, 17 microalbuminuric, and 18 proteinuric. r = 0.58, P < 0.001.
(Data from Caramori ML, Kim Y, Huang C, et al: Cellular basis of diabetic nephropathy: 1. Study design and renal structural-functional relationships in patients with long-standing type 1 diabetes, Diabetes 51:506–513, 2002.)
Mesangial expansion, occurring relatively evenly in most glomeruli, has been termed diffuse diabetic glomerulosclerosis (Fig. 54-8A to C). Kimmelstiel-Wilson nodular lesions are large round fibrillar areas of mesangial expansion with palisading of mesangial nuclei around the periphery of the nodule, often with extreme compression of the adjacent glomerular capillaries (Fig. 54-9C). These nodules result from glomerular capillary microaneurysm formation (see Fig. 54-9A)53 and subsequent filling of the expanded capillary space with mesangial matrix (see Fig. 54-9B). About half of proteinuric type 1 diabetic patients have some nodular lesions, typically on a background of diffuse diabetic glomerulosclerosis (Fioretto and Mauer, unpublished observations). In the end, clinical DN largely results from marked extracellular matrix (ECM) accumulation whereby over many years, the rate of ECM production exceeds the rate of removal. The ECM that accumulates in mesangium, GBM and TBM is made up of the normal ECM constituents of these sites, including (primarily) types IV and VI collagen, laminin, and fibronectin54 and perhaps additional ECM components not yet identified. “Scar” collagens (mainly collagens I and II) are seen only very late in the diabetic glomerulopathy process, primarily associated with global glomerular sclerosis or developing in the center of nodular lesions.54,55 Understanding the processes that result in ECM accumulation in the mesangium, GBM, and TBM in diabetes is incomplete.56,57 Glomeruli may become globally sclerosed in diabetic patients without other diabetic changes,58 especially in type 2 diabetes (see later). In type 1 diabetic patients, there is a relationship between the severity of arteriolar hyalinosis lesions and the number of globally sclerosed glomeruli, with greater frequency of scarred glomeruli in the plane vertical to the kidney capsule, suggesting that glomerulosclerosis could also be caused by occlusion of medium-sized renal arteries.59 As renal insufficiency progresses, there are increasing numbers of totally scarred glomeruli, glomeruli with capillary closure due to massive mesangial expansion (see Fig. 54-9D), or atubular glomeruli (i.e., glomeruli that are nonfunctioning because they are detached from their tubules (see later).
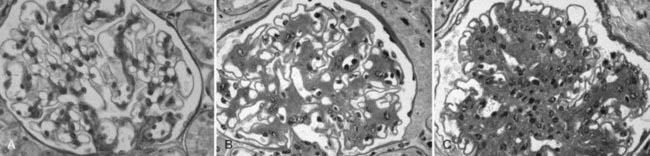
FIGURE 54-8. Light microscopic photomicrographs (PAS stain). A, Normal glomerulus. B, Glomerulus from a normoalbuminuric type 1 diabetic patient with glomerular basement membrane (GBM) thickening and moderate mesangial expansion. C, Glomerulus from a type 1 diabetic patient with overt diabetic nephropathy and severe diffuse mesangial expansion.
(From Parving H-H, Mauer M, Ritz E: Diabetic nephropathy. In Brenner BM [ed]: Brenner & Rector’s the kidney, ed 7, Philadelphia, 2004, Saunders, pp 1777–1818.)
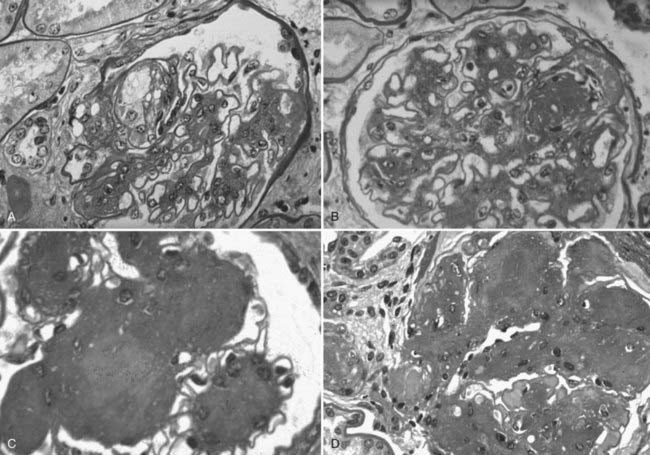
FIGURE 54-9. Light microscopic photomicrographs (PAS stain) of glomeruli from type 1 diabetic patients. A, Capillary microaneurysm (mesangiolysis) at 11 o’clock. B, Nodule formation within a capillary microaneurysm. C, Nodular glomerulosclerosis (Kimmelstiel-Wilson nodules). D, End-stage diabetic glomerular changes with nearly complete capillary closure.
(From Parving H-H, Mauer M, Ritz E: Diabetic nephropathy. In Brenner BM [ed]: Brenner & Rector’s the kidney, ed 7, Philadelphia, 2004, Saunders, pp 1777–1818.)
Numbers of glomerular podocytes are reportedly reduced in patients with type 1 and 2 diabetes,60–63 especially in association with albuminuria and disease progression. This may be at least in part due to increased podocyte detachment from the GBM.64 However, more work is needed to further document and understand these potentially important podocyte abnormalities.
STRUCTURAL-FUNCTIONAL RELATIONSHIPS IN DIABETIC NEPHROPATHY
Mesangial expansion is the major cause of GFR loss in type 1 diabetic patients.51 Increase in Vv(Mes/glom) is strongly inversely correlated with filtration surface (Fig. 54-10) per glomerulus which in turn is strongly directly correlated with GFR in type 1 diabetes.65 Mesangial fractional volume is also directly correlated with AER51,52 (Fig. 54-11A and B) and systemic blood pressure.51,66 The relationships of GBM width with these clinical manifestations of diabetic kidney disease are also important but are somewhat weaker than those for mesangial changes.51,52 However, mesangial and GBM changes together explain most of the AER variability in type 1 diabetes, ranging from normoalbuminuria to proteinuria.52
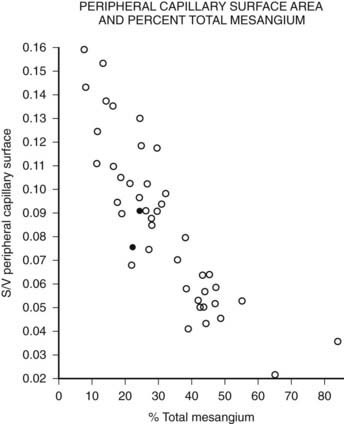
FIGURE 54-10. Relationship of mesangial fractional volume (% total mesangium) and filtration surface density (Sv[peripheral capillary/surface]) in type 1 diabetic patients.
(Data from Mauer SM, Steffes MW, Ellis EN, et al: Structural-functional relationships in diabetic nephropathy, J Clin Invest 74:1143–1155, 1984.)
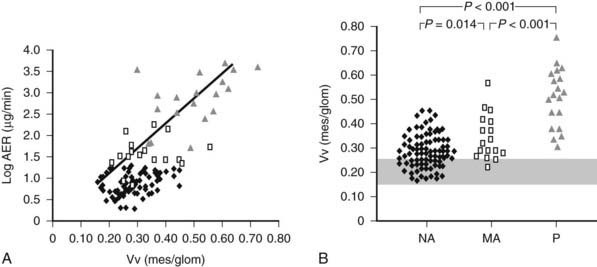
FIGURE 54-11. A, Correlation between mesangial fractional volume (Vv[Mes/glom]) and albumin excretion rate (AER) in 124 patients with type 1 diabetes. ♦ = Normoalbuminuric patients;  = microalbuminuric patients; Δ = proteinuric patients. r = 0.75; P < 0.00l. B, Vv(Mes/glom) in 88 normoalbuminuric (NA), 17 microalbuminuric (MA), and 19 proteinuric (P) patients with type 1 diabetes. The hatched area represents the mean ± 2 SD in a group of 76 age-matched normal control subjects. All groups are different from control subjects.
(Data from Caramori ML, Kim Y, Huang C, et al: Cellular basis of diabetic nephropathy: 1. Study design and renal structural-functional relationships in patients with long-standing type 1 diabetes, Diabetes 51:506–513, 2002.)
As mentioned, decreased podocyte number and detachment are related to albuminuria. Increases in podocyte foot process width also correlate with AER increases in type 1 diabetic patients.61,67,68 If podocyte number or shape changes are early predictors of DN risk,69 this would support an important pathogenetic role for this key glomerular cell in this disease.
Although glomerular capillary filtration surface is directly correlated with GFR in type 1 diabetes,65,70,71 linear regression models only partially explain GFR variability in these patients.52 Global sclerosis58 and interstitial expansion41 are additional independent predictors of GFR loss. However, the conclusion that the interstitium is more important than glomerular changes in diabetes came from studies where most patients were in advanced stages of kidney failure.72–74 At these advanced stages, when serum creatinine is already clearly elevated, especially if above 2 mg/dL, interstitial changes are common to most chronic renal diseases and are not specific to diabetes. During most of the natural history of DN, glomerular parameters are more important determinants of renal dysfunction. Moreover, as already discussed, early interstitial expansion in type 1 diabetes is mainly due to expansion of its cellular component, and increased interstitial fibrillar (scar) collagen is primarily seen in patients whose GFR is reduced,56 while glomerular ECM changes are due to accumulation of basement membrane components. Thus, the interstitial and glomerular changes of diabetes probably have different pathogenetic mechanisms.
Through many years of the natural history of DN, lesions develop without detectable clinical or laboratory abnormalities. Often, when microalbuminuria initially manifests, lesions are far advanced. Once proteinuria is present in type 1 diabetes, GFR loss typically progresses relatively rapidly toward ESRD. This nonlinear clinical course is best reflected by nonlinear analyses of structural-functional relationships.50 Using piecewise linear regression instead of simple linear models, glomerular structural variables alone explained 95% of variability in AER. These glomerular structures, mesangial fractional volume, GBM width and filtration surface density, however, explained less than 80% of GFR variability. This increased to more than 90% with the addition of measures of glomerular tubular junction abnormalities and interstitial expansion.50
In summary, most of the renal functional abnormalities in type 1 diabetes are explained by diabetic glomerulopathy. Structure is highly variable in patients without functional abnormalities. Structural-functional relationships are largely driven by more advanced lesions.
MICROALBUMINURIA AND RENAL STRUCTURE
Persistent microalbuminuria antedates clinical nephropathy, whereas normoalbuminuria in longstanding type 1 diabetic patients predicts lower nephropathy risk. However, the relationship of renal structural changes to low levels of albuminuria (i.e., normal to microalbuminuria) is far from simple. As a group, normoalbuminuric longstanding type 1 diabetic patients have diabetic glomerulopathy lesions.52,75 Their structural measurements range from normal to pathology overlapping in severity with microalbuminuric and proteinuric patients (see Fig. 54-11B; Fig. 54-12B).52,75 Increased GBM width predicts progression to microalbuminuria and proteinuria.75,76 Microalbuminuric patients have on average even more severe lesions, with few type 1 diabetic patients having renal structural measures still within the normal range (see Fig. 54-11B and Fig. 54-12B).52,75 Hypertension and reduced GFR are also more frequent in these patients, so microalbuminuria is a marker of more advanced lesions and other functional disturbances.52,75 However, reduced GFR may be present in normoalbuminuric longstanding type 1 diabetic patients. This is more frequent in females with retinopathy and/or hypertension and is associated with advanced glomerulopathy lesions.23,77,78 Microalbuminuria may not be the first indicator of DN, and careful GFR and blood pressure measurements are needed, especially in female patients with the described characteristics.
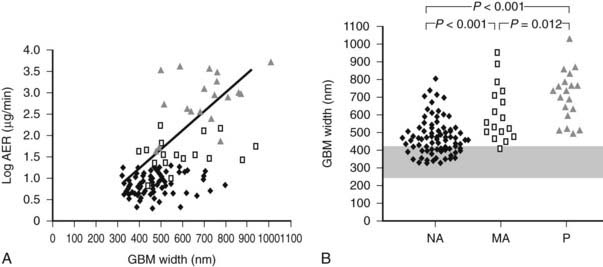
FIGURE 54-12. A, Correlation between glomerular basement membrane (GBM) width and albumin excretion rate (AER) in 124 patients with type 1 diabetes. ♦ = Normoalbuminuric patients;  = microalbuminuric patients; Δ = proteinuric patients. r = 0.62, P < 0.001. B, GBM width in 88 normoalbuminuric (NA), 17 microalbuminuric (MA), and 19 proteinuric (P) patients with type 1 diabetes. The hatched area represents the mean ± 2 SD in a group of 76 age-matched normal control subjects. All groups are different from control subjects.
(Data from Caramori ML, Kim Y, Huang C, et al: Cellular basis of diabetic nephropathy: 1. Study design and renal structural-functional relationships in patients with long-standing type 1 diabetes, Diabetes 51:506–513, 2002.)
Normal identical twins of type 1 diabetic patients have normal renal structure.42 Diabetic twins have greater GBM and TBM width and mesangial fractional volume than their nondiabetic twin, albeit sometimes still within the normal range despite many years of diabetes.42 Over time, all type 1 diabetic patients appear to develop some structural changes of DN, but the rate may be so slow that the lesions would be undetectable except by comparison with their nondiabetic twin and would not lead to clinical disease. There is also striking variability in the rate at which lesions develop in kidneys transplanted into type 1 diabetic patients who all had ESRD secondary to DN.75 This cannot be fully explained by glycemia and suggests genetically determined renal tissue susceptibility.75
Interestingly, studies of type 1 diabetic transplant recipients indicate that having a single kidney does not appear to accelerate the rate of development of DN lesions, arguing against reduced nephron number as a risk factor.79 In fact, proteinuric diabetic patients without advanced renal failure have normal numbers of glomeruli.80 However, reduced glomerular number could be associated with faster GFR decline once overt DN develops.
CONTRASTS IN NEPHROPATHY LESIONS BETWEEN TYPE 1 AND TYPE 2 DIABETES
There have been fewer studies of renal pathology and structural-functional relationships in type 2 diabetes, even though it accounts for more than 80% of ESRD among diabetic patients. A Danish study found that Caucasian proteinuric type 2 diabetic patients have similar structural changes when compared to proteinuric type 1 diabetic patients, and the severity of these changes predicted the subsequent rate of GFR decline.81 However, the authors also noted more variability in glomerular structure in these patients than in type 1 patients, with some type 2 proteinuric patients having minimal or no diabetic glomerulopathy.81 One study from Northern Italy of type 2 diabetic patients biopsied for clinical reasons82 found typical DN lesions in a third of patients; an increase of globally sclerosed glomeruli, severe tubulointerstitial lesions, and minimal or no diabetic glomerulopathy in another third; while the rest showed changes of diabetic glomerulopathy plus changes of other diseases such as proliferative glomerulonephritis and similar changes.82 In another Danish study, most proteinuric type 2 diabetic patients had diabetic changes,83 but about a fourth of those studied had nondiabetic glomerulopathies, including “minimal lesions,” glomerulonephritis, or mixed diabetic and other changes. In this study, all patients with proteinuria and diabetic retinopathy had classical DN lesions, but less than half of those without retinopathy had DN.83 A British study found similar results.84 However, these high rates of diseases other than or superimposed upon DN are almost certainly because the patients in these studies had clinical indications for kidney biopsies, often including atypical clinical courses. In another study from Northern Italy, when renal biopsies in type 2 diabetes were performed solely for research purposes, definable renal diseases other than secondary to diabetes were in fact uncommon.85 However, only about a third of type 2 microalbuminuric patients in this research study had findings typical of diabetic glomerulopathy; approximately a third had minimal abnormalities, and about 40% had varying combinations of global glomerulosclerotic, vascular, and tubulointerstitial lesions out of proportion to their absent to relatively mild diabetic glomerulopathy lesions.85
STRUCTURAL-FUNCTIONAL RELATIONSHIPS IN TYPE 2 DIABETES
Although initially reported to have renal structural-functional relationships that were similar to type 1 patients,86 a more recent study in Japanese type 2 diabetic patients indicated greater heterogeneity.87 A Danish study found fewer glomerular lesions and higher GFR levels in type 2 versus type 1 patients with similar AER.81 Much larger glomerular volumes were found in the type 2 patients, and perhaps this preserved filtration surface.81 Nonetheless, the proteinuria in these type 2 diabetic patients was at least in part unexplained. Mesangial fractional volume increased progressively with albuminuria and global glomerular sclerosis correlated inversely with GFR in Pima Indian type 2 diabetic patients.61 Also, glomerular podocyte loss was related to proteinuria (but not microalbuminuria) in these patients.
The less precise correlation between glomerular structure and renal function in type 2 diabetes is probably due to these more varied patterns of renal injury.85 This is of prognostic significance, since patients with more typical diabetic glomerulopathy lesions are more likely to have progressive GFR loss.33,83
In summary, renal structural changes in type 2 diabetes are more heterogeneous, and diabetic glomerulopathy lesions are on average less severe in type 2 than in type 1 diabetic patients with similar albuminuria levels. Approximately 40% of the type 2 diabetic patients show atypical renal injury patterns. These atypical patterns are associated with higher body mass index and less diabetic retinopathy.85 Thus, the atypical manifestations of renal injury in type 2 diabetes could be related to obesity, hypertension, hyperlipidemia, accelerated atherosclerosis, and aging interacting with the effects of hyperglycemia. The markedly increased risk of ESRD in certain type 2 diabetic populations (e.g., African American, American Indian, Hispanic) could represent variability in the renal consequence of one or more of these pathogenetic influences (e.g., there are differences in the renal structural consequences of hypertension in African American and Caucasian patients,88) genetic susceptibility to DN, or both. Further cross-sectional and longitudinal studies in type 2 diabetic patients are required before these complexities can be better understood.
OTHER RENAL DISORDERS IN DIABETIC PATIENTS
Based on the above discussion, it is strongly recommended that type 1 diabetic patients with proteinuria and less than 10 years duration of diabetes and type 2 diabetic patients with proteinuria and no retinopathy should be referred to a nephrologist and be fully evaluated for other renal diseases. In these cases, renal biopsy should be strongly considered both for diagnosis and prognosis purposes.
DIABETIC NEPHROPATHY LESIONS ARE REVERSIBLE
Despite rapid reversal of mesangial expansion in rats cured of diabetes by islet transplantation,89 there was no improvement in DN lesions in the native kidneys of type 1 diabetic patients normoglycemic for 5 years after successful pancreas transplantation.90 However, after 10 years of normoglycemia, there was dramatic healing of diabetic renal lesions.91 GBM and TBM width and mesangial fractional volume were lower at 10 years versus baseline and 5 years, often with these structural parameters having returned to the normal range (Fig. 54-13A and B).91 The reduction in mesangial expansion primarily resulted from the disappearance of excess mesangial matrix material (see Fig. 54-13C and D). Light microscopy revealed remarkable glomerular architectural remodeling, often including the complete disappearance of Kimmelstiel-Wilson nodules (Fig. 54-14A to C) and increased patency of glomerular capillaries.91 It is not clear why reversal of lesions was not seen in the first 5 years. Perhaps there was cellular (epigenetic) memory for the diabetic state. Alternatively, glycation of ECM may have slowed the degradation process. Unlike the normal situation where throughout adult life, glomerular ECM content remains quite constant,92 this healing process requires ECM removal to exceed production. Thus, the cellular recognition of an abnormal structural environment and the cellular machinery to initiate and sustain the healing and remodeling processes must exist. Remodeling and healing in the tubulointerstitium also occurred in these patients.93 There was an estimated decrease in total amount of cortical interstitial collagen and disappearance of atrophic tubules, the latter presumably through reabsorption.93 If it becomes possible to stimulate these healing processes over the processes of injury, DN could be delayed or prevented.
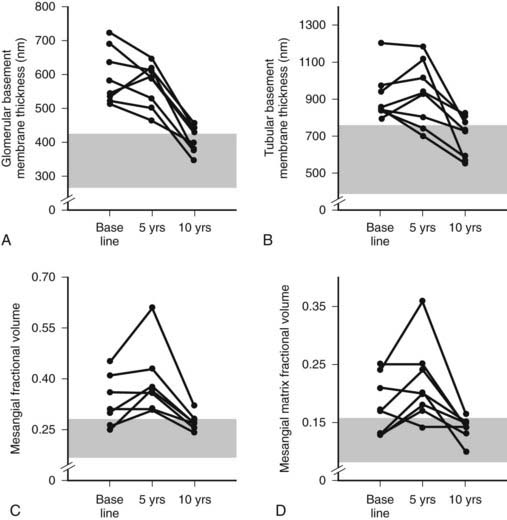
FIGURE 54-13. Thickness of the glomerular basement membrane, thickness of the tubular basement membrane, mesangial fractional volume, mesangial-matrix fractional volume at baseline, and 5 and 10 years after pancreas transplantation. The shaded area represents the normal ranges obtained in the 66 age- and sex-matched normal controls (mean ± 2 SD). Data for individual patients are connected by lines.
(Data from Fioretto P, Steffes MW, Sutherland DE, et al: Reversal of lesions of diabetic nephropathy after pancreas transplantation, N Engl J Med 339:69–75, 1998.)
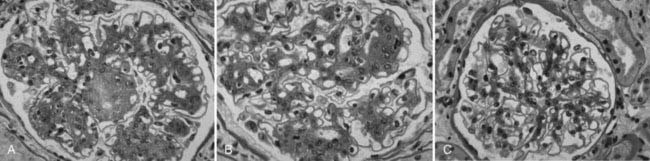
FIGURE 54-14. Light microscopic photomicrographs (PAS stain) of renal biopsy specimens obtained before and after pancreas transplantation from a 33-year-old woman with type 1 diabetes of 17 years’ duration at the time of transplantation. A, Typical glomerulus from the baseline biopsy specimen, which is characterized by diffuse and nodular (Kimmelstiel-Wilson) diabetic glomerulopathy. B, Typical glomerulus 5 years after transplantation, with persistence of the diffuse and nodular lesions. C, Typical glomerulus 10 years after transplantation, with marked resolution of diffuse and nodular mesangial lesions and more open glomerular capillary lumina.
(From Fioretto P, Steffes MW, Sutherland DE, et al: Reversal of lesions of diabetic nephropathy after pancreas transplantation, N Engl J Med 339:69–75, 1998.)
Genetic Predisposition to Diabetic Nephropathy
Genetic predisposition is a strong DN determinant in both type 1 and type 2 diabetes; only about half of patients with poor glycemic control develop DN,94 whereas some patients do so despite relatively good control—findings consistent with genetically modulated risk. Differences in the prevalence of DN in different patient populations also support this view.10,95,96 Genetic predisposition to DN is supported by several cross-sectional studies of siblings concordant for type 197–100 and type 2101–105 diabetes. There is a large difference (300% to 800%) in the cumulative risk of DN between siblings of probands with or without DN. Moreover, there is a strong correlation for the severity and patterns of glomerular lesions in type 1 diabetic sibling pairs.106 Although some of the data are consonant with a major gene effect with an autosomal dominant mode of inheritance, more recent genomewide studies suggest a more complex picture (see later).
FAMILIAL STUDIES OF BLOOD PRESSURE, CARDIOVASCULAR DISEASE, AND DIABETIC NEPHROPATHY
Several studies showed associations between DN and predisposition to hypertension and cardiovascular disease.107–112 Higher blood pressure levels and increased prevalence of hypertension have been described in nondiabetic parents of proteinuric and microalbuminuric type 1107–109 and type 2111 diabetic patients. Diabetic patients with advanced nephropathy also had higher mean arterial blood pressures during adolescence,109 and prediabetic blood pressure levels predicted AER after diabetes onset.110 The prevalence of cardiovascular disease and cardiovascular death was greater in the parents of type 1 diabetic patients with nephropathy,112 and DN patients who had suffered a cardiovascular event more often had a positive family history of cardiovascular disease. This indicates that familial predisposition to cardiovascular disease increases both the risk of nephropathy and the risk of cardiovascular disease in type 1 diabetic patients with nephropathy, linking the pathogenesis of DN to factors also favoring the development of atherosclerosis.107,108,113 Moreover, AER and blood pressure levels were linked and heritable in Caucasian families with type 2 diabetes.114
SODIUM/LITHIUM AND SODIUM/HYDROGEN COUNTERTRANSPORT
Sodium/lithium (Na+/Li+) countertransport activity, a genetically regulated system linked to hypertension and cardiovascular disease in nondiabetic persons,115 was increased in microalbuminuric and proteinuric type 1108,116,117 but not in type 2118 diabetic patients. Increased Na+/Li+ countertransport activity has also been described in parents of proteinuric type 1 diabetic patients119 and is similar in identical twin pairs discordant for type 1 diabetes120 where both twins had values higher than age-matched nondiabetic controls.120 Raised erythrocyte Na+/Li+ countertransport activity was associated with a fourfold increased risk of development of persistent microalbuminuria in patients with type 1 diabetes.121
Na+/Li+ countertransport has parallels with the sodium/hydrogen (Na+/H+) antiport exchange system involved in the regulation of intracellular pH, cell volume and growth, and proximal tubular sodium reabsorption.122 The Na+/H+ antiport activity is increased in leukocytes123 and cultured skin fibroblasts124–126 of type 1 and type 2 diabetic patients with microalbuminuria and proteinuria. Also, since cultured skin fibroblast Na+/H+ antiport activity was highly correlated among sibling pairs concordant for type 1 diabetes and for DN lesions,127 and independent of environmental factors, it was suggested that these cultured skin fibroblast abnormalities are at least in part genetically regulated.
DIABETIC NEPHROPATHY GENES
As already noted, genetic predisposition to DN has been strongly suggested in studies of siblings concordant for type 197,98,100 and type 2101,103 diabetes. There are ongoing searches for genetic loci related to DN susceptibility through genomic scanning and candidate gene approaches, although neither approach has yet yielded definitive results,128–130 probably because multiple genes are involved.128,129 Sib-pair studies in Pima Indian families with type 2 diabetes showed linkage between four chromosomal regions (chromosomes 3, 7, 9, and 20) and DN, the strongest one in chromosome 7.131 Previous studies in Caucasian populations have shown linkage between DN and chromosome 7q in type 2 diabetic patients132 and chromosome 3q in type 1 diabetic patients.133 Segregation analysis studies in Caucasian families with type 2 diabetes also suggest a major gene effect for AER.134 In the Family Investigation of Nephropathy and Diabetes (FIND) study, a genomewide scan demonstrated multiple chromosomal regions linked to estimated GFR in multiethnic families ascertained by a proband with DN,135 but these may be related more to DN progression than to DN risk.
Genetic polymorphisms in candidate genes have been evaluated in several studies. Associations with DN risk have also been reported for polymorphisms in the human inducible nitric oxide synthase,136 ectonucleotide pyrophosphatase/phosphodiesterase-1,137 heparan sulfate proteoglycan,138 paraoxonase 2,139 matrix metalloproteinase-9 (MMP-9),140 transforming growth factor-β1 (TGFB1),141 protein kinase C (PKCB),142 and haptoglobin143 genes. Studies of polymorphisms in endothelial nitric oxide synthase (eNOS),144–146 aldose-reductase,147–149 plasminogen activator inhibitor 1,150,151 interleukin 1,152,153 apolipoprotein E,154–157 glucose transporter-1 (GLUT1),158,159 and methylenetetrahydrofolate reductase160,161 genes showed conflicting results. Many other candidate genes have been studies.70–82 A leucine repeat of the carnosinase (CNDP1) gene was associated with DN in both type 1 and type 2 diabetic patients.162,163 Also, multiple variations in the superoxide dismutase 1 (SOD1) gene were significantly associated with development of persistent microalbuminuria and severe nephropathy in type 1 diabetic patients enrolled in the Diabetes Control and Complications Trial/Epidemiology of Diabetes and Its Complications (DCCT/EDIC) study.164
One particularly extensively studied set of genes are those related to the renin-angiotensin system. Polymorphism in the angiotensin converting enzyme (ACE) gene, consisting of an insertion or a deletion (I/D) of a 287-base-pair sequence that determines most of the interindividual variance in the ACE activity, has also been associated with rate of GFR decline in nondiabetic renal diseases.165 It remains unclear if this ACE polymorphism is important in the genesis of DN,166–170 although a follow-up study supports this view.171 I/D ACE polymorphism may be involved in the progression of DN and the response to ACE inhibitor therapy.172–174 Normoalbuminuric and microalbuminuric type 1 diabetic patients with the II genotype appears to have the fastest increase in AER174 and the best response to ACE inhibitor therapy.173,174 On the other hand, D was the risk allele for development of DN after 6 years of follow-up of Caucasian type 1 diabetic patients.171 The, DD genotype was also more frequent in normoalbuminuric or microalbuminuric Japanese type 2 diabetic patients who doubled AER or changed AER class (progressors) than in patients who did not progress after 10 years of follow-up.172 Although progression was not be associated with ACE genotype in Caucasian normoalbuminuric or microalbuminuric type 2 diabetic patients,175 patients with II genotype (n = 11) did not decrease GFR after 9 years of follow-up. Moreover, presence of the D allele in Caucasian type 2 diabetic patients was related to the presence of more severe DN lesions.176 Other studies did not observe an association between this ACE gene polymorphism and DN129,151,177–186 or rate of GFR decline187 in type 1 or type 2 diabetic patients. One meta-analysis concluded that the D allele was significantly associated with DN in a dominant model (DD + ID versus II) in both type 1 and type 2 diabetic patients.188 Another found this association to be significant in Japanese type 2 diabetic patients but not in Caucasian type 1 or type 2 diabetic patients.189
Association with DN risk in type 1 or type 2 diabetic patients and polymorphisms in the angiotensinogen gene was found in some190,191 but not in all181,182,192,193 studies. One study observed association between the T-allele of the angiotensinogen gene and elevated AER only when interaction with the D-allele of the ACE I/D polymorphism was considered.194 Interactions between ACE and angiotensinogen gene polymorphism have been previously described in cross-sectional166 but not confirmed in longitudinal171 studies. A meta-analysis did not find association between angiotensinogen gene polymorphism and DN.195 Two large studies did not find a role for angiotensin II type 1 receptor polymorphism in DN,196,197 while another found this polymorphism to significantly contribute to DN risk in type 1 diabetic patients only when accompanied by poor glycemic control.198
In summary, the genetic determinants of DN risk are not fully understood, and it is likely that several genes with moderate or small effects interacting with the metabolic abnormalities of diabetes may be responsible for the genetic susceptibility to DN. The failure to find reproducible DN-associated candidate genes may be related to inadequate number of subjects, different ascertainment strategies, real genetic differences among populations, selection bias, poor study design, weak genetic contribution, wrong candidate selection, or combinations thereof. Hopefully, the ongoing genomewide studies will clarify this still-confusing area.
Related posts:

Stay updated, free articles. Join our Telegram channel

Full access? Get Clinical Tree


