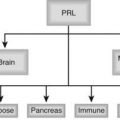
FIGURE 46-1. Feedback control of ketosis during an extended fast. Ketogenesis is activated by a rise in the molar ratio of glucagon to insulin, which induces lipolysis in adipose tissue and fatty acid oxidation in the liver. As the concentrations of circulating fatty acids and ketones rise, the β cell is stimulated to release insulin, with lipolytic rates fixed at modest levels and further rise in glucagon limited. These adaptations allow modest ketosis without the danger of ketoacidosis. In insulin-dependent diabetic subjects, the insulin loop is missing.
This feedback loop, which elicits a modest elevation in insulin, prevents a further increase in the rate of lipolysis, thereby fixing ketogenesis in a safe range through substrate limitation. Ketones may have a minor direct inhibitory effect on lipolysis, but the insulin-inhibitory event is doubtless dominant.
In diabetes, the omission of insulin or a stress-induced counterregulatory hormone release that overrides the effect of the usual dose of insulin initiates a process qualitatively similar to fasting, with the exception that the insulin segment of the feedback loop is missing.10,13,20 As a consequence, concentrations of free fatty acids and ketone bodies rise in an uncontrolled fashion and produce acidosis, coma, and death.
HORMONAL INITIATION OF KETOACIDOSIS
For many years, the hormonal abnormality initiating the hyperglycemia and metabolic acidosis that accompany DKA was thought to be insulin deficiency alone. It is now clear that this view is incorrect and that insulin deficiency coupled with glucagon excess, that is, a rise in the molar ratio of glucagon to insulin, is the operative mechanism. The evidence in support of this concept has been extensively reviewed.12,22,23 The most important study was that of Gerich and colleagues, who showed that withdrawal of insulin from patients with insulin-dependent diabetes was accompanied by rapid increases in plasma glucagon, glucose, and ketone levels that were markedly obtunded when glucagon release was blocked by somatostatin.24
The role of glucagon in inducing hepatic glucose overproduction in uncontrolled diabetes parallels its actions during an overnight fast, in which about 75% of glucose output can be shown to be glucagon mediated.25 Further evidence that glucagon is critical to the initiation of hyperglycemia comes from studies in which simultaneous insulin and glucagon deficiency was produced by infusion of somatostatin26 or total pancreatectomy.27 If insulin deficiency alone were the cause of severe hyperglycemia, one would expect significant overproduction of glucose under both experimental circumstances. In neither dogs nor humans did such overproduction occur. Similarly, patients with somatostatinoma, who have suppression of both glucagon and insulin, exhibit only mild hyperglycemia, an additional finding compatible with the interpretation that major increases in plasma glucose levels occur only in the presence of a relative or absolute excess of glucagon.28
Glucagon also appears to play a central role in initiating ketogenesis. As noted previously, blockade of glucagon release markedly slows the appearance of ketosis in diabetic patients withdrawn from insulin.24 Conversely, administration of glucagon to diabetic humans enhances the conversion of fatty acids to ketone bodies.29–31 Along the same lines, the presence of a glucagonoma resulted in plasma ketone levels four times normal despite the fact that free fatty acid concentrations were not elevated.32 Glucagonoma may also cause ketoacidosis in the face of intact β cells.33 Direct demonstration of the powerful ketogenic effect of glucagon in the liver came from studies in which rats were administered glucagon in vivo (in both physiologic and pathophysiologic amounts).34 The animals did not become either hyperglycemic or ketotic, because a compensatory rise in insulin (secondary to glucagon infusion) allowed disposal of the glucose produced by the liver and prevented a rise in free fatty acids. When the livers from these animals were removed and perfused with fatty acids, they exhibited the shift to activated fatty acid oxidation and ketogenesis expected in fasting and uncontrolled diabetes. Thus a ketogenic liver had been produced in nonketotic animals despite the presence of concentrations of insulin in plasma that were higher than normal. Glucagon has also been shown to stimulate ketone body production directly in homogenates of liver, liver slices, hepatocytes, and isolated perfused liver.35
Although there is good evidence that the molar ratio of glucagon to insulin is the primary control unit for carbohydrate and lipid metabolism, this finding does not imply that other hormones do not play a role. Most systems in the body have redundant regulatory mechanisms, and catecholamines, cortisol, growth hormone, and thyroid hormones can all increase rates of hepatic ketogenesis, albeit less efficiently.36,37 Concentrations of counterregulatory hormones are elevated on admission in patients with ketoacidosis,38,39 either as the consequence of an initiating illness, such as infection, or in response to the stress of ketoacidosis itself. However, when ketoacidosis is induced by withdrawing insulin from well-controlled subjects with insulin-dependent diabetes, glucagon concentrations rise before any increase in other counterregulatory hormones, which suggests that the α-cell hormone is pivotal in causing metabolic decompensation.40,41
Functionally, the two hormones are metabolic antagonists in directing fuel production and utilization.11,12 They act independently through distinct receptors and focus on different target tissues. The primary direct effects of insulin are probably on muscle and fat (to enhance glucose transport into cells and inhibit lipolysis), whereas the primary direct effects of glucagon are exerted on the liver (to increase glycogenolysis, gluconeogenesis, and ketogenesis). It is attractive to consider that in the primary domain of each hormone, the other acts predominantly as an antagonist. Good evidence indicates that insulin functions to a large extent as an antiglucagon in the liver, with direct effects being minimal in the absence of glucagon-induced metabolic changes.31,42,43 The insulin signaling pathway is very complicated, but it is initiated by phosphorylation of intracellular substrates after binding to its receptor.44,45 Most of the initial effects of glucagon are consequent to the generation of cyclic adenosine monophosphate (cAMP).46 In rodents, glucagon can act independently of cAMP, possibly through the protein kinase C signaling system.47 It is probable that a single glucagon receptor activates both pathways,48,49 although isoforms could exist. Counteraction of glucagon by insulin may be the result of direct inhibition of the cAMP-dependent protein kinase.50
HYPERGLYCEMIA
The hyperglycemia of uncontrolled diabetes is caused by two alterations in glucose metabolism: increased hepatic glucose production and diminished utilization of the hexose in muscle and adipose tissue. When insulin is withdrawn from well-controlled subjects with insulin-requiring diabetes, hepatic glucose output doubles within 2 hours.41 Simultaneously, clearance of glucose from plasma decreases consequent to falling insulin concentrations. Doubtless, insulin resistance contributes to the decreased uptake and utilization of glucose.51 A significant part of the resistant state may be caused by the accumulation of fat within insulin target tissues. Increased fatty acid oxidation then results in impairment of insulin signaling to the glucose transport machinery and suppression of glucose metabolism.52–54 A third factor, present to a variable extent, is volume depletion secondary to the hyperglycemia-induced osmotic diuresis. If this complication becomes severe enough to cause a fall in urine output, the escape pathway for glucose is removed, and the hyperglycemia worsens.55 This response accounts for the fact that administration of fluids alone can lower the plasma glucose concentration in ketoacidosis.39
The mechanisms by which a rise in the molar glucagon-to-insulin ratio alters hepatic glucose metabolism have been the subject of much study. Cyclic-AMP-dependent activation of glycogenolysis represents one component. Another involves acceleration of the gluconeogenic pathway. In uncontrolled diabetes (or in conditions of glucose need such as fasting or exercise), increased hepatic glucose production is mediated by a fall in phosphofructokinase (PFK) activity, which inhibits glycolysis (flux from glucose 6-phosphate → pyruvate), and a rise in fructose 1,6-bisphosphatase activity (FBPase), which removes a block to gluconeogenesis (flux over the sequence pyruvate → oxaloacetate → phosphoenolpyruvate → glucose 6-phosphate → glucose). The latter pathway is fed primarily by amino acids transported from muscle (primarily alanine and glutamine), lactate, and (to a small extent) glycerol.10 Substrate traffic over the switch point was originally thought to be mediated primarily by fructose 2,6-bisphosphate (F-2,6-P2), a regulatory intermediate that stimulates PFK and inhibits FBPase.56,57 In vitro F-2,6-P2 activates PFK allosterically and inhibits FBPase competitively. F-2,6-P2 levels are controlled by an interesting bifunctional enzyme, 6-phosphofructo-2-kinase/fructose 2,6-bisphosphatase (PFK-2/FBPase-2). Glucagon excess (relative to insulin), acting through the generation of cAMP, causes a fall in F-2,6-P2 concentrations as a result of phosphorylation of PFK-2/FBPase-2 converting it from a kinase to a phosphatase, with the result that synthesis of F-2,6-P2 slows or ceases and its hydrolysis commences (Fig. 46-2).
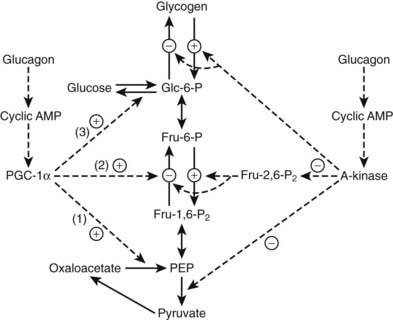
FIGURE 46-2. Regulation of glycolysis and gluconeogenesis by glucagon. Glucagon blocks glycolysis and activates gluconeogenesis by altering two major mediators, fructose 2,6-bisphosphate (Fru-2,6-P2) and peroxisome proliferator activate receptor coactivator 1α (PGC-1α). Phosphorylation of 6-phosphofructokinase/fructose 2,6-bisphosphatase by cyclic AMP dependent kinase (A kinase) converts the enzyme from a kinase to a phosphatase, thereby inhibiting synthesis of Fru-2,6-P2 and blocking glycolysis (see text). The A-kinase also activates glycogenolysis, inhibits glycogen synthesis, and inhibits pyruvate kinase. Glucagon stimulates PGC-1α synthesis and activity. PGC-1α, a master metabolic regulator, primarily enhances gluconeogenesis via induction of the gluconeogenic enzymes phosphoenolpyruvate carboxykinase (1), fructose 1,6-bisphosphatase (2), and glucose 6-phosphatase (3). Dashed lines indicate regulatory activities.
There is no doubt that F-2,6-P2 is the only significant activator of PFK and is thus responsible for stimulation of glycolysis in liver in the fed state (low glucagon-to-insulin ratio). However, it appears that F-2,6-P2 is not present in sufficient concentrations to inhibit FBPase after refeeding in vivo.58,59
When fasted rats were fed glucose, gluconeogenesis measured by nuclear magnetic resonance (NMR) spectroscopy showed no inhibition despite significant increases in F-2,6-P2.59 It may well be that diminished F-2,6-P2 directly accounts for the inhibited glycolysis of fasting or diabetes, but it may not be primarily or significantly responsible for activating gluconeogenesis. Interestingly, F-2,6-P2 has multiple effects beyond control of glycolysis and gluconeogenesis.60 Increases in the primary gluconeogenic enzymes may account for increased gluconeogenic flux. A major factor appears to be increased synthesis of peroxisome proliferator-activated receptor γ-coactivator-1α (PGC-1α), which stimulates gluconeogenesis by activating synthesis of phosphoenolpyruvate carboxykinase, fructose-1, 6-bisphosphatase and glucose-6-phosphatase.61,62 Glucagon-induced production of cAMP, acting through the cAMP response element binding protein (CREB) gene is necessary for PGC-1α synthesis and activation.63 PGC-1α in turn coactivates the hepatic glucocorticoid receptor and the transcription factor hepatic nuclear factor 4α, both of which are necessary for full enhancement of gluconeogenesis (see Fig. 46-2). PGC-1α is involved in many other pathways, including mitochondrial biogenesis and fatty acid oxidation, as will be discussed later.62 The PGC-1α isoform induces both gluconeogenesis and fatty acid oxidation in the liver; PGC-1β induces oxidation only.64
Additional enzymes are altered under catabolic conditions such as fasting and uncontrolled diabetes. For example, pyruvate carboxylase, a distinctive third gluconeogenic enzyme, is also elevated.57,65 Final rates of gluconeogenesis are influenced not only by changes in the key enzymatic activities induced directly by alterations in the glucagon-to-insulin ratio but also by the modulating effects of other hormones,66,67 availability of substrate,68 rates of fatty acid oxidation,53 and transcription factors like Fox 01.69 In short, it is best to consider the changes leading to glucose overproduction in the liver as reflecting a coordinated series of alterations downstream from the hormonal initiators.
KETOGENESIS
Metabolic acidosis caused by the overproduction of acetoacetic and β-hydroxybutyric acids requires changes in the metabolism of adipose tissue and the liver.70,71
Long-chain fatty acids derived from triglyceride stores in the adipocyte are the principal substrate for ketone production in the liver. Only under circumstances in which fatty acid oxidation in the hepatocyte is blocked do amino acids such as leucine function efficiently as precursors for acetoacetate synthesis.72 Long-chain fatty acids are mobilized from fat stores under the combined influence of insulin deficiency/counterregulatory hormone excess acting on the intracellular hormone-sensitive lipase.10,73 It is likely that the major activator is cAMP, a rise in its concentration leading to phosphorylation and enhanced activity of the enzyme. Negative modulation is mediated by a membrane phosphoprotein called perilipin A coupled to insulin’s suppressive effect. Ordinarily, ketone production is dependent on delivery of fatty acids to the liver. However, if the liver is fatty, which is not uncommon in cases of poorly controlled diabetes, hepatic triglyceride may serve as the source of fatty acids. This adaptation accounts for differences in the ease of reversibility of ketosis. Ingestion of a small amount of carbohydrate after a fast calls forth endogenous insulin release and immediately reverses fasting ketosis by inhibiting lipolysis in the adipocyte. In DKA, because the liver contains significant amounts of triglyceride, ketogenesis continues for hours after free fatty acid levels in plasma have returned to normal. How intracellular triglyceride lipase activity in the liver is controlled is not well understood. It is possible that a hormone-sensitive lipase activated by glucagon is operative.30,74
Although increased transport of fatty acids to the liver is normally required for significant ketogenesis to supervene, increased fatty acids alone are not enough. In the normal, nonfasted state, fatty acids taken up into the hepatocyte are reesterified to triglyceride and transported back out into plasma as very-low-density lipoprotein.70 Rates of fatty acid oxidation are low. However, when the molar ratio of glucagon to insulin rises, fatty acid oxidation is disinhibited, and incoming fatty acids can be converted to acetoacetate and β-hydroxybutyrate. The key regulatory site for fatty acid oxidation is the initial step in the process catalyzed by the enzyme carnitine palmitoyltransferase I (CPT I)70,75,76 (Fig. 46-3).
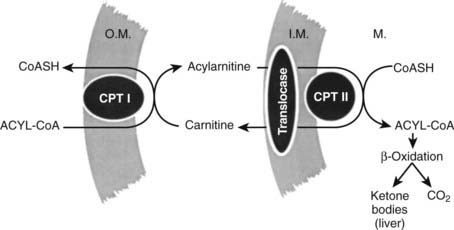
FIGURE 46-3. The fatty acid oxidizing system in the liver. Long-chain fatty acids are activated to coenzyme A (CoA) derivatives on arrival in the liver (acyl-CoA). Acyl-CoA cannot traverse the mitochondrial inner membrane. Entry is accomplished by transesterification to carnitine by carnitine palmitoyltransferase I (CPT I) located in the outer membrane (O.M.). Transport across the inner membrane (I.M.) is accomplished by the translocase carnitine/acylcarnitine translocase. Reversal of the transesterification then occurs on the matrix side by carnitine palmitoyltransferase II (CPT II). The capacity for fatty acid oxidation is fixed and large, so normally the rate-limiting step is CPT I. Tricarboxylic acid cycle activity is low in the liver (acetyl-CoA → CO2), so the bulk of oxidized fatty acid goes to ketone bodies.
Its function is to effect conversion of the coenzyme A (CoA) esters of long-chain fatty acids to acylcarnitines, which unlike fatty acyl CoAs, can be transported across the inner mitochondrial membrane by carnitine/acylcarnitine translocase (CACT).77 Once through the membrane, the reaction is reversed by CPT II, and the newly re-formed fatty acyl CoA enters the fatty acid oxidative pathway. In the liver, the major product is ketone bodies, and terminal oxidation to carbon dioxide and water is limited. In tissues such as the muscle and the heart, complete oxidation of fatty acids to carbon dioxide and water results in the generation of adenosine triphosphate in the electron transport chain. CPT I exists in three isoforms. CPT1A is the liver form, CPT1B is the muscle form, and CPT1C is the brain form,76 but it is also found in testis. In the fed state and with well-controlled diabetes, CPT I is inhibited by malonyl CoA.78 The total amount of enzyme present does not change markedly through wide swings of the regulatory cycle.79 Regulation of fat oxidation by malonyl CoA makes physiologic sense because it is also the first committed intermediate in long-chain fatty acid synthesis. When malonyl CoA concentrations are high, the inhibitory interaction with CPT I precludes oxidation of the newly formed fatty acids and avoids an energetically wasteful futile cycle.70,71 Malonyl CoA concentrations are maximal in the fed state, but they fall rapidly with fasting and uncontrolled diabetes. This change, coupled with desensitization of CPT I to the inhibitor, poises the liver for ketogenesis80,81; accelerated production of acetoacetate and β-hydroxybutyrate begins when long-chain fatty acids arrive in the liver at increased concentrations. Once CPT I and the oxidative sequence is activated, rates of ketogenesis reflect substrate concentration; that is, the higher the concentration of fatty acids, the greater the ketone production until Vmax is reached.
The mechanism by which malonyl CoA inhibits CPT I is still not completely understood. It is believed that malonyl CoA binds through the CoA moiety at the palmitoyl CoA site on the enzyme and that its carboxyl group forms an ionic interaction with an amino acid, probably histidine, at a separate site. When bound, the regulator impairs palmitoyl CoA binding directly and by alteration of membrane fluidity.80,82 Molecular cloning of CPT I has definitively eliminated the possibility that malonyl CoA binds to a separate regulatory subunit.83
As mentioned earlier, the activation of fatty acid oxidation as well as gluconeogenesis is enhanced by peroxisome-proliferator γ-coactivator 1. Both α and β isoforms of PGC-1 stimulate mitochondrial biogenesis, including the genes of fatty acid oxidation. They also activate the oxidative pathway.84–86 Glucagon-stimulated cAMP formation causes transcriptional induction of PGC-1α, which in turn activates carnitine palmitoyltransferase 1A expression in the liver, the rate-limiting step in fatty acid oxidation.86 Peroxisome-proliferator-activated receptors themselves play a prominent role in lipid metabolism. PPAR-α in liver and PPAR-δ in adipose tissue induce the genes of β-oxidation utilizing PGC-1α.87
PPAR-γ induces lipogenesis and fat storage in contrast to PPAR-α. The most potent stimulator of lipogenesis appears to be the transcription factor SREPB-1c (sterol response element binding protein-1c) which is activated by insulin.69,88 SREBP-1c transcriptionally increases all the genes for fatty acid synthesis, especially acetyl CoA carboxylase and fatty acid synthase. Glucagon inhibits SREBP-1c activation,88 so the ratio of glucagon to insulin is the actual regulator, as is generally true in the metabolism of carbohydrate and lipids described earlier. Another pro-lipogenic transcription factor is carbohydrate responsive element binding protein (ChRBP).89,90 It is regulated by xyulose-5-phosphate, which is increased by carbohydrate feeding.90
All of the above factors account for the reciprocal relationship between fatty acid oxidation and fatty acid synthesis. Simultaneous activation of both pathways is never allowed. Malonyl CoA directs traffic between the two pathways. As noted earlier, an increase in the molar glucagon-to-insulin ratio (a relative or absolute glucagon excess) inhibits glycolysis at the phosphofructokinase step. This inhibition of glycolysis interrupts flux from glucose 6-phosphate down the glycolytic pathway to pyruvate, which in turn causes a fall in cytosolic citric acid.81 A lowered citrate concentration has dual effects: decreased production of cytosolic acetyl CoA, the substrate for malonyl CoA formation (citrate is the source of cytosolic acetyl CoA via the citrate cleavage enzyme), and deactivation of acetyl CoA carboxylase, the enzyme that catalyzes the conversion of acetyl CoA to malonyl CoA (citrate activates the carboxylase allosterically).91
Acetyl CoA carboxylase (ACC) is sensitive to inhibition by phosphorylation, which in a setting of high glucagon/low insulin, appears to be mediated primarily by AMP-activated protein kinase.92 Cyclic AMP-dependent kinase may also phosphorylate ACC.91 It can likewise be inhibited by long-chain acyl CoA.93 Nitric oxide, which activates guanylyl cyclase with production of cyclic GMP, blocks both acetyl CoA carboxylase and fatty acid synthase.94 Interestingly, cyclic GMP has the capacity to directly stimulate carnitine palmitoyltransferase IA.94 Consensus is that AMP-kinase is the primary inhibitor. AMP-kinase further lowers malonyl CoA levels by phosphorylating and activating malonyl CoA decarboxylase, so that inhibited production is coupled with enhanced destruction.95,96 Acetyl CoA carboxylase exists in two isoforms, ACC1 (or α) is found primarily in the liver and adipose tissue while ACC2 (β) is dominant in cardiac and skeletal muscle.97 Regulation is thought to be the same in each.
The block in glycolysis is probably the dominant early mechanism. This conclusion is based on the observation that the citrate content in hepatocytes isolated from short-term fasted animals can be increased with the addition of lactate and pyruvate, which causes a rise in the malonyl CoA concentration and diminished ketone production.81 Because three-carbon intermediates that enter the glycolytic pathway below the glucagon-induced block immediately reinitiate the sequence citrate → acetyl CoA → malonyl CoA, it can be concluded that early in a fast, acetyl CoA carboxylase is not fully inactivated. When fasting is prolonged or diabetes is uncontrolled over an extended period, the AMP-kinase mechanism becomes operative. Ultimately, synthesis of acetyl CoA carboxylase also decreases and renders reversal of ketogenesis more difficult. A summary of the metabolic changes occurring in the liver in uncontrolled diabetes is shown in Fig. 46-4. We find it fascinating that both hepatic overproduction of glucose and ketosis result from uncountered activity of glucagon initially acting at strategic sites in the glycogenolytic/glycolytic/gluconeogenic pathways. By controlling substrate flux at critical branch points, all the metabolic abnormalities that characterize the liver in uncontrolled diabetes are activated. Therefore, great interest has been shown in developing drugs to block activation of the glucagon receptor in the treatment of diabetes.98–100
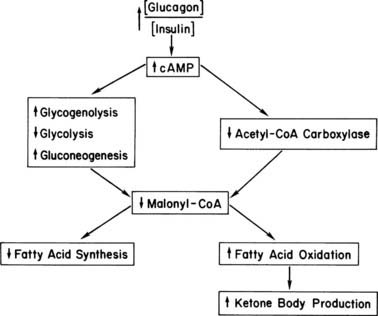
FIGURE 46-4. Hepatic metabolism in uncontrolled diabetes. The increased ratio of glucagon to insulin increases cyclic AMP, thereby initiating a series of enzymic phosphorylations. These reactions convert the liver to an organ of glucose production, with gluconeogenesis predominating after a few hours of poor control. Malonyl CoA levels drop precipitously because of a block in glycolysis, inhibition of acetyl CoA carboxylase, and activation of malonyl CoA decarboxylase (see text). This drop in turn increases fatty acid oxidation/ketogenic capacity and stops long-chain fatty acid synthesis via substrate depletion. Not shown are the increases in long-chain fatty acyl CoA and carnitine that drive the fatty acid oxidative sequence that is poised for action.
There is little doubt that malonyl CoA-mediated control of CPT I is central to the regulation of fatty acid oxidation and ketogenesis in the liver, but another consequence of a rise in the glucagon-to-insulin molar ratio is an increased carnitine content.101 The source of this carnitine has never been identified, but it is attractive to suppose that it moves to the liver from muscle via the plasma. Increased carnitine would favor transesterification of fatty acyl CoAs by mass action once CPT I is activated.
In DKA, impaired glucose disposal contributes significantly to hyperglycemia. In contrast, ketone utilization is not limited until plasma concentrations reach 10 to 12 mM.102
CLINICAL FEATURES
Diabetic ketoacidosis can occur in every form of diabetes, as noted previously, but is most common in type 1 diabetes, especially in younger children with the disease. It is quite remarkable that DKA is frequently the presenting event at time of diagnosis.103–106 In the Search for Diabetes in Youth Study, the prevalence of DKA at diagnosis was 25.5% in the study group as a whole but decreased with age: 37.3% at ages 0 to 4 and 14.7% at ages 15 to 19.103 DKA at the time of diagnosis was 9.7% in young patients thought to have type 2 diabetes. There is evidence that type 1 diabetes is increasing worldwide.104
PRECIPITATING EVENTS
Diabetic ketoacidosis is usually initiated by physical stress of some kind or cessation of insulin.107,108 Often the stress is infection, but the apparent cause may vary from acute alcohol intake to myocardial infarction. A significant number of cases have no recognizable precipitating event; in these patients, psychological stress may be the operative mechanism, especially in young persons who have repeated episodes of ketoacidosis over short intervals.109 Atypical antipsychotic drugs have been found to induce diabetes and DKA.110 Known to be associated are clozapine, olanzapine, quetiapine, and risperidone. Cocaine use by diabetic subjects is a major cause of DKA.111 Other unusual associations are pheochromocytoma,112 menses,113 and interferon.114
SYMPTOMS AND SIGNS
The usual symptoms and signs of ketoacidosis include vomiting, thirst, polyuria, weakness, altered sensorium, and air hunger. Abdominal pain can occur.107 The differential diagnosis of such pain is tricky because pyelonephritis or a surgical disorder, such as acute appendicitis, may precipitate ketoacidosis. On the other hand, severe pain mimicking an acute abdomen may be due to the ketoacidotic state itself, possibly the consequence of hypertriglyceridemia-induced pancreatitis. Unless clear-cut evidence of a specific cause is present, a conservative course should be taken, with treatment of ketoacidosis taking precedence.
All DKA patients are hospitalized. There are no data available for ER deaths. The vital signs on admission vary with the length and severity of the prehospital phase of the illness. Tachycardia is essentially always present.115 The mean blood pressure is normal when large numbers of patients are evaluated, but hypotension was present in 8% of the survivors in one series. In the same series, hypotensive shock was present in 19% of those who died.115 Hypotension obviously is a poor prognostic sign. Kussmaul respiration with respiratory rates averaging 30 per minute is almost always observed, but in severe acidosis, the ventilatory response may fall and paradoxically rise as treatment is initiated and the acidosis is reversed.116,117 The patient’s temperature is often below normal and may be as low as 34°C.118,119 If fever is present, the likelihood of infection is high. The converse is not true; that is, the absence of fever or the presence of hypothermia does not rule out an infectious process. Although the sensorium is usually clouded on arrival at the hospital, one fifth of patients are alert.107 Only about 10% are actually unconscious, despite frequent use of the phrase “diabetic coma” as a synonym for the acidotic state.
The physical findings are not specific. Breath with a fruity odor may suggest acetonemia. Careful search should be made for hidden infections such as a tooth abscess, a furuncle hidden by axillary hair, or a perirectal abscess. Skin turgor is usually poor, and mucous membranes are ordinarily dry. Occasionally, one sees eruptive xanthomas. Lipemia retinalis is not unusual.
LABORATORY ABNORMALITIES
Typical laboratory abnormalities present on admission are shown in Tables 46-1 and 46-2. Hormone values are informative. Glucagon concentrations were elevated sevenfold, with epinephrine, norepinephrine, cortisol, and growth hormone also showing major increases. Epinephrine concentrations were 50-fold higher than normal. As noted earlier, it is probable that the initial change in catabolic hormones is a rise in glucagon followed by an increase in other counterregulatory agents as the stress of ketoacidosis worsens.40,41 The result is a vicious cycle: ketoacidosis → stress hormone release → worsening ketoacidosis → greater stress hormone release. The high concentrations of renin and aldosterone are expected concomitants of volume depletion. Inflammatory cytokines are elevated.120
Table 46-1. Hormone Values in Patients With Diabetic Ketoacidosis
| Hormone | Controls | Patients |
|---|---|---|
| Insulin (µU/mL) | 15 ± 2 | — |
| C peptide (ng/mL) | 2.4 ± 0.07 | — |
| Glucagon (pg/mL) | 99 ± 19 | 741 ± 247 |
| Epinephrine (ng/mL) | 0.05 ± 0.03 | 2.6 ± 1.3 |
| Norepinephrine (ng/mL) | 0.2 ± 0.08 | 3.8 ± 1.1 |
| Cortisol (µg/dL) | 10.5 ± 2 | 50.4 ± 4.9 |
| Growth hormone (ng/mL) | 0.7 ± 0.1 | 4.6 ± 1.6 |
| Renin (GU × 104/mL) | 0.3 ± 0.1 | 13.2 ± 4.6 |
| Aldosterone (ng/dL) | 7.8 ± 2.3 | 83 ± 25 |
| Pancreatic polypeptide (pg/mL) | 93 ± 11 | 691 ± 200 |
GU, Goldblatt Unit.
Control values were obtained in the basal state after an overnight fast. Plasma renin concentration and aldosterone were measured in subjects consuming 120 mmol Na+ per day. Data are means ± SEM.
Data from Waldhäusl W, Kleinberger G, Korn A et al: Severe hyperglycemia: effects of rehydration on endocrine derangements and blood glucose concentration. Diabetes 28:577–584, 1979.
Table 46-2. Laboratory Values in Patients With Diabetic Ketoacidosis
| Test | Series 1 (n = 123) | Series 2 (n = 88) |
|---|---|---|
| Glucose (mg/dL) | 606 | 476 |
| Sodium (mM) | 135 | 132 |
| Potassium (mM) | 5.7 | 4.8 |
| Bicarbonate (mM) | 6.3 | <10 |
| BUN (mg/dL) | 29 | 25 |
| Acetoacetate (mM) | 3.1 | 4.8 |
| β-Hydroxybutyrate (mM) | 9.8 | 13.7 |
| Free fatty acids (mM) | — | 2.1 |
| Lactate (mM) | 2.5 | 4.6 |
| Osmolality (mOsm) | 316 | 310 |
| pH | 7.11 | — |
Series 1 is adapted from Kitabchi AE, Young R, Sacks H, Morris L: Diabetic ketoacidosis: reappraisal of therapeutic approach. Annu Rev Med 30:339–357, 1979. Series 2 is adapted from Foster DW: Diabetes mellitus. In Petersdorf RG, Adams RD, Braunwald E et al (eds): Harrison’s Principles of Internal Medicine, ed 10. New York: McGraw-Hill, 1983, pp 661–679. For simplicity, only mean values are listed.
BUN, Blood urea nitrogen.
Plasma analysis reflects the hormonal changes. Glucose is increased into the 28- to 33-mM (500 to 600 mg/dL) range on average but can be lower or much higher. Very high concentrations, similar to those seen in hyperosmolar coma, probably occur only in subjects who have marked volume depletion and dehydration, the mechanism being diminished urine output as previously discussed.55,121 Extracellular fluid volume deficits account for the modest elevation in blood urea nitrogen and creatinine, whereas plasma osmolalities of 310 to 316 mOsm/L reflect deficits of free water. Although insensible losses of water are increased, especially if Kussmaul respiration is marked, the bulk of water deficit is consequent to the glucose-mediated osmotic diuresis, which causes loss of water in excess of electrolytes.55,121,122 Despite dehydration, the plasma sodium level tends to be on the low side, because glucose in the absence of insulin becomes osmotically effective in the extracellular fluid because it cannot penetrate the cell. It osmotically pulls intracellular water to the extracellular compartment and thereby dilutes the sodium concentration. The degree of apparent hyponatremia increases with worsening hyperglycemia. An approximation of the true sodium concentration (millimolar) can be obtained by multiplying excess glucose in 100 mg/dL units by 1.6.123 Thus, for a plasma glucose concentration of 500 mg/dL (assumed normal 100 mg), the calculation would be:
The measured sodium plus 6.4 would approximate the true sodium concentration.
If the plasma sodium level is extremely low, hypertriglyceridemia (secondary to uncontrolled diabetes) should be suspected; the fat, displacing plasma water, causes an artifactually low reading for the sodium concentration. Recognition is not usually a problem, because the plasma will be milky, and lipemia retinalis will be visible on the ophthalmoscopic examination.122 Potassium concentrations tend to be high on arrival despite large total body deficits of the cation,9 primarily because of a shift of potassium from intracellular to extracellular compartments in response to acidosis. Falling urine output will increase the tendency to hyperkalemia. On occasion, the initial potassium level is normal or low, a true danger signal because initiation of insulin therapy, which results in retransfer of potassium into cells, may cause fatal hypokalemia if potassium is not replaced early.
By definition, the acidosis in uncontrolled insulin-dependent diabetes is caused by the overproduction of a acetoacetic and β-hydroxybutyric acids in the liver, with their accumulation in plasma.9,41 Contributing to the fall in pH are elevated levels of lactate, free fatty acids, and other organic acids that are normally excreted by the kidneys. Conventionally, the diagnosis of “ketoacidosis” requires a bicarbonate concentration under 10 mM and a pH under 7.3.9,124 The term ketosis should be used if deteriorating diabetic control has resulted in hyperglycemia/ketosis but not full-blown acidosis. Most hospital laboratories do not routinely measure acetoacetate, but β-hydroxybutyrate levels are often available. β-Hydroxybutyrate levels do not, however, appear helpful in management. The concentration of acetoacetate plus β-hydroxybutyrate rarely rises above 6 mM in fasting individuals,125,126 although a prolonged fast in nonobese persons may induce higher levels. Exceptions to the general rule that fasting ketosis gives total ketone levels of 6 mM or less are seen in late pregnancy,127 some lactating women,128 and a subset of alcoholic patients.129,130 These patients may exhibit true ketoacidosis with a short-term fast.
The ratio of β-hydroxybutyrate to acetoacetate is dependent on the redox state of the hepatocyte. β-Hydroxybutyrate is usually three times higher than acetoacetic acid. With high rates of fatty acid oxidation, ethanol ingestion, or hypoxia, ratios higher than the normal three may be seen, which diminishes the amount of acetone/acetoacetate detected by a reagent. The authors wish to emphasize that ketoacidosis cannot be diagnosed on the basis of a “large” value for ketones in urine, because ordinary fasting can produce such a reading. Patients with lactic acidosis and nonketotic, hyperosmolar coma often have “large” values in urine because of fasting induced by the precipitating illness, but they do not have ketoacidosis as defined earlier.
BUN and creatinine levels are usually modestly elevated on admission and revert to normal as soon as fluids are provided. Creatinine clearance is ordinarily only slightly depressed, in one series averaging 82 mL/min.131 Higher levels of azotemia are a poor prognostic sign in that they indicate a hemodynamically unstable patient vulnerable to vascular collapse or significant underlying renal disease.
Phosphate depletion is universal in DKA, but the initial plasma concentration, like that of potassium, may be low, normal, or high.132 As a result, marked deficiency of erythrocyte 2,3-diphosphoglycerate is present.133 Leukocytosis—at times a true leukemoid reaction—is commonly present and does not indicate infection.107 Amylase may be high but cannot be assumed to represent pancreatitis, because it may be of salivary gland origin in some patients.134 If lipase levels are very high, pancreatitis is more likely. Amylase and lipase are particularly elevated in DKA associated with fulminant type 1 diabetes.135 Triglycerides are almost always elevated and can reach very high levels (e.g., 10,000 mg/dL). If the patient has eaten within a few hours of onset, a significant fraction of the triglyceride may be in chylomicrons. Cholesterol concentrations will also be increased when triglyceride levels are very high, because cholesterol is contained in both chylomicrons (triglyceride-to-cholesterol ratio of more than 10 : 1) and very-low-density lipoprotein particles (triglyceride-to-cholesterol ratio of approximately 5:1).
Stay updated, free articles. Join our Telegram channel

Full access? Get Clinical Tree


