Examination of the Blood and Bone Marrow


Examination of the Blood and Bone Marrow


Kristi J. Smock

Sherrie L. Perkins


Careful assessment of the blood is often the first step in assessment of hematologic function and diagnosis of related diseases, and many hematologic disorders are defined by specific blood tests. Examination of blood smears and hematologic parameters yields important diagnostic information about cellular morphology, quantification of the blood cellular components, and evaluation of cellular size and shape that allows formation of broad differential diagnostic impressions, directing additional testing. This chapter introduces the fundamental concepts and limitations that underlie laboratory evaluation of the blood and outlines additional testing that may aid in evaluating a hematologic disorder, including special stains and bone marrow examination.

Blood elements include erythrocytes or red cells, leukocytes or white cells, and platelets. Red blood cells (RBCs) are the most numerous blood cells in the blood and are required for tissue respiration. RBCs lack nuclei and contain hemoglobin, an iron-containing protein that acts in the transport of oxygen and carbon dioxide. White blood cells (WBCs) serve an immune function and include a variety of cell types that have specific functions and characteristic morphologic appearances. In contrast to mature red cells, WBCs are nucleated and include neutrophils, lymphocytes, monocytes, eosinophils, and basophils. Platelets are cytoplasmic fragments derived from marrow megakaryocytes that function in coagulation and hemostasis.

Blood evaluation requires quantification of each of the cellular elements by either manual or automated methods. Automated methods, using properly calibrated equipment,1,2 are more precise than manual procedures. In addition, automated methods may provide additional data describing cellular characteristics such as cell volume. However, the automated measurements describe average cellular characteristics but do not adequately describe the scatter of individual values around the average. Hence, a bimodal population of small (microcytic) and large (macrocytic) RBCs might be reported as normal cell size. Therefore, a thorough blood examination also requires microscopic evaluation of a stained blood film to complement hematology analyzer data, especially when new findings are identified.3,4 and 5


SPECIMEN COLLECTION

Proper specimen collection is required for acquisition of reliable and accurate laboratory data for any hematologic specimen. Before a specimen is obtained, careful thought as to what studies are needed will aid in optimal collection of samples. Communication with laboratory personnel analyzing the specimen is often helpful in ensuring proper handling and test performance.

A number of factors may affect hematologic measurements, and specimens should be collected in a standardized manner to reduce data variability. Factor example, patient activity, level of hydration, medications, sex, age, race, smoking, and anxiety may significantly affect hematologic parameters.6,7,8 Similarly, the age of the specimen may affect the quality of the data collected.9,10 Thus, data such as patient age, sex, and time of specimen collection should be noted, as well as pertinent correlative clinical information.

Most often, blood is collected by venipuncture into collection tubes containing anticoagulant.11 The three most commonly used anticoagulants are tripotassium or trisodium salts of ethylenediaminetetraacetic acid (EDTA), trisodium citrate, and heparin. EDTA and disodium citrate act to remove calcium, which is essential for the initiation of coagulation, from the blood.11 Heparin acts by forming a complex with antithrombin in the plasma to prevent thrombin formation. EDTA is the preferred anticoagulant for blood counts because it produces complete anticoagulation with minimal morphologic and physical effects on cells. Heparin causes a bluish coloration of the background when a blood smear is stained with Wright-Giemsa stains, but does not affect cell size or shape. Heparin is often used for red cell testing, osmotic fragility testing, and functional or immunologic analysis of leukocytes. Heparin does not completely inhibit white blood cell or platelet clumping. Trisodium citrate is the preferred anticoagulant for platelet and coagulation studies.

The concentration of the anticoagulant used may affect cell concentration measures if it is inappropriate for the volume of blood collected and may also distort cellular morphology. Most often, blood is collected directly into commercially prepared negative-pressure vacuum tubes (Vacutainer tubes; Becton Dickinson, Franklin Lakes, NJ), which contain the correct concentration of anticoagulant when filled appropriately, thereby minimizing error.11 Anticoagulated blood may be stored at 4°C for a 24-hour period without significantly altering cell counts or cellular morphology.9 However, it is preferable to perform hematologic analysis as soon as possible after the blood is obtained.


RELIABILITY OF TESTS

In addition to proper acquisition of specimens, data reliability requires precise and reproducible testing methods. Both manual and automated testing of hematologic specimens must be interpreted in light of expected test precision, particularly when evaluating the significance of small changes. All laboratory tests
are evaluated with respect to both accuracy and reproducibility. Accuracy is the difference between the measured value and the true value, which implies that a true value is known. Clearly, this may present difficulties when dealing with biologic specimens. The National Committee for Clinical Laboratory Standards (NCCLS) and the Clinical and Laboratory Standards Institute (CLSI) have attempted to develop standards to assess the accuracy of blood smear examination11 and automated blood cell analyzers.2 Automated instrumentation requires regular quality assurance evaluations and careful calibration to reach expected performance goals and the ability to collect accurate and reproducible data.2,12,13 In addition, the International Consensus Group for Hematology Review has suggested criteria that should lead to manual review of a specimen after automated analysis and differential counting.3


CELL COUNTS

Cell counts are important parameters in evaluating the blood. Cell counts may be determined either manually or by automated hematology analyzers. Whether performed by manual or automated methodologies, the accuracy and precision of the counts depend on proper dilution of the blood sample, even distribution of cells, and precise sample measurement. As blood contains large numbers of cells, sample dilution is usually required for accurate analysis. The type of diluent is dependent on the cell type to be enumerated. Thus, red cell counts require dilution with an isotonic medium, whereas in white cell or platelet counts, a diluent that lyses the more numerous red cells is often used to simplify counting. The extent of dilution also depends on the cell type. In general, red cell counts need more dilution than is required for the less abundant WBCs. Errors in cell counts are caused primarily by errors in sample measurement, dilution, or enumeration of cells. The highest degree of precision occurs when a large number of cells can be evaluated. Clearly, automated methods are superior to manual methods for counting large numbers of cells and minimizing statistical error. Table 1.1 lists the comparable values of reproducibility for automated and manual (hemocytometer) counting methods.

Manual counts are done using a microscope after appropriate dilution of the sample in a hemocytometer, a specially constructed counting chamber that contains a specific volume. Red cells, leukocytes, and platelets may be counted. Due to the inherent imprecision of manual counting and the amount of technical time required, most cell counting is now performed by automated instruments that increase the accuracy and speed of analysis by the clinical laboratory, thereby minimizing levels of human manipulation for test entry, sampling, sample dilution, and analysis.16 With increasing automation, some hematology analyzers can be coupled with instruments performing other laboratory tests using the same tube of blood.17 There is a variety of different automated hematology analyzers available, dependent on the volume of samples to be tested and the specific needs of the physician ordering testing. The analyzers range in price and workload capacity from those that would be appropriate for an individual physician’s office or point-of-care facility to those needed in a busy reference laboratory with capacity for over 100 samples to be analyzed per hour.16


TABLE 1.1 REPRODUCIBILITY OF BLOOD COUNTING PROCEDURES


Two Coefficients of Variation


Cell Type Counted


Hemocytometera (%)


Automated Hematology Analyzer (%)


Red cells


±11.0


±1.0


White cells


±16.0


±1.5


Plateletsb


±22.0


±2.0


Reticulocytes


±33.9


±5.0


a Minimum error. Usual error.

b Error may be greater with low (<35 × 109/L) or very high (>450 × 109/L) platelet counts. Data derived from Bentley S, Johnson A, Bishop C. A parallel evaluation of four automated hematology analyzers. Am J Clin Pathol 1993;100:626-63214 and Wintrobe M. A simple and accurate hematocrit. J Lab Clin Med 1929;15:287-28915.


Most automated hematology analyzers perform a variety of hematologic measurements, in addition to cell counting, such as hemoglobin concentration (Hb), red cell size, and leukocyte differentials. Many instruments also perform more specialized testing, such as reticulocyte counts.18 The ability of analyzers to perform accurate WBC differential counts, particularly those that can perform a five-part differential (enumerating neutrophils, lymphocytes, monocytes, eosinophils, and basophils), has been a significant technologic advance over the past 15 years. Automated methods for white cell counts and differentials use several distinct technical approaches, including measurement of electrical impedance, differential light scatter, optical properties, or surface antigen/cytochemical staining either alone or in combination.19,20

Most of the newer-generation hematology analyzers utilize optical flow cytometric technologies with or without additional cytochemical staining to detect specific cell types such as red cells, white cells, and platelets (Fig. 1.1).19,21,22 The newer analyzers have the additional ability to detect reticulocytes as part of the normal complete blood count (CBC) differential using a fluorescent RNA dye and many will also enumerate nucleated red blood cell numbers based on their optical properties.23 In addition, many of the current analyzers do auto sampling directly from tubes
and use a very small sample ranging from 35 to 150 µl for a full CBC analysis. Using flow cytometric technologies, some analyzers also have the ability to detect specific blood cell populations by specific antigen expression, such as detection of CD34 peripheral blood stem cells or leukemic blasts.24,25 and 26 Integration of data from cytochemical or antigenic staining and light scatter properties has improved the accuracy of the five-part differential and decreased the numbers of unidentifiable cells requiring technician review for identification.


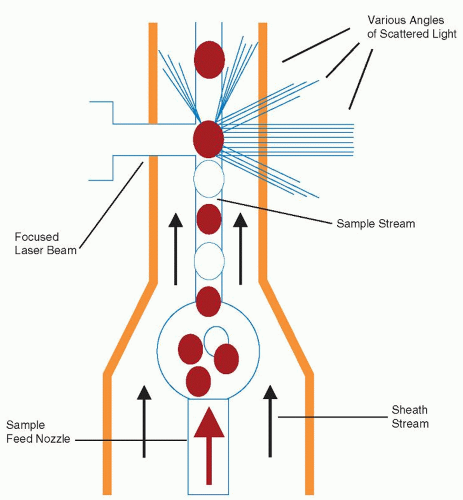
FIGURE 1.1. Optical flow cytometric type of automated hematology analyzer. A suspension of cells is passed through a flow chamber and focused into a single cell sample stream. The cells pass through a chamber and interact with a laser light beam. The scatter of the laser light beam at different angles is recorded, generating signals that are converted to electronic signals giving information about cell size, structure, internal structure, and granularity. (Adapted and redrawn from Cell-Dyn 3500 Operator’s Manual. Santa Clara, CA: Abbott Diagnostics, 1993.)

Instruments from Abbott Laboratories (CELL-DYN),16,27 Horiba Medical (ABX Pentra series), and Sysmex (XE series, XT series, and XS series)16,28,29 primarily utilize fluorescent-based flow cytometry as the modality for analysis. Each system has slightly different fluorochrome staining combinations that aid in the identification of white cells, red cells, and platelets in combination with light scatter characteristics. All provide integrated reticulocyte counts and five-part differentials. Workload capacities range from 70 to 106 samples analyzed per hour. When reticulocytes are ordered as a part of the differential, the capacity falls to between 40 and 60 samples per hour (allowing for the staining and detection of the RNA dye fluorescence). Instruments by Siemens (Advia 120 and 2120 series) use a combination of flow cytometric techniques and a cytochemical peroxidase stain for the five-part differential. This instrument integrates electrical impedance data, flow cytometric light scatter, characteristic fluorescent staining, and cytochemical staining to generate an accurate white blood cell differential. Siemens technology also calculates hemoglobin levels, claiming that this causes less interference by high white blood cell counts or lipemia in the specimen.16,30,31 Instruments from Beckman/Coulter (Coulter DxH series, LH 500 series, LH 750 series, LH 780 series) also utilize electrical impedance or conductivity in combination with light scatter approaches, integrating these technologies to provide full analysis and five-part differentials (Fig. 1.2). The Beckman/Coulter series includes nucleated RBCs and reticulocyte counts in every differential. Its capacity is 45 samples per hour when reticulocytes are included and 100 samples per hour for a CBC without reticulocyte counts.16


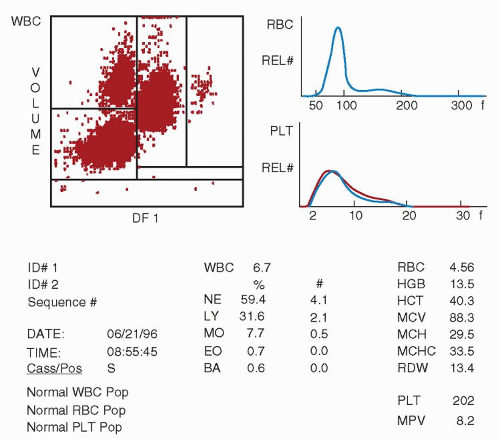
FIGURE 1.2. Histograms and printout generated by the Coulter automated hematology analyzer utilizing light scatter and electrical impedance. BA, basophil; EO, eosinophil; HCT, hematocrit; HGB, hemoglobin; LY, lymphocyte; MCH, mean corpuscular hemoglobin; MCHC, mean corpuscular hemoglobin concentration; MCV, mean corpuscular volume; MO, monocyte; MPV, mean platelet volume; NE, neutrophil; PLT, platelet; RBC, red blood cell; RDW, red cell distribution width; WBC, white blood cell.


RED BLOOD CELL ANALYTIC PARAMETERS

RBCs are defined by three quantitative values: the volume of packed red cells or hematocrit (Hct), the amount of hemoglobin (Hb), and the red cell concentration per unit volume. Three additional indices describing average qualitative characteristics of the red cell population are also collected. These are mean corpuscular volume (MCV), mean corpuscular hemoglobin (MCH), and mean corpuscular hemoglobin concentration (MCHC). All of these values are routinely collected and calculated by automated hematology analyzers, largely replacing many of the previously used manual or semi-automated methods of RBC characterization, with certain exceptions as noted below. The use of hematology analyzers imparts a high degree of precision compared to manual measurements and calculations (Tables 1.1 and 1.2).


Volume of Packed Red Cells (Hematocrit)

The hematocrit is the proportion of the volume of a blood sample that is occupied by red cells. Hct may be determined manually by centrifugation of blood at a given speed and time in a standardized glass tube with a uniform bore, as was originally described by Wintrobe.15 The height of the column of red cells after centrifugation compared with total blood sample volume yields the Hct. Macromethods (using 3-mm test tubes) with low-speed centrifugation or micromethods using capillary tubes and high-speed centrifugation may also be used.

Manual methods of measuring Hct are simple and accurate means of assessing red cell status. They are easily performed with little specialized equipment, allowing adaptation for situations in which automated cell analysis is not readily available or for office use. However, several sources of error are inherent in the technique. The spun Hct measures the red cell concentration, not red cell mass. Therefore, patients in shock or with volume depletion may have normal or high Hct measurements due to hemoconcentration despite a decreased red cell mass. Technical sources of error in manual Hct determinations usually arise from inappropriate concentrations of anticoagulants,32 poor mixing of samples, or insufficient centrifugation.15 Another inherent error
in manual Hct determinations arises from trapping of plasma in the red cell column. This may account for 1% to 3% of the volume in microcapillary tube methods, with macrotube methods trapping relatively more plasma.33,34 It should be noted that abnormal red cells (e.g., sickle cells, microcytic cells, macrocytic cells, or spherocytes) often trap higher volumes of plasma due to increased cellular rigidity, possibly accounting for up to 6% of the red cell volume.34 Very high Hcts, as in polycythemia, may also have excess plasma trapping. Manual Hct methods typically have a precision coefficient of variation (CV) of approximately 2%.33


TABLE 1.2 REPRODUCIBILITY OF RED CELL INDICES


Index


Method Used


% Error (±2 Coefficients of Variation)


Hemoglobin concentration


Spectrophotometric Automated


1.0-2.0 <1.0


Mean corpuscular volume


Hemocytometer Automated


9.5 <1.0


Mean corpuscular hemoglobin


Hemocytometer Automated


10.0 0.6-1.2


Mean corpuscular hemoglobin concentration


Automated


1.0-1.5


Data derived from Bentley S, Johnson A, Bishop C. A parallel evaluation of four automated hematology analyzers. Am J Clin Pathol 1993;100:626-632; NCCLS. Reference and standard procedure for quantitative determination of haemoglobin in blood, 2nd ed. Document H15-A2. Villanova, PA: NCCLS, 1994 and International Committee for Standardization in Haematology. Recommendations for reference method for haemoglobinometry in human blood (ICSH Standard 1986) and specifications for international haemoglobincyanide reference preparation, 3rd ed. Clin Lab Haematol 1987;9:73-79.


Automated analyzers do not depend on centrifugation techniques to determine Hct, but instead calculate Hct by direct measurements of red cell number and red cell volume (Hct = red cell number × mean red cell volume). Automated Hct values closely parallel manually obtained measurements, and the manual Hct is used as the reference method for hematology analyzers (with correction for the error induced by plasma trapping). Errors of automated Hct calculation are more common in patients with polycythemia35 or abnormal plasma osmotic pressures.36 Manual methods of Hct determination may be preferable in these cases. The precision of most automated Hcts is <1% (CV).16


Hemoglobin Concentration

Hemoglobin (Hb) is an intensely colored protein, allowing its measurement by spectrophotometric techniques. Hemoglobin is found in the blood in a variety of forms, including oxyhemoglobin, carboxyhemoglobin, methemoglobin, and other minor components. These may be converted to a single stable compound, cyanmethemoglobin, by mixing blood with Drabkin solution (containing potassium ferricyanide and potassium cyanide).37,38 Sulfhemoglobin is not converted but is rarely present in significant amounts. The absorbance of the cyanhemoglobin is measured in a spectrophotometer at 540 nm to determine Hb. This technique is used both in manual determinations and automated hematology analyzers. Hb is expressed in grams per deciliter (g/dl) of whole blood. The main errors in measurement arise from dilution errors or increased sample turbidity due to improperly lysed red cells, leukocytosis, or increased levels of lipid or protein in the plasma.39,40 and 41 With automated methods the precision for hemoglobin determinations is <1% (CV).16


Red Cell Count

Manual methods for counting red cells have proven to be very inaccurate, and automated counters provide a much more accurate reflection of red cell numbers.42 Both erythrocytes and leukocytes are counted after whole blood dilution in an isotonic solution. As the number of red cells greatly exceeds the number of white cells (by a factor of 500 or more), the error introduced by counting both cell types is negligible. However, when marked leukocytosis is present, red cell counts and volume determinations may be erroneous unless corrected for white cells. The observed precision for RBC counts using automated hematology analyzers is <1% (CV)16 compared with a minimum estimated value of 11% with manual methods.42


Mean Corpuscular Volume

The average volume of the red blood cell is a useful parameter that is used in classification of anemias and may provide insights into pathophysiology of red cell disorders.43,44 and 45 The MCV is usually measured directly with automated instruments but may also be calculated from the erythrocyte count and the Hct by means of the following formula15:

MCV = Hct (L/L) × 1,000/red cell count (1012/L)

The MCV is measured in femtoliters (fl, or 10-15 L). Using automated methods, this value is derived by dividing the summation of the red cell volumes by the erythrocyte count. The CV in most automated systems is approximately 1%,16 compared to ˜10% for manual methods.33

Agglutination of cells, as in cold agglutinin disease or paraproteinemia, may result in a falsely elevated MCV.46 Most automated analyzers gate out MCV values above 360 fl, thereby excluding most red cell clumps, although this may falsely lower Hct determinations. In addition, severe hyperglycemia (glucose >600 mg/dl) may cause osmotic swelling of the red cells, leading to a falsely elevated MCV.36,47


Mean Corpuscular Hemoglobin

MCH is a measure of the average hemoglobin content per red cell. It may be calculated manually or by automated methods using the following formula15:

MCH = hemoglobin (g/L)/red cell count (1012/L)

MCH is expressed in picograms (pg, or 10-12 g). Thus, the MCH is a reflection of hemoglobin mass. In anemias secondary to impaired hemoglobin synthesis, such as iron deficiency anemia, hemoglobin mass per red cell decreases, resulting in a lower MCH value. MCH measurements may be falsely elevated by hyperlipidemia,41 as increased plasma turbidity will erroneously elevate hemoglobin measurement. Centrifugation of the blood sample to eliminate the turbidity followed by manual hemoglobin determination allows correction of the MCH value. Leukocytosis may also spuriously elevate MCV values.39 The CV for automated analysis of MCH is <1% in most modern analyzers, compared with approximately 10% for manual methods.33


Mean Corpuscular Hemoglobin Concentration

The average concentration of hemoglobin in a given red cell volume or MCHC may be calculated by the following formula15:

MCHC = hemoglobin (g/dl)/Hct (L/L)

The MCHC is expressed in grams of hemoglobin per deciliter of packed RBCs, representing the ratio of hemoglobin mass to the volume of red cells. With the exception of hereditary spherocytosis and some cases of homozygous sickle cell or hemoglobin C disease, MCHC values will not exceed 37 g/dl. This level is close to the solubility value for hemoglobin, and further increases in Hb may lead to crystallization. The accuracy of the MCHC determination is affected by factors that have an impact on measurement of either Hct (plasma trapping or presence of abnormal red cells) or hemoglobin (hyperlipidemia, leukocytosis).39 The CV for MCHC for automated methods ranges between 1.0% and 1.5%.16

As noted above, the MCV, MCH, and MCHC reflect average values and may not adequately describe blood samples when mixed populations of red cells are present. For example, in sideroblastic anemias, a dimorphic red cell population of both hypochromic and normochromic cells may be present, yet the indices may be normochromic and normocytic. It is important to examine the blood smear as well as red cell histograms to detect such dimorphic populations.3 The MCV is an extremely useful value in classification of anemias,16,45,48 but the MCH and MCHC often do not add significant, clinically relevant information. However, the MCH and MCHC play an important role in laboratory quality control because these values will remain stable for a given specimen over time.49


Red Cell Distribution Width

The red cell distribution width (RDW) is a red cell measurement that quantitates cellular volume heterogeneity reflecting the range of red cell sizes within a sample.43,50,51,52 RDW has been proposed to be useful in early classification of anemia as it becomes
abnormal earlier in nutritional deficiency anemias than other red cell parameters, especially in cases of iron deficiency anemia.43,53 RDW is particularly useful in characterizing microcytic anemia, allowing discrimination between uncomplicated iron deficiency anemia (high RDW, normal to low MCV) and uncomplicated heterozygous thalassemia (normal RDW, low MCV),43,53,54 and 55 although other tests are usually required to confirm the diagnosis.56 RDW is also useful in identifying red cell fragmentation, agglutination, or dimorphic cell populations (including patients who have had transfusions, have sideroblastic anemias, or have been recently treated for a nutritional deficiency).53,57


Reticulocyte Counts

Determination of the numbers of reticulocytes or immature, nonnucleated RBCs that still retain RNA provides useful information about the bone marrow’s capacity to synthesize and release red cells in response to a physiologic challenge, such as anemia. In the past, reticulocyte counts were performed manually using supravital staining with methylene blue that will stain precipitated RNA as a dark blue meshwork or granules (at least two per cell), allowing reticulocytes to be identified and enumerated manually.58 Normal values for reticulocytes in adults are 0.5% to 1.5%, although they may be 2.5% to 6.5% in newborns (falling to adult levels by the second week of life). Because there are relatively low numbers of reticulocytes, the CV for reticulocyte counting is relatively large (10% to 20%).59

To increase accuracy of reticulocyte counting, automated detection methods to detect staining allow for many more cells to be analyzed, thereby increasing accuracy and precision of counts.18,60,61 Most of the newest automated hematology analyzers have automated reticulocyte counting as part of the testing capabilities and allow reticulocyte counts to be included with routine complete blood count parameters. Reticulocytes are detected by a fluorescent dye that binds to RNA. Comparisons of stand-alone instruments and integrated hematology analyzers demonstrate superior accuracy when compared to manual counting methods, with CVs of 5% to 8%.16,62


LEUKOCYTE ANALYSIS


White Blood Cell Counts

Leukocytes may be enumerated by either manual methods or automated hematology analyzers. Leukocytes are counted after dilution of blood in a diluent that lyses the RBCs (usually acid or detergent). The much lower numbers of leukocytes present require less dilution of the blood than is needed for red blood cell counts (usually a 1:20 dilution, although it may be less in cases of leukocytopenia or more with leukocytosis). Manual counts are done using a hemocytometer or counting chamber. As with red cell counts, manual leukocyte counts have more inherent error, with CVs ranging from 6.5% in cases with normal or increased white cell counts to 15% in cases with decreased white cell counts. Automated methods characteristically yield CVs in the 1% to 3% range.16 Automated leukocyte counts may be falsely elevated in the presence of cryoglobulins or cryofibrinogen,63 aggregated platelets,64 and nucleated RBCs, or when there is incomplete lysis of red cells, requiring manual counting. Falsely low neutrophil counts have also been reported due to granulocyte agglutination secondary to surface immunoglobulin interactions.65,66


Leukocyte Differentials

White cells are analyzed to find the relative percentage of each cell type by a differential leukocyte count. Uniform standards for performing manual differential leukocyte counts on blood smears have been proposed by the CLSI67 to ensure reproducibility of results between laboratories. It is important to scan the entire blood smear at low power to ensure that all atypical cells and cellular distribution patterns are recognized. In wedge-pushed smears, leukocytes tend to aggregate in the feathered edge and side of the blood smear rather than in the center of the slide. Larger cells (blasts, monocytes) also tend to aggregate at the edges of the blood smear.68 Use of coverslip preparations and spinner systems tends to minimize this artifact of cell distribution. For wedge-pushed smears, it is recommended that a battlement pattern of smear scanning be used in which one counts fields in one direction, then changes direction and counts an equal number of fields before changing direction again to minimize distributional errors.67

In manual leukocyte counts, three main sources of error are found: distribution of cells on the slide, cell recognition errors, and statistical sampling errors. Poor blood smear preparation and staining are major contributors to cell recognition and cell distribution errors.69 Statistical errors are the main source of error inherent in manual counts, due to the small sample size in counts of 100 or 200 cells. The CV in manual counts is between 5% and 10% and is also highly dependent on the skill of the technician performing the differential. Accuracy may be improved by increasing the numbers of cells counted, but for practical purposes, most laboratories will do a differential on 100 white cells.70,71

Automated leukocyte differentials markedly decrease the time and cost of performing routine examinations as well as increasing accuracy to a CV of 3% to 5%.70,71,72 However, automated analysis is incapable of accurately identifying and classifying all types of cells and is particularly insensitive to abnormal or immature cells. Therefore, most analyzers will flag possible abnormal white cell populations, indicating the need for examination by a skilled morphologist for identification.72 The capacity for performing automated leukocyte differentials is incorporated into hematology analyzers, which identify cells on the basis of cellular size, cell complexity, or staining characteristics as part of the complete blood count, allowing for generation of a five-part differential count that enumerates neutrophils, monocytes, lymphocytes, eosinophils, and basophils.16

Most systems perform cell counts on specimens via continuousflow cytometric analysis of blood samples in which the red cells have been lysed and white cells fixed. The cells are suspended in diluent and passed through an optical flow cell in a continuous stream so that single cells are analyzed for cell size (forward scatter) and complexity (dark-field light scatter) (Fig. 1.1) or cytochemical characteristics of myeloperoxidase staining (bright-field detector). The data are plotted as a scattergram (Fig. 1.2), which allows white cells to be divided into a five-part differential (neutrophils, lymphocytes, monocytes, eosinophils, and basophils) and also indicates large unstained or unclassified cells. Lymphocytes are characterized as small (low-scatter) unstained cells. Larger atypical lymphocytes, blasts, or circulating plasma cells fall into the larger cell with a low-complexity channel. Neutrophils have higher complexity and appear as larger cells. Eosinophils appear smaller than neutrophils because they tend to absorb some of their own light scatter. Monocytes have lower levels of complexity and are usually found between neutrophils and lymphocytes. To enumerate basophils, which lack specific staining characteristics and are difficult to enumerate with automated flow-through techniques, a basophil-nuclear lobularity channel may be utilized. For this determination, RBCs and WBCs are differentially lysed, leaving bare leukocyte nuclei, with the exception of basophils, which are resistant to lysis and can then be counted based on relatively large cell size due to the retained cytoplasm. Light scatter data obtained from the leukocyte nuclei may also help identify blasts, which have a lower light scatter than do mature
lymphocyte nuclei. Abnormal cell populations will generate a flag, indicating a need for morphologic review of the peripheral smear.3 Analysis using this technique examines thousands of cells per sample, increasing statistical accuracy.16

Most of the current hematology analyzers have settings that will allow for evaluation of very hypocellular specimens, such as body fluids. They may be used for analysis of these fluids for enumeration of red cells and white cells, as well as providing a five-part differential count of the white cells. Because of the sampling of higher numbers of cells in these relatively hypocellular specimens, accuracy of cell counts and differential counting is improved.30,31,73,74 and 75

A few instruments, such as the Advia 2120 and the Coulter LH755, also have integrated automated blood smear preparation technology allowing smear preparation directly from the tube upon which the CBC analysis is performed. Thus, the tube is loaded once into a single machine to allow for CBC analysis as well as peripheral blood smear preparation.16 Many manufacturers also have automated slide makers and stainers, which provide wedge smears from up to 80 slides per hour directly from CBC tubes; however, these are generally free-standing instruments separated from the hematology analyzer. The automated push smear technology helps to provide technical uniformity in blood smear preparation as well as staining. However, there is less flexibility in adjusting stain characteristics. These instruments sample directly from the tube, also minimizing handling of samples by technical staff.

In addition to technology that has the ability to make and stain slides, some automated differential technology via imaging is now available. For instance, Sysmex (CellaVision) has an automated image analyzer that by pattern recognition will capture digital images of 100 to 500 cells in a smear and classify them into morphologic categories to provide a five-part differential. Depending on the model utilized, these technologies have the abilities to perform between 20 and 60 automated digital differentials per hour. The systems have the capacity to store images and are useful in training technologists in the recognition of the specific cell types as well as providing an easily accessible means whereby smears obtained at different times from a single patient may be compared morphologically.76 These systems have limitations in ability to identify morphologically abnormal cells, so specimens with dysplastic changes, unusual morphologic variants, or significant artifacts may not be evaluable or may provide false data.77,78,79 Often these systems will place a certain percentage of cells in an unclassifiable area, requiring review by a technologist for definitive identification of the cell type and completion of the differential. As microscopy is automated, there is a uniform scanning of each slide and images are presented on a computer screen, decreasing technician microscope time and scanning pattern variability, and also allowing for the ability to greatly enlarge digitally captured images.78,80


PLATELET ANALYSIS

Platelets are anucleate cytoplasmic fragments that are 2 to 4 µm in diameter. As with the other blood components, they may be counted by either manual or automated methods. Manual methods involve dilution of blood samples and enumeration in a counting chamber or hemocytometer using phase contrast microscopy. Sources of error are similar to other manual counting techniques and include dilution errors and low numbers of events counted. The CV, especially in patients with thrombocytopenia, may be >15%.81,82 Platelets are counted in automated hematology analyzers after removal of red cells by sedimentation or centrifugation, or using whole blood. Platelets are identified by light scatter, impedance characteristics, or platelet antigen staining.16,83 These give highly reliable platelet counts with a CV of <2%. Falsely low platelet counts may be caused by the presence of platelet clumps or platelet agglutinins64 or adsorption of platelets to leukocytes.84,85 Fragments of red or WBCs may falsely elevate the automated platelet count, but this usually gives rise to an abnormal histogram that identifies the spurious result.86,87

Automated hematology analyzers also determine mean platelet volume (MPV), which has been correlated with several disease states.88,89,90 In general, MPV has an inverse relationship with platelet number, with larger platelet volumes (secondary to new platelet production) seen in thrombocytopenic patients in whom platelets are decreased due to peripheral destruction (as in idiopathic thrombocytopenic purpura).90,91,92 MPV is also increased in myeloproliferative disorders.93 However, it should be noted that platelets tend to swell during the first 2 hours in EDTA anticoagulant, shrinking again with longer storage.94,95 Decreased MPV has been associated with megakaryocytic hypoplasia and cytotoxic drug therapy.96

Reticulated platelets are newly released platelets that retain residual RNA, analogous to red cell reticulocytes. Reticulated platelet counts give an estimate of thrombopoiesis and may be useful in distinguishing platelet destruction syndromes from hypoplastic platelet production.97,98 Reticulated platelets can be detected by flow cytometric methods using thiazole orange dyes that bind to RNA99 or by automated hematology analyzers,100,101 although they are not routinely measured. Normal values vary between 3% and 20%, and 2.5- to 4.5-fold increases in reticulated platelet counts are seen in the clinical setting of idiopathic thrombocytopenic purpura.102 Increased reticulated platelets may herald the return of platelet production after chemotherapy.103


ADVANTAGES AND SOURCES OF ERROR WITH AUTOMATED HEMATOLOGY

Clearly, the use of automated hematology analyzers has reduced laboratory costs and turnaround time coincident with improving the accuracy and reproducibility of blood counts. The CV for most of the parameters measured is in the range of 1% to 2%. This level of reproducibility is not achievable with the use of most manual techniques (Tables 1.1 and 1.2).

Despite this high degree of accuracy, several potential errors may invalidate automated collection of data. Proper calibration of instrumentation is essential for collection of accurate data. Faulty current settings, which determine threshold counting values as well as variation in either the counting volumes or flow characteristics of a sample, negatively affect data accuracy. Electrical or mechanical failures as well as minor voltage fluctuations may induce marked errors in data collection. Careful calibration of the instrumentation initially, followed by frequent evaluation of reproducibility by analysis of samples with known cell concentrations, is an essential quality control measure.104 Reference methods for instrument calibration have been developed by both the NCCLS and the ICSH and are widely used by hospital and clinical laboratories to ensure regulatory compliance.49,67,105

Certain disease states are also associated with spuriously high or low results, although some of these are specific to a particular type of instrumentation (summarized in Table 1.3). Therefore, the individual values obtained from the automated hematology analyzer must be interpreted in context with the clinical findings. In addition, careful examination of the stained blood film often imparts additional information that may not be reflected in the average values that constitute the automated data. For example, decreased red blood cell counts, macrocytosis, and extremely high MCHC have been observed in patients with cold agglutinin disease with a higher thermal amplitude and in some patients with elevated serum viscosity.63 High levels of paraprotein may lead to falsely elevated hemoglobin levels, therefore affecting MCH and
MCHC calculations.40 Older analyzers reported spurious increases in hemoglobin levels when white cell counts exceeded 30 × 109/L due to increased turbidity, but this is decreased with newer flow systems so that hemoglobin levels remain extremely accurate in the face of white blood cell counts as high as 100 × 109/L.16 Extremely high white cell counts may also falsely raise the red cell count and Hct as the white cell count is incorporated into the red cell count. High glucose levels (>400 to 600 mg/dl) and the associated hyperosmolarity cause red cell swelling and generate a high MCV and Hct with a falsely low MCHC.36,106 Increased turbidity associated with hyperlipidemia may also cause falsely elevated hemoglobin determinations, MCH, and MCHC.41


TABLE 1.3 DISORDERS AND CONDITIONS THAT MAY REDUCE THE ACCURACY OF BLOOD CELL COUNTINGa


Component


Disorder/Condition


Effect on Cell Count


Rationale


Red cells


Microcytosis or schistocytes


May underestimate RBC


Lower threshold of RBC counting window is greater than microcyte size


Howell-Jolly bodies


May spuriously elevate platelet count (in whole blood platelet counters only)


Howell-Jolly bodies are similar in size to platelets


Polycythemia


May underestimate RBC


Increased coincidence counting


White cells


Leukocytosis


Overestimate RBC


Increased coincidence counting


Acute leukemia and chronic lymphocytic leukemia, viral infections


May spuriously lower WBC


Increased fragility of leukocytes, including immature forms


Chemotherapy of acute leukemia


May artifactually increase platelet count


Leukemic cell nuclear or cytoplasmic fragments identified as platelets


Platelets


Platelet agglutinins


May underestimate platelet count, sometimes with spurious increase in WBC


Platelet clumping Aggregates may be identified as leukocytes


Plasma


Cold agglutinins


May underestimate RBC with spurious macrocytosis


Red cell doublets, triplets, and so forth have increased volume


Cryoglobulins, cryofibrinogens


Variation in platelet count


Protein precipitates may be identified as platelets


RBC, red blood cell count; WBC, white blood cell count.


aSome of these examples affect counts only when certain instruments are used. The effects depend on dilution, solutions used, and specimen temperatures.


Adapted from Koepke JA. Laboratory hematology. New York, NY: Churchill Livingstone, 1984.


Despite the high level of accuracy and precision, the automated hematology analyzers usually have data that create a warning flag in 10% to 25% of samples, requiring manual examination of the blood smear.3,4,16,107 Blood smear examination still plays an important role in characterizing these samples or showing findings outside the preset parameters for the laboratory. In addition, some cells require morphologic examination to identify, such as Sézary cells,108 and red cell morphology is best analyzed by direct smear examination.45,48

Only gold members can continue reading. Log In or Register to continue

Stay updated, free articles. Join our Telegram channel

Oct 21, 2016 | Posted by in HEMATOLOGY | Comments Off on Examination of the Blood and Bone Marrow

Full access? Get Clinical Tree

Get Clinical Tree app for offline access