[t(9;22)] (Fig. 3.2). The Philadelphia chromosome or a variant rearrangement is seen in nearly all patients with CML. In later studies, it was shown that the translocation involved breakpoints in two genes, BCR on chromosome #22 at band 22q11.2 and ABL1 on chromosome #9 at band 9q34 (Fig. 3.3). These breakpoints were in very specific regions of both genes and the translocated segment of ABL1 juxtaposed to BCR created a functional chimeric fusion protein with increased tyrosine kinase activity. This BCR/ABL1 fusion protein upregulates the growth of these cells and causes them to have a proliferative advantage over the normal cells.14 Today, inhibitors of tyrosine kinase activity (most notably Gleevec or imatinib) have been used to treat patients with CML and acute lymphoblastic leukemia who have the Ph chromosome. This type of treatment has been very successful in treating these patients.15 Since then, numerous other chromosome abnormalities have shown associations with specific hematologic disease entities (Table 3.1), some of which have targeted or specific therapy directed toward their fusion protein.
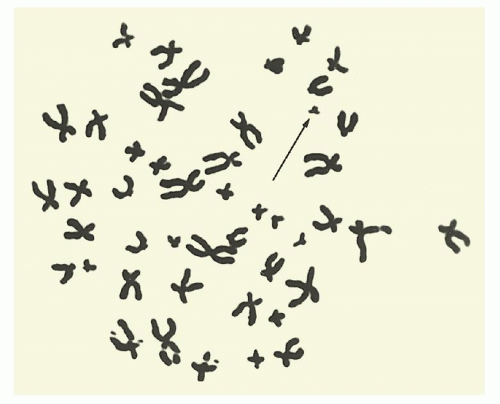 FIGURE 3.1. An unbanded metaphase spread from bone marrow cells of a patient with chronic myelogenous leukemia showing the Ph chromosome. |
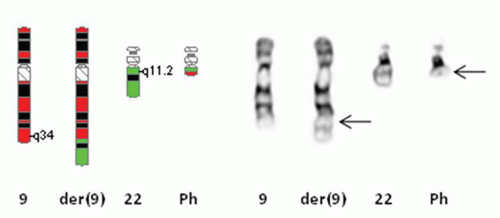 FIGURE 3.2. Illustration of t(9;22) observed in chronic myelogenous leukemia and acute lymphoblastic leukemia. Ideogram of chromosomes #9 and #22 on left with partial karyotype on right. Arrows indicate breakpoints. |
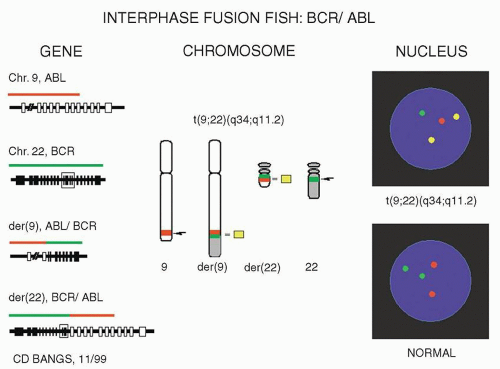 FIGURE 3.3. Fluorescence in situ hybridization illustration of t(9;22) with red-labeled ABL1 probe spanning the breakpoint at 9q34 and green-labeled BCR probe spanning the breakpoint at 22q11.2. At right, nuclei showing abnormal and normal signal pattern with yellow fusions. |
well as acquired (somatic) chromosome abnormalities associated with different types of cancer. Chromosome analysis requires living, dividing cells which are arrested in metaphase by using a substance that inhibits spindle fiber formation during mitosis (e.g., Colcemid, Velban). Typically, leukemias and lymphomas are studied by preparing short-term cultures (direct, 24-, 48-, or 72-hour) grown in suspension. The cells are then “harvested” using a hypotonic solution (sodium chloride or sodium citrate) and fixed using a mixture of methanol and acetic acid. Slides are made by dropping the cell suspension on the slides and drying them. The slides are aged and then banded using trypsin (or pepsin) and Giemsa (or Wright’s or Leischman’s) stain. This produces the G-banding pattern widely used to recognize and identify chromosomes and their abnormalities (Fig. 3.4). Chromosome analysis is performed by individuals who have been trained to recognize the banding patterns of each individual chromosome pair, chromosomes #1 through #22 and the X and Y sex chromosomes. Banded metaphases are identified and analyzed using a light microscope equipped with high resolution objectives (typically 10× oculars, with 63× or 100× objectives—enlarged up to 1000× their normal size). Images are then acquired using a CCD (charged coupled device) camera, and proprietary software is used to create the karyotype. A karyotype is the chromosomal makeup of a particular cell or individual. The software enables a technologist to create the digital karyotype, but the software/computer cannot completely recognize nor interpret the karyotype; this must be done interactively by the trained technologist. Chromosome analysis of leukemias and lymphomas requires complete analysis of a minimum 20 metaphase cells if possible.16 This is not a random process. Technologists (or automated imaging systems) scan the slides looking for abnormal metaphases. Often, there are normal metaphases that are part of the milieu. These are typically avoided, if there are abnormal metaphases present. All cells are completely analyzed—matched band-by-band, chromosomeby-chromosome pair, looking for any inconsistencies or abnormalities, be they structural or numerical. Clonal abnormalities are described and documented. Clonal anomalies are defined as two or more cells with the same structural abnormality or same extra chromosome, while loss of a chromosome must be observed in three or more cells in order to be considered clonal.17 Karyotypes are then created as both an analytical and a documentary tool and the chromosome diagnosis rendered.
TABLE 3.1 CHROMOSOME ABNORMALITIES AND ASSOCIATED DISEASES | ||||||||||||||||||||||||||||||||||||||||||||||||||||||||||||||||||||||||||||||||||||||||||||||||||||||||||||||||||||||||
|---|---|---|---|---|---|---|---|---|---|---|---|---|---|---|---|---|---|---|---|---|---|---|---|---|---|---|---|---|---|---|---|---|---|---|---|---|---|---|---|---|---|---|---|---|---|---|---|---|---|---|---|---|---|---|---|---|---|---|---|---|---|---|---|---|---|---|---|---|---|---|---|---|---|---|---|---|---|---|---|---|---|---|---|---|---|---|---|---|---|---|---|---|---|---|---|---|---|---|---|---|---|---|---|---|---|---|---|---|---|---|---|---|---|---|---|---|---|---|---|---|
| ||||||||||||||||||||||||||||||||||||||||||||||||||||||||||||||||||||||||||||||||||||||||||||||||||||||||||||||||||||||||
and sub-sub-bands observed by metaphase chromosome analysis. Each chromosome has its own particular set of recognized bands, which allows it to be identified as such (Fig. 3.5). For instance, all human chromosome #1’s look very similar to one another, having the same pattern of light and dark bands, with the exception of a known variant region near the centromere. Chromosomes are divided into short arm and long arm by the centromere or primary constriction, which mediates attachment to the spindle fiber apparatus in mitosis. Bands in the short arm are labeled “p,” while bands in the long arm are labeled “q.” Each chromosome arm has landmark bands which demarcate the regions of the chromosome arm (this is the first number indicated after the p or q designation). These regions are then divided into bands, and possibly sub-bands or sub-sub-bands. Bands are numbered in increasing order starting at the centromere and proceeding toward the end of the chromosome arm (or telomere). The total number of chromosomes observed is stated first, with the sex chromosome designation given following a comma. There are normally no spaces between the numbers, letters, and punctuations that make up the karyotype designation. As an example, a female patient with the Philadelphia chromosome would have a karyotype written as “46,XX,t(9;22)(q34;q11.2)[18]/46,XX[2],” meaning that she has the Ph or t(9;22) in 18 of her metaphases (18 in []), a slash designating a second normal cell line with 46,XX (or normal chromosomes) in two metaphases (2 in []). The breakpoint in chromosome #9 is at band 9q34 (long arm or q arm, region 3, band 4 or band three four, not thirty-four) and the breakpoint in chromosome #22 is at sub-band 22q11.2 (long arm or q arm, region 1, band 1, sub-band .2 or band one one point two, not eleven point two). There are rules as well for describing both interphase and metaphase FISH (Table 3.2).
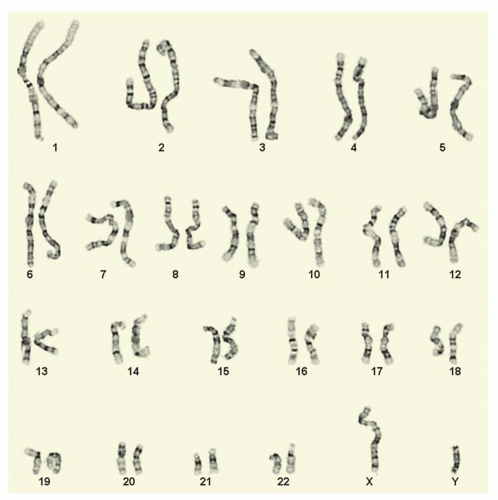 FIGURE 3.4. Normal male G-banded karyotype. |
Related posts:
 The Birth, Life, and Death of Red Blood Cells: Erythropoiesis, The Mature Red Blood Cell, and Cell Destruction
Megakaryocytes
Iron Deficiency and Related Disorders
Paroxysmal Nocturnal Hemoglobinuria
Red Cell Aplasia: Acquired and Congenital Disorders
Thrombocytopenia Caused by Immunologic Platelet Destruction
The Birth, Life, and Death of Red Blood Cells: Erythropoiesis, The Mature Red Blood Cell, and Cell Destruction
Megakaryocytes
Iron Deficiency and Related Disorders
Paroxysmal Nocturnal Hemoglobinuria
Red Cell Aplasia: Acquired and Congenital Disorders
Thrombocytopenia Caused by Immunologic Platelet Destruction
Stay updated, free articles. Join our Telegram channel

Full access? Get Clinical Tree


