Clinical Flow Cytometry


Clinical Flow Cytometry


Anna Porwit


HISTORICAL BACKGROUND

FCM dates back to the work done in Stockholm by T. Caspersson and coworkers, who in the 1930s demonstrated that DNA content, measured by ultraviolet and visible light absorption in unstained cells, doubled during the cell cycle.1,2 In 1950, Coons and Kaplan reported on the detection of antigens in tissues using fluorescein conjugated antibody methods, which prompted wide use of fluorescence microscopes.3 In 1953, W. H. Coulter patented the so-called Coulter principle and built the first FCM machine, in which blood cells in saline suspensions passed one by one through a small orifice and were detected by changes of electrical impedance at the orifice.4 After the first paper in Science by M. Fulwyler,5 the era of standard use of FCM for cell sorting started, beginning with publications from the L.A. Herzenberg Laboratory at Stanford University, CA, USA in the early 1970s.6 Soon after, the first flow cytometers became commercially available from Becton Dickinson (now BD Biosciences), followed by other companies. FCM came into clinical use in the late 1980s, at first only in specialized laboratories. In the 1990s and early 2000s, threeand four-color analysis became a standard diagnostic method for immunophenotyping of hematologic samples. Many clinical solutions and standardization efforts were initialized by A. Orfao and coworkers, from the University of Salamanca, Spain.7,8 In 2010, eight- and ten-color FCM became a standard clinical method.9,10 In research settings, applications using 19-parameter FCM combining 17 fluorescence channels with forward scatter (FS) and side scatter (SS) have been reported.11


PRINCIPLES OF FLOW CYTOMETRY

For reliable analysis, the specimen must be in a monodisperse suspension. In a flow cytometer, isotonic fluid is forced under pressure into a tube that delivers it to the flow cell, where a fluid column with laminar flow and a high flow rate is generated (socalled sheath fluid). The sample is introduced into the flow cell by a computer-driven syringe in the center of the sheath fluid, creating a coaxial stream within a stream (the so-called sample core stream). The pressure of the sheath stream hydrodynamically aligns the cells or particles so that they are presented to the light beam one at a time. Flow cytometers measure the amount of light emitted by fluorochromes associated with individual cells or particles (Fig. 2.1). New flow cytometers have three to four lasers.12 For application in FCM, antibodies are conjugated with fluorochromes, dyes that absorb the light from the laser and emit light at longer wavelengths. The list of fluorochromes commonly used in clinical FCM is given in Table 2.1.13 The emitted light is focused by a lens onto fiberoptic cables and transmitted to octagonal detectors (Fig. 2.1). Filters in front of each of a series of detectors restrict the light that reaches the detector to only a small particular range of wavelengths (referred to as channels). The sensors convert the photons to electrical impulses that are proportional to the number of photons received and to the number of fluorochrome molecules bound to the cell. The fluorescent emissions are of low intensity and have to be amplified by photomultiplier tubes (PMT). PMTs count the specific photons and the remaining light is reflected to the next filter, where the process is repeated. Thus, most of the cell-associated fluorescence detected in a given channel is emitted by fluorochrome-coupled antibodies or other fluorescent reagents of interest. Electrical impulses from photoelectrons collected by PMTs are converted to digital signals. Acquired FCM data are electronically stored in so-called list-mode files that are a part of the medical record of the patient.14

A pair of light scatter channels provides an approximate measure of cell size (FS) and granularity (SS). FS and SS are used to set the threshold for separating debris, erythrocytes, and platelets from viable nucleated cells. Live cells scatter more light than dead and apoptotic cells and therefore have higher FS. SS is collected together with fluorescent light at right angles to the beam and is due to light reflected from internal structures of the cell. Cells with high granularity or vacuoles such as granulocytes or monocytes will have higher SS than ones with no granules such as lymphocytes or blast cells.

Most cells have low numbers of native fluorescent molecules that define their background fluorescence. Some of the light may come from spillover fluorescence emitted by a reagent measured
in a different channel. The interference is corrected by applying fluorescence compensation based on data from single-stained samples. This is usually done using cells or beads before or during the data acquisition phase. However, modern FCM data analysis software also allows collection of uncompensated data and applying compensation during analysis. Before data acquisition, standard reference particles (fluorescent microspheres) should be used to adjust the PMT voltage settings so that the beads fall in approximately the same location or the same “target channels,” predetermined for each fluorochrome.


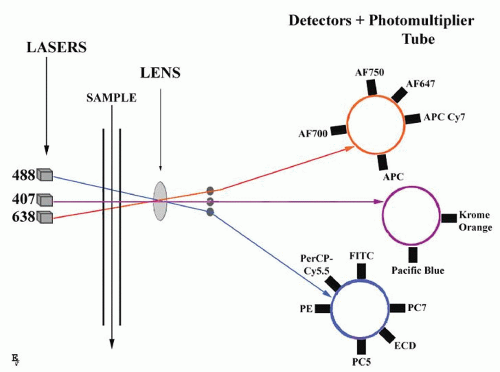
FIGURE 2.1. Principles of multicolor flow cytometry. A single cell suspension is hydrodynamically focused with sheath fluid to intersect lasers (three-laser system is shown). Fluorescence signals are collected by multiple fluorescence emission detectors, separate for every laser. Examples of fluorochromes detected by different lasers are given according to Table 2.1. Detected signals are amplified by photomultiplier tubes and converted to digital form for analysis.


TABLE 2.1 TABLE OF FLUOROCHROMES COMMONLY USED IN CLINICAL FLOW CYTOMETRY


Probe


Ex (nm)


Em (nm)


MW


Acronym/Comments


Reactive and Conjugated Probes


R-Phycoerythrin


480;565


578


240 k


PE


Red 613


480;565


613


PE-Texas Red


Fluorescein isothiocyanate


495


519


389


FITC


Rhodamine isothiocyanate


547


572


444


TRITC


X-Rhodamine


570


576


548


XRITC


Peridinin chlorophyll protein


490


675


PerCP


Texas Red


589


615


625


TR


Allophycocyanin


650


660


104 k


APC


TruRed


490,675


695


PerCP-Cy5.5


Alexa Fluor 647


650


668


1250


Alexa Fluor 700


696


719


Alexa Fluor 750


752


779


Cyanine 5


(625);650


670


792


Cy5


Cyanine 5.5


675


694


1128


Cy5.5


Cyanine 7


743


767


818


Cy7


PE-TR-X


595


620


625


ECD


PE-Cy5 conjugates


480;565;650


670


Cychrome, Tri-Color, Quantum Red


PE-Cy7 conjugates


480;565;743


767


PE-Cy7


APC-Cy7 conjugates


650;755


767


APC-CY7


Nucleic Acid Probes


4′,6-Diamidino-2-phenylindole


345


455


DAPI ,AT-selective


SYTOX Blue


431 480


˜400


DNA


SYTOX Green


504


523


˜600


DNA


Ethidium bromide


493


620


394


7-Aminoactinomycin D


546


647


7-AAD, CG-selective


Acridine Orange


503


530/640


DNA/RNA


Thiazole Orange


510


530


TO (RNA)


Propidium iodide


536


617


668.4


PI


Em, peak emission wavelength (nm); Ex, peak excitation wavelength (nm); MW, molecular weight.


Cell Sorting

Some flow cytometers are capable of physically separating the cells (fluorescence activated cell sorter, FACS) based on differences in any measurable parameters. Sorting is achieved by droplet formation. The basic components of any sorter are:


  • A droplet generator


  • A droplet charging and deflecting system


  • A collection component


  • The electronic circuitry for coordinating the timing and generation of droplet-charging pulses

The flow chamber is attached to a piezoelectric crystal, which vibrates at a certain frequency so that when the fluid carrying the cells passes through the nozzle, forming a jet in air with a velocity of 15 m/s, the vibration causes the jet to break up in precisely uniform droplets, approximately 30,000 to 40,000/s. Each droplet, when separated from the jet, can be charged and deflected by a steady electric field and is collected in a receptacle. Almost every cell is isolated in a separate droplet. When the cell is analyzed a sorting decision is made, and until the proper electrical charge pulse is applied to the droplet containing the cell, there is a transit time determined by several factors, such as flow velocity, droplet separation, and the cell preparation. If two cells cannot be separated the sorting is aborted.


Monoclonal Antibodies

Advances of FCM would not be possible without development of monoclonal antibodies (MAbs). By the Nobel Prize winning hybridoma technology developed in 1975 by Köhler and Milstein,15 lymphocytes from the spleen of an immunized mouse can be immortalized by fusion to myeloma cells that have lost the ability to make their own immunoglobulins (Igs) but are capable of unlimited mitotic divisions. Through limited dilutions, individual
cell lines (hybridomas) that produce an antibody of unique specificity, avidity, and isotype can be established. In the early days of the application of MAbs to immunology, many laboratories were immunizing mice with leukocytes. The obtained hybridomas produced many antibodies that reacted with leukocytes, but the identities of the molecular targets were not known. The reactivity spectrum of the antibody could be described by staining multiple different cell types, and in most cases the target antigen could be isolated by immunoprecipitation or Western blotting and its molecular weight and other structural characteristics determined.

The first round of multilaboratory, blind, comparative analyses of antibodies was performed during the first Human Leukocyte Differentiation Antigen (HLDA) Workshop 1982 in Paris, France.16 Statistical analysis of data from several laboratories revealed “clusters of differentiation,” named for the statistical procedure of cluster analysis and for the focus on leukocyte differentiation. Antibodies thought to be detecting the same molecule, and the molecule itself, were given a “CD” designation.17 An organization called the Human Leukocyte Differentiation Antigen Council has been established and nine subsequent HLDA workshops have characterized 350 CD antigens. The HLDA council reviewed and modified the objectives of HLDA in 2004, and changed the name of the organization to Human Cell Differentiation Molecules (HCDM). The reasoning behind the name change to HCDM was to break with tradition while retaining the letters “CD,” to maintain emphasis on molecules of human origin, to extend focus from leukocytes to other cell types interacting with leukocytes such as endothelial cell or stromal cell molecules, and to broaden the scope from cell-surface molecules to any molecule whose expression reflects differentiation, recognizing the growing values of intracellular molecules. The HCDM council keeps a comprehensive database of CD molecules (www.hcdm.org). CD antigens, which are most often applied in hematologic immunophenotyping are listed in Table 2.2 and are described in Appendix A.


Sample Preparation

Appropriate samples for clinical FCM include peripheral blood (PB), bone marrow (BM) aspirate, disaggregated tissue including lymph node (LN) and other soft tissue biopsies as well as fine needle aspirations (FNA) and BM core biopsies, cerebrospinal fluid (CSF), other body fluids including effusions and lavage fluids, and nuclei from paraffin-embedded tissue for DNA ploidy assays. With the exception of the latter, all other clinical FCM specimens should be considered biohazardous and labeled as such in accordance with national or regional safety standards. A test requisition form, whether printed or electronic, should accompany all specimens. This form should include unique patient identifiers, age, sex, diagnosis (if previously established) or suspect condition under consideration, name of the physician submitting the specimen, pertinent medication or recent treatment (including dates of chemotherapy or radiation), date and time of specimen collection, and source of the specimen (e.g., bone marrow aspirate, CSF, etc.). The requested test should appear on the specimen label or on the requisition accompanying the specimen. Complete blood count (CBC) should be provided for PB and BM samples. For PB, ethylene-diaminetetraacetic acid (EDTA), sodium heparin, or acid citrate dextrose (ACD) may be used. For BM aspirates, sodium heparin is the preferred anticoagulant, and is required if cytogenetic testing is to be performed on the same specimen. All tissue biopsies intended for FCM evaluation, including LN or other tissue biopsies should be transported in an adequate volume of an appropriate transport medium in a sterile container to optimize cell viability. CSF samples should be stabilized or analyzed immediately due to potential toxic effect on cell viability.18

All clinical samples should be analyzed as soon as possible. As a general rule, 24 hours is preferred but 48 hours is considered the longest acceptable time frame for analysis. If transport time is longer, a viability report is mandatory and the results should be interpreted cautiously. Room temperature (18°C to 25°C) is recommended for storage and transport. For specimens that are not highly degenerated, nonviable cells can be excluded from the analysis by meticulous FS versus SS gating. Dead cells trap fluorochrome-conjugated antibodies and increase background fluorescence. Fluorescent, DNA-binding dyes (Table 2.1) that are excluded from viable cells with intact plasma membranes and thus positive in nonviable cells, can also be applied.

Whole PB/BM analysis with erythrocyte lysis is recommended for clinical immunophenotyping. Immunophenotyping of density gradient (Ficoll) separated mononuclear cells should not be used due to selective cell loss. For surface(s) staining, the so-called “stain-lyse-wash” method gives the best signal discrimination. Cells are first incubated with appropriate amounts of titrated MAb, then erythrocytes are lysed and cells finally are washed before acquisition. Several commercial lysis reagents, most of which also contain a fixative, are available. Samples to be stained for sIg should be thoroughly washed before incubation with MAb, in order to avoid false negative results due to the presence of serum Igs.

Evaluation of intracellular epitopes, including proteins, epigenetic protein modifications (e.g., protein phosphorylation, methylation, etc.), DNA, or RNA generally require that the target cell population be fixed and permeabilized in order to allow antibodies or target-binding dyes to cross the cytoplasmic and nuclear membranes. Commercial fixation and permeabilization kits, with recommended protocols, are available from several manufacturers.19,20 For newly developed tests, it is useful to check whether the obtained intracellular staining is associated with an expected localization, using fluorescence microscopy. The specificity of the applied antibody should also be ensured. For cytoplasmic (cyt.) or nuclear (n) staining, it is important to use antibody conjugates that are free of unconjugated fluorochrome molecules that can stick to intracellular proteins nonspecifically. When simultaneous detection of surface and intracellular epitopes is necessary, the surface staining is performed first, then cells are fixed and permeabilized, and finally intracellular epitopes are stained.


Fluorochromes and Panels

Panel selection should be based on specimen type with consideration of information provided by clinical history, medical indication, and morphology.21 Several guidelines and consensus papers giving lists of antigens proposed for diagnosis of hematologic malignancies have been published.21,22 Selecting which antibody combinations best delineate, distinguish, and measure key differences within the target populations of interest and the number of simultaneously measured antibodies is a critical step for FCM assays. Serial dilution antibody titrations against both positive and negative cellular targets are necessary for antibody optimization. Choice of fluorochrome conjugate can affect background, specificity, and dynamic range of measurement. Typically, one would choose a fluorochrome with the best quantum efficiency/yield as the antibody conjugate to identify the lowest antigen density so as to obtain the best possible signal-to-noise ratio possible. It is of high importance to reliably distinguish between antigen-positive and antigen-negative cell populations in order to accurately measure the population of positive cells. This can be a challenge in populations of cells weakly expressing antigens. Florescence-minus-one (FMO) controls give the maximum fluorescence expected for a given population in a given channel when the reagent used in that channel is omitted.23 These controls include both autofluorescence of the cells and the spillover that may be present even after compensation corrections and therefore such controls are best suited to determine boundaries between positive and negative cells for each subset.


TABLE 2.2 LIST OF CD ANTIGENS MOST COMMONLY USED IN FLOW CYTOMETRY IMMUNOPHENOTYPING OF HEMATOLOGIC SAMPLES


CD


Expression in Normal Hematopoietic Cell Types


MW (kD)


Function


CD1a


Cortical thymocytes, Langerhans cells, dendritic cells


49


Antigen presentation, w/β2m


CD2


Thymocytes, T-cells, NK cells


50


CD58 ligand, adhesion, T-cell activation


CD3


T-cells, thymocyte subset


w/TCR, TCR surface expression/signal transduction


CD4


Thymocyte subset, T-cell subset, monocytes, macrophages


55


MHC class II coreceptor, HIV receptor, T-cell differentiation/activation


CD5


Thymocytes, T-cells, B-cell subset


67


CD72 receptor, TCR or BCR signaling, T-B interaction


CD7


Thymocytes, T-cells, NK cells, small subset of hematopoietic progenitors


40


T costimulation


CD8


Thymocyte subset, T-cell subset, NK subset


32-34


MHC class I coreceptor, receptor for some mutated HIV-1, T-cell differentiation/activation


CD9


Eosinophils, basophils, platelets, activated T-cells


22-27


Cellular adhesion and migration


CD10


B-precursors, germinal center B-cells, thymocyte subset, neutrophils


100


Zinc-binding metalloproteinase, B-cell development


CD11a


Lymphocyte subsets, granulocytes, monocytes, macrophages


180


CD11a/CD18 receptor for ICAM-1, -2,-3, intercellular adhesion, T costimulation


CD11b


Granulopoietic cells, NK cells


170


Binds CD54, ECM, and iC3b


CD11c


Dendritic cells, granulopoietic cells, NK cells, and B-cell and T-cell subsets


150


Binds CD54, fibrinogen, and iC3b


CD13


Granulopoietic cells, monocytes


150-170


Zinc-binding metalloproteinase, antigen processing, receptor for corona virus strains


CD14


Monocytes, macrophages, Langerhans cells


53-55


Receptor for LPS/LBP, LPS recognition


CD15


Neutrophils, eosinophils, monocytes


Adhesion


CD16


Neutrophils, macrophages, NK cells


50-65


Component of low-affinity Fc receptor, phagocytosis, and ADCC


CD19


B-cells, plasma cells


95


Complex w/CD21and CD81, BCR coreceptor, B-cell activation/differentiation


CD20


B-cells


33-37


B-cell activation


CD21


B-cells and T-cells subsets


145, 110


Complement C3d and EBV receptor, complex w/CD19 and CD81, BCR coreceptor


CD22


B-cells


150


Adhesion, B-mono, B-T interactions


CD23


B-cells, eosinophils, platelets


45


CD19-CD21-CD81 receptor, IgE low-affinity receptor, signal transduction


CD24


Thymocytes, erythrocytes, lymphocytes, myeloid cells


35-45


Binds P-selectin


CD25


Activated B-cells and T-cells


55


IL-2Rα, w/IL-2Rβ, and γ to form high affinity complex


CD33


Granulopoietic cells, monocytes, dendritic cells


67


Adhesion


CD34


Hematopoietic precursors


105-120


Stem cell marker, adhesion, CD62L receptor


CD36


Platelets, monocytes, erythropoietic precursors


88


ECM receptor, adhesion, phagocytosis


CD38


High expression on B-cell precursors, plasma cells and activated T-cells, low on granulopoietic cells


45


Ecto-ADP-ribosyl cyclase, cell activation


CD41


Platelets, megakaryocytes


125/22


w/CD61 forms GPIIb, binds fibrinogen, fibronectin, vWF, thrombospondin, platelet activation and aggregation


CD42a


Platelets, megakaryocytes


22


Complex w/CD42b, c and d, receptor for vWF and thrombin, platelet adhesion to subendothelial matrices


CD45


Hematopoietic cells, multiple isoforms from alternative splicing


180-240


Tyrosine phosphatase, enhanced TCR and BCR signals


CD56


NK subset, T-cell subset


CD175-185


Neural cell adhesion molecule


CD57


NK subset, T-cell subset


110


HNK-1


CD59


Ubiquitous


18-20


Complement regulatory protein


CD61


Platelets, megakaryocytes


105


Integrin β3, adhesion, CD41/CD61 or CD51/CD61 mediate adhesion to ECM


CD62L


B-cells, T-cells subsets, monocytes, granulocytes, NK-cells, thymocytes


74, 95


CD34, GlyCAM, and MAdCAM-1 receptor, leukocyte homing, tethering, rolling


CD64


Monocytes, neutrophils


72


FCγRI, increases on neutrophils in sepsis


CD65


Granulopoietic cells


Phagocytosis


CD66


Neutrophils


90


Cell adhesion


CD68


Monocytes, neutrophils, basophils, mast cells,


110


Macrosialin


CD71


Proliferating cells, erythroid precursors, reticulocytes


95


Transferrin receptor, iron uptake


CD79


B-cells, plasma cells


33-37


Component of BCR, BCR surface expression and signal transduction


CD103


B- and T-cell subsets


150, 25


w/integrin β7, binds E-cadherin, lymph homing/retention


CD117


Hematopoietic progenitors, mast cells


145


Stem cell factor receptor, hematopoietic progenitor development/differentiation


CD123


Basophils, dendritic cell subset, hematopoietic progenitors


70


IL-3Rα, w/CDw131


CD133


Hematopoietic stem cells subset


120


CD159c


NK


40


w/MHC class I HLA-E molecules, forms heterodimer with CD94


CD235a


Erythropoietic precursors


36


Glycophorin A


For a comprehensive list and characteristics please see www.hcdm.org.


Often the same anchor gating antibodies are used in every tube thereby allowing consistent population gating strategies across all tubes of a panel. In immunophenotyping of lymphocyte subsets and in the diagnosis of leukemia/lymphoma, CD45 anchor gating has been shown to provide differential population identification correlated to morphologic microscopic differentials (Fig. 2.2)24,25:


  • Mature lymphocytes are characterized by low side scatter and strong CD45 expression (lymph region, Fig. 2.2 plot B).


  • Monocytes have higher SS and strong CD45 expression (monocyte region, Fig. 2.2 plot B).


  • Erythropoietic precursors are CD45 negative and have low SS (CD45- ery region, Fig. 2.2 plot B).


  • Granulopoietic precursors and granulocytes are weakly CD45 positive and have high SS (CD45 dim, gran region, Fig. 2.2 plot B).


  • Early hematopoietic precursors of various lineages, including CD34+ stem cells, are characterized by low CD45 expression and low SS (blast region, Fig. 2.2, plot B).

The localization of these subpopulations on the CD45/SS plot can be confirmed by multicolor staining of various lineage-associated antigens together with CD45 (Fig. 2.2, plots C-K) and visualization of cell clusters positive for given antigen combinations on the CD45/SS plot (Fig. 2.2, plot B) by so-called back-gating using color-coding.25

In multicolor FCM, lineage-associated antigens that are broadly expressed through maturation of investigated cell lineage can be used for gating in conjunction with SS and CD45 (e.g., CD19 for B-cells, CD3 for T-cells Figs. 2.2 and 2.3). Examples of 10-color panels for leukemia and lymphoma, currently used at the Flow Cytometry Laboratory at the Department of Laboratory Medicine, University Health Network, Toronto General Hospital, Toronto, Ontario, Canada are given in Table 2.3.


Data Analysis and Reporting

Fluorescence data may be presented using either linear or logarithmic amplification. In linear amplification, fluorescence differences are directly proportional to differences of fluorochrome concentration between cells. Logarithmic amplification compresses a wide input range, which may cause difficulties in resolving populations with similar fluorescence intensities. “Logicle” (or “biexponential”) displays have recently been designed for the display of FCM data so that they incorporate the useful features of logarithmic displays but also provide accurate visualization of populations with low or background fluorescence.12 During analysis, data is presented in form of:


  • Histograms (for one parameter), where relative fluorescence or scatter is on the x-axis and the number of events with given characteristics on the y-axis


  • Two-parameter dot plots, where each signal is visualized by one dot and given a parameter on the x– and y-axes; various cell populations can be then “painted” with different colors


  • Density plots, where hotspots indicate large numbers of events resulting from discreet population of cells and colors can give the graph a three-dimensional feel


  • Contour diagrams, where joined lines represent similar numbers of cells

New software where multiparameter data can be analyzed using principal component analysis is also available.9,26

Analysis is usually focused on identifying and quantifying subsets of cells. Successful analysis will depend on correct marker selection and panel design. Cell counts and percentages are typically reported. The choice of gating strategy depends on the panel used and specific populations of interest. In immunophenotyping of PB and BM, the analysis can be focused on lymphocytes (CD45 bright gate, Fig. 2.4), B-lymphocytes (Fig. 2.3), blasts (CD45 dim gate, Figs. 2.2 and 2.5), T-lymphocytes and natural killer (NK) cells, on monocytes, or include all living cells in the sample (debris excluded). In tissue samples (lymph nodes, FNA, body fluids) a broad lymphocyte gate is usually applied. The parent population should be clearly identified when percentages are reported: a fraction may represent a percentage of all living cells in the sample (debris excluded), a percentage of lymphocytes, a percentage of B-cells, a percentage of T-cells, or a percentage of blasts.

In hematology, assays are usually designed to characterize abnormal cell populations or stages of cell development. In these tests, marker intensities are used to identify the immunophenotype of the cells at various stages of differentiation. Therefore, markers with good dynamic range and proper spillover compensation are critical. Intensity results are typically reported as medians or geometric means. A comparison to control populations either external such as beads or internal such as normal mature cells is often used. If fluorescence intensity is comparable to normal mature cells, it is reported as “normal”: positive if it corresponds to normal cells, “dim” if it is weaker than in normal cell population, or “bright” if it is stronger than in normal cells.

Most currently used analysis software allows cross-platform application for analysis and makes it possible to create analysis templates that are a useful tool for assuring that the analysis is always performed in the same way.9,26 Templates help to include all critical elements, and they can serve as an example of how the analysis should be performed. Due to the highly complex nature of multiparameter analysis, it is recommended that experienced interpreters with knowledge of instrumentation, software, and data analysis produce the templates and supervise the reporting. The final report should contain:


  • Demographic identification of patient


  • Identification of the hospital or division sending the sample


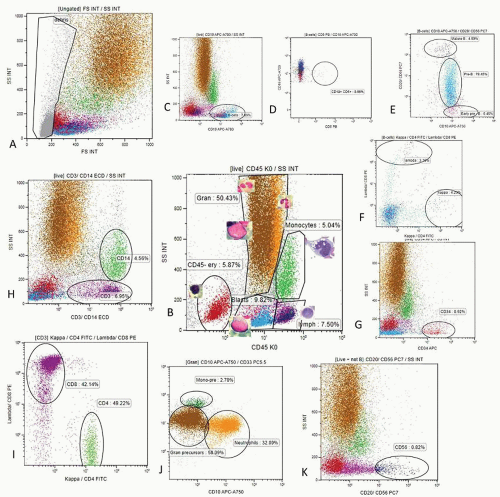
    FIGURE 2.2. Bone marrow mapping with polychromatic flow cytometry. Reactive bone marrow sample from a young patient was analyzed with a screening ten-color 14 MAb panel on a Navios flow cytometer and Kaluza software (Beckman Coulter). The MAb panel consisted of kappa+CD4 FITC/Lambda+CD8-PE/CD3 + CD14 ECD/CD34 APC/CD20+CD56-PC7/CD10-APC-A750/CD19-APC-A700/CD33 PC5.5/CD5-Pac Blue/CD45 Krom Orange. Analysis starts with the creating of the “live cells” gate by removal of dead cells, erythrocyte, and platelet aggregates on FS/SS plot (A). A CD45/SS plot is created within the live cell gate (B). Regions for lymphocytes (CD45bright/low SS), monocytes (CD45 bright/high SS), granulopoietic cells (CD45 dim/high SS), CD45dim/low SS blasts, and CD45-low SS erythropoietic cells are determined. The B-cell gate is created from the live cell gate on the CD19/SC plot (C). Presence of CD5 positive B-cells is investigated using a CD5/CD19 plot (D). The presence of CD10+ B-cells is looked for by analysis of CD20 and CD10 expression within the B-cell gate (E). In this patient, no CD5+ B-cells were detected but a significant fraction of B-cells showed B-precursor immunophenotype with normal maturation pattern (E). If a CD5+ or CD10+ B-cell population is present, a new gate can be created within plot D or E. B-cell clonality is analyzed within the B-cell gate (F). In this patient most B-cells are negative for light chain expression, consistent with B-cell precursors. Note that most of CD10+/CD20 dim B-cell precursors (cyan dots) fall into the blast gate in the CD45/SS plot (B). Kappa and lambda positive B-cells have normal kappa to lambda ratio. If CD5 and/or aberrant CD10+ B-cells were present, clonality of B-cells would be analyzed within the specific CD5+/CD19+ or CD10+/CD19+ gate. The fraction of CD34+ cells (red dots) is estimated within the live cell gate on the CD34/SS plot (G). If increased numbers of CD34+ cells are found, they are further analyzed for CD33, CD19, and CD10 expression. CD3+ T-cell and CD14+ monocyte gates are created on the CD45/CD3+CD14 plot within the live cell gate (H). Fractions of CD4+ (violet dots) and CD8+ T-cells (light green dots) are estimated within the CD3+ gate (I). CD4/CD8 ration was normal (1.16). Granulopoietic cells are analyzed on CD33/CD10 plot within the “Gran” gate and fractions of mature neutrophils (CD33+CD10, orange dots) and granulopoietic precursors (CD33+ CD10, brown dots) are estimated (J). CD14-CD33bright monocytic precursors can also be enumerated (green dots). Finally the fraction of CD56+ NK cells (dark blue dots) can be evaluated on a CD20+56/SS plot using the Boolean gate of live cells + non-B-cells to exclude CD20+ B-cell from analysis (K). Various cell populations are back-gated and visualized on both FS/SS and CD45/SS plots (A and B).


  • Type of specimen (bone marrow aspirate, peripheral blood, other biologic fluids)


  • Timing of observation (first diagnosis or follow-up)


  • Diagnostic hypothesis made by the sender


  • List of antigens and type of immunofluorescence analysis carried out


  • Absolute number of cells in the sample


  • Quality of the sample, in terms of viability


  • General description of the gating procedure


  • Immunophenotype of abnormal cells present in the sample


  • Description of other (normal) cells


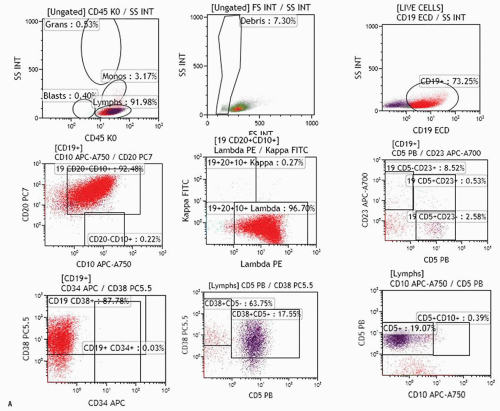
    FIGURE 2.3. A. Examples of analysis of B-cell compartment in bone marrow samples. Ten-color MAb panel, Navios flow cytometer, and Kaluza software (Beckman Coulter) were applied. Panel consists of Kappa-FITC/Lambda-PE/CD19 ECD/CD34-APC/CD10-APC-A750/CD23-APC-A700/CD20-PC7/CD38-PC5.5/CD5 Pc Blue/CD45-Krom Orange. The live cell gate is created and fractions of lymphocytes, granulocytes, monocytes, and the like are evaluated as shown in Figure 2.2. The B-cell gate is created on a CD19/SS plot and expression of CD5, CD23, and CD10 is analyzed within the B-cell population. Kappa and lambda light chain expression is analyzed within total B-cell, CD5+ B-cell, or CD10+ B-cells as appropriate. Expression of CD34 and CD38 within the C19+ B-cell population can also be analyzed (see Fig. 2.3B). The fraction of plasma cells can be estimated using CD38 bright expression and high SS on the CD38/SS plot (not shown). Upper row: population of B-cells with B-CLL/small lymphocytic lymphoma-related phenotype (CD19+, CD5+, CD23+, CD20 dim, kappa dim, CD10-) consistent with bone marrow involvement in a patient who was diagnosed with small lymphocytic lymphoma in a lymph node biopsy and had no peripheral lymphocytosis. Bone marrow biopsy showed rare nodular lymphoid infiltrates. Middle row: CD5-CD10-CD23- lambda+ B-cell population in a patient with Waldenström macroglobulinemia. Lower row: population of CD19+ CD10+ B-cells strongly expressing CD20 and kappa in a patient with bone marrow involvement by a follicular lymphoma. B. Examples of analysis of B-cell compartment in a lymph node cell suspension. Ten-color MAb panel, Navios flow cytometer, and Kaluza software (Beckman Coulter) were applied. Panel consists of Kappa-FITC/Lambda-PE/CD19 ECD/CD34-APC/CD10-APC-A750/CD23-APC-A700/CD20-PC7/CD38-PC5.5/CD5 Pc Blue/CD45-Krom Orange. The live cell gate is created and fractions of lymphocytes, granulocytes, monocytes, and the like are evaluated as shown in Figure 2.2. The B-cell gate is created on the CD19/SS plot and expression of CD5, CD23, and CD10 is analyzed within the B-cell population. Most B-cells were positive for CD20, CD38, and CD10, and showed monotypic lambda expression.


  • Diagnostic conclusions


  • Comments and/or recommendations for further testing.21,27


Validation of Assays and Quality Assurance

In clinical settings, the results obtained in FCM must be interpreted in relation to clinical information and to the results of other techniques (morphology, cytogenetics, molecular genetics, fluorescence in situ hybridization [FISH]), which are used as a validation of the information provided by FCM.21 Newly established panels have to be validated by comparison to reference
methodology, interlaboratory comparison, or verification with specimens obtained from patients with a confirmed diagnosis. A minimum of 10 to 20 samples (10 normal, 10 abnormal) is recommended for accuracy assessment. The acceptance criteria will also be variable depending on the required degree of accuracy for the intended use, nevertheless should be clearly defined for each assay. Ninety percent, or greater, agreement between methods is generally required for accuracy.


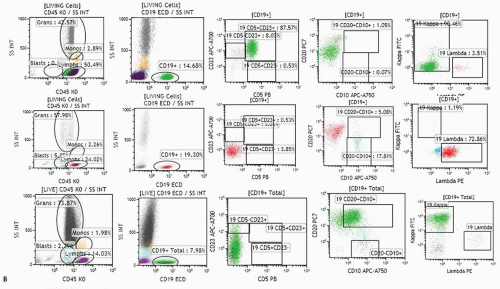
FIGURE 2.3. (Continued)

All instruments have to follow daily quality checks according to manufacturers’ recommendations. Participation in a suitable external quality assurance (EQA) program should be undertaken. Many proficiency testing programs are in existence operating at local, national, or international levels. The more common uses of FCM should be subjected to EQA and many of the larger international programs such as those operated by UK NEQAS for Leukocyte Immunophenotyping28 and the College of American Pathologists offer FCM EQA programs for leukemia and lymphoma diagnosis, lymphocyte subset monitoring, paroxysmal nocturnal hemoglobinuria (PNH), and CD34+ stem cell enumeration. Many of these programs use stabilized material enabling samples to be transported long distances such that data from large international cohorts can be examined to search for any instrument or reagent bias. The frequency of the samples issued by such programs is recommended to be at least four times per year to ensure continued performance monitoring.


TABLE 2.3 EXAMPLES OF 10-COLOR FLOW CYTOMETRY PANELSa IN IMMUNOPHENOTYPING OF LEUKEMIA AND LYMPHOMA


Panel


FITCb


PE


ECD


PC5.5


PC7


APC


APC-AF700


APC-AF750


PB


KO


B-cell


kappa


lambda


CD19


CD38


CD20


CD34


CD23


CD10


CD5


CD45


T-cell


CD57


CD11c


CD8


CD3


CD2


CD56


CD7


CD4


CD5


CD45


AML-granulo


CD65


CD13


CD14


CD33


CD34


CD117


CD7


CD11b


CD16


CD45


AML-mono


CD36


CD64


CD56


CD33


CD34


CD123


CD19


CD38


HLA-DR


CD45


AML-ery-ly


CD71


CD11c


CD4


CD33


CD34


CD2


CD10


CD235a


CD15


CD45


ALL-B


CD58


CD22


CD38


CD33


CD34


CD123


CD10


CD19


CD20


CD45


ALL-T


CD7


CD1a


CD8


CD33


CD34


CD2


CD10


CD4


CD5


CD45


AL-cytoplasmic


TdT


MPO


CD14


CD33


CD34


cytCD79


cytCD22


CD19


cytCD3


CD45


aThese panels are in current clinical use at the Flow Cytometry Lab., Department of Laboratory Medicine, University Health Network, Toronto General Hospital, Toronto, Ontario, Canada.

b Characteristics of fluorochromes are given in Table 2.1.


NORMAL HEMATOPOIESIS

Knowledge of levels and expression patterns of various antigens in normal hematopoietic cells at different stages of development provides a frame of reference for recognition of abnormal differentiation
patterns. Following reports by Terstappen et al.,29,30 and 31 several groups provided descriptions of clearly delineated differentiation stages of various hematopoietic cell lineages.32,33,34,35 and 36,37,38 A detailed review of all available data is beyond the scope of this chapter; a summary of the most important and well-established issues is provided below.


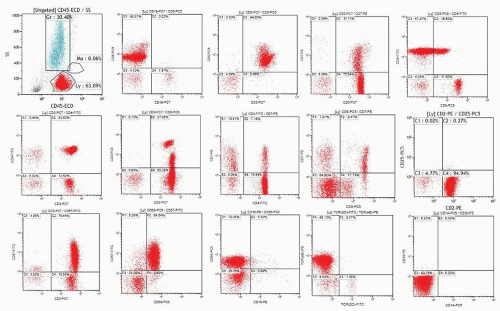
FIGURE 2.4. Example of aberrant T-cell population detected in peripheral blood of a patient with lymphocytosis. Five-color MAb panel and FC500 flow cytometer (Beckman Coulter) were used. Analysis shows that 63% of blood cells were lymphocytes (Ly, red dots on upper left plot). Analysis was performed within lymphocyte gate. Analysis revealed an aberrant population of CD3+ T-cells (75% of lymphocytes) that lack CD7 are positive for CD5 and CD4 with partial co-expression of CD8 (upper row). Small populations of normal CD4+CD7+ and CD8+CD7+ T-cells are also noted (7% and 9% of lymphocytes, respectively, middle row). All T-cells were positive for CD2 and negative for CD25 (left middle row). Further analysis that showed that the aberrant T-cell population was positive for NK-cell-associated antigens CD56 and CD57 (lower row) and had large granular lymphocyte morphology (not shown). MAb to TCR alpha/beta was positive and TCR gamma/delta negative. No expression of CD30 or CD1a was noted (left lower plot).


Immature Cells of Normal Bone Marrow

CD34+ hematopoietic progenitor and precursor cells (HPC) that constitute most cells of the CD45/dim (blast) region are a heterogeneous cell population. A small fraction of pluripotent stem cells with long-term repopulating cell activity have been associated with the CD34/CD38- phenotype.39,40 These cells are very rare in normal BM (usually <0.1%)41, but may increase in regenerating BM and in myelodysplastic syndromes (MDS).42,43 CD34/CD45dim cells also include a major fraction of HPC already committed to different hematopoietic lineages (erythroid, neutrophil, monocytic, dendritic cell (DC), basophil, mast cell (MC), eosinophil, and megakaryocytic) and variable numbers of CD34+ B-cell precursors (BCP).35 Human stem cells are defined by expression of CD90 and CD49f and are CD45RA negative. Early myeloid progenitors were isolated based on the expression of IL-3 receptor, a chain (CD123) or FLT3 (CD135), and CD45RA. Myeloid, but not erythroid, progenitors express CD123 and CD135, and the transition from common myeloid to granulocyte-macrophage progenitor is marked by acquisition of CD45RA [reviewed in Ref. 44].


Granulocytic Differentiation

Several antigens change their expression intensity during maturation of granulopoiesis. Characteristic normal patterns for various antigen combinations have been identified using multicolor analysis.25,36,37,45 Continuous variation in the expression of CD13, CD11b, and CD16 that occurs as the blasts/promyelocytes mature to neutrophils makes the combinations of these antigens very useful in delineating granulocyte maturation (Fig. 2.6). CD13 is expressed at high levels on CD34+ HPCs and CD117+ precursors (promyelocytes). CD13 is then down-regulated and dimly expressed on intermediate precursors (myelocytes) and it is gradually up-regulated again as the granulocytic cells develop into segmented neutrophils. CD11b and CD16 are initially expressed at low levels, but their expression increases during maturation (Fig. 2.6).

Expression of CD33 is particularly useful if followed together with expression of HLA-DR. CD34+ cells are HLA-DR positive and become weakly positive for CD33. With maturation, CD34 disappears and CD33 expression is up-regulated, followed by down-regulation of HLA-DR and slight down-regulation of CD33 in most mature forms.37 CD15 and CD65 appear when cells are restricted to neutrophil differentiation. CD66, CD16, and CD10 are the markers of mature, band, and segmented neutrophil granulocytes and can be applied to evaluate blood contamination of aspirate.46,47 and 48 The sequence of marker expression during neutrophil differentiation is summarized in Table 2.4. It has been confirmed by cell culture studies and sorting experiments.36,49,50


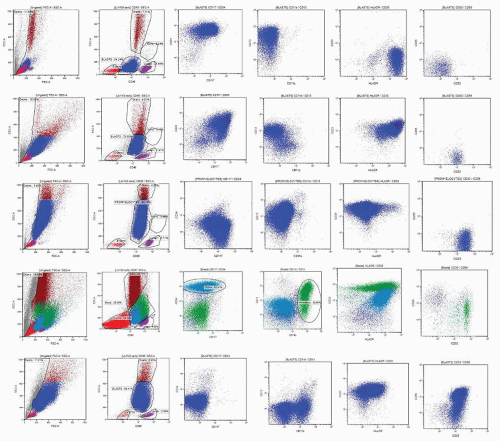
FIGURE 2.5. Examples of various scatter characteristics of CD45 dim blast population and patterns of antigen expression in acute myeloid leukemia. Bone marrow samples were stained with an eight-color MAb panel and acquired on a FACS-CANTOII flow cytometer (BD Bioscience). Panel consisted of CD56-FITC/CD13-PE/CD34 PerCP-Cy5.5/CD117-PE-Cy7/CD33-APC/CD11b APC-Cy7/HLA-DR Pac Blue/CD45 AmCyan. Analysis was performed using Kaluza software (Beckman Coulter). After removal of dead cells and debris, blasts, lymphocytes, monocytes, and granulopoietic precursors/granulocytes were gated on the CD45/SS plot. Further analysis of antigen expression was performed within the blast population (dark blue dots) except for myelomonocytic leukemia (fourth row) where the monocyte gate was added (green dots). The upper row of plots shows an example of AML without differentiation showing agranular blasts, positive for CD34, CD117, CD13, and HLA-DR, but negative for CD33 and CD56. The second row shows an example of AML with granulocytic differentiation as demonstrated by partial expression of CD11b and SS characteristics. Blasts are strongly positive for CD34, CD117, CD13, CD33, and HLA-DR but negative for CD56. The third row shows an example of APL with characteristic high SS and negative CD34, HLA-DR, CD11b, heterogeneous CD13, strong CD33, and no expression of CD56. The fourth row shows an example of myelomonocytic AML where a population of blasts (dark blue) and a population of aberrant monocytes were detected. Blasts were positive for CD34, CD33, CD11b, and HLA-DR but negative for CD117 and CD13. Both blasts and monocytes showed aberrant expression of CD56. The lower row shows an example of monoblastic leukemia, which was negative for CD34, CD117, and CD13 but showed strong expression of CD33 and CD56, dim HLA-DR, and partial expression of CD11b.


Monocytic Differentiation

CD14, CD36, and CD64 are considered as monocyte-associated markers, CD14 being the most specific. During maturation toward promonocytes, progenitors down-regulate CD34 and CD117 and gain the expression of CD64, CD33, HLA-DR, CD36, and CD15, with an initial mild decrease in CD13 and an increase in CD45. Maturation toward mature monocytes leads to a progressive increase in CD14, CD11b, CD13, CD36, and CD45, with a mild decrease in HLA-DR and CD15. Mature monocytes show expression of bright CD14, bright CD33, variably bright CD13, bright CD36 and CD64, and low CD15.36,51


Erythropoietic Differentiation

Early erythropoietic precursors are found in the blast area and can be identified by very bright CD44, bright CD71, intermediate CD36, positivity for HLA-DR, and expression of CD117 with “dim” CD45. Glycophorin A (CD235a) is expressed at a low level at this stage. Maturation to the basophilic erythroblast is accompanied
by a decrease in CD44, disappearance of CD45 and acquisition of bright CD235a expression. At transition to the polychromatophilic/orthochromatophilic stage, erythroblasts show loss of HLA-DR, further decrease in CD44, and a mild decrease in CD36.51,52


FIGURE 2.6. Flow cytometry analysis of maturation in granulopoiesis. Reactive bone marrow samples were stained with an eight-color MAb panel and acquired on a FACS-CANTOII flow cytometer (BD Bioscience). Panel consisted of CD56-FITC/CD13-PE/CD34 PerCP-Cy5.5/CD117-PE-Cy7/CD33-APC/CD11b APC-Cy7/HLA-DR Pac Blue/CD45 AmCyan. Analysis was performed using Kaluza software (Beckman Coulter). Granulopoietic cells and blasts were gated on CD45/SS plot within a live cell gate (upper left). CD34+ cells were gated in a live cell gate and a Boolean gate was created by adding both gates (called granulopoiesis). Expression of CD34 and CD117 showed three populations: CD34+/CD117-CD34+/CD117+ and CD117+/CD34-. The right upper plot shows maturation in granulopoiesis corresponding to promyelocytes (I: CD13+ CD11b-), myelocytes (II: CD13+/dim, CD11b dim), metamyelocytes/bands (III: CD13 dim, CD11bright), and mature neutrophils (IV: CD13bright, CD11b bright). The lower row of plots illustrates the position of these various subsets in other antigen expression plots. All granulopoietic cells were negative for CD56 (not shown).


Lymphocyte Differentiation

The average reported relative frequencies of major lymphoid subsets in various types of tissues are given in Table 2.5. Each laboratory should establish its own ranges.


B-cells

B-cell differentiation in the normal human bone marrow has been extensively studied by several groups that described characteristic patterns of antigen expression on consecutive stages of B-cell precursors (Table 2.6, Fig. 2.7).33,36,53,54,55 and 56 The changes in antigen expression in B-lineage committed cells can be summarized as follows57:


  • CD34+CD10+ Terminal deoxynucleotidyl transferase (TdT)+CD79a+CD19neg common lymphoid progenitor (CLP): early B (E-B) stage.


  • CD34+CD19+CD10+TdT+CD20-cytIgM- pro-B-cell stage.


  • After down-regulation of CD34 and TdT they become CD34-CD19+ CD10+ CD20 heterogenous pre-B that can be further subdivided in I and II subsets.


  • CD34-CD19+CD20+CD10dim/- IgM+ immature (IM)-B-cells.


  • After expression of light chains, cells become CD10-CD19+ CD20+ IgM+ IgD+ mature B-cells.

Pre-B and IM B-cells constitute the majority of B-cells in BM of children, whereas mature B-cells are most frequent in adult BM.33,36

In children with BM regeneration after infection or chemotherapy and in transient hyperplasia of B-cell progenitors, subpopulations of IM and mature B-cells co-expressing CD5 have been identified.58 CD5+ B-cells are the major population of B-cells in fetal life, and their percentage decreases with age.53 Knowledge of antigen expression patterns of B-cell subsets in normal BM is essential for follow-up studies of minimal residual disease (MRD) in patients treated for B-precursor acute lymphoblastic leukemia (ALL).33,59,60


T-cells

T-cell production is maintained throughout life by thymic seeding of BM-derived progenitors. Rare (<0.1%) T-cell-restricted precursors, which express pre-Tα protein on the cell surface and are CD34+CD7+CD45RA+, were identified in human BM.57,61 Recently, it has been suggested that CD34+ CD10+ CD24- progenitors present in both BM and thymus constitute a thymus-seeding population and may replace CD34+ CD7+ CD45RA+ cells in the post-natal period.62 However, frequency of these cells in normal BM is lower than 1/10-4.34 No TdT-positive T-cells expressing cytoplasmic CD3 are found in normal BM.34 Most mature T-cells in the BM co-express CD7, CD5, CD2, and membrane CD3 and are either CD4 or CD8 positive. However, minor subsets of CD7+ cells lacking other “pan-T” antigens, small subsets with co-expression of CD4 and CD8, and a subset lacking CD4 and CD8 have been identified.34 A small population of CD7- T-cells (<10% of T-cells) can also be seen in normal and reactive conditions.63


Minor Bone Marrow Cell Subsets

In healthy donors, eosinophils represent 2% to 3% of blood leukocytes. Numbers of eosinophilic precursors may vary considerably
in reactive BM. Eosinophilic myelocytes can be identified by high side scatter, intermediate CD45 (at a level slightly higher than neutrophilic myelocytes), low to intermediate CD11b, intermediate CD13, and low CD33 with bright CD66b and no CD16 expression. Mature eosinophils show increased levels of CD45 and CD11b with a decrease in CD33 and are negative for CD16.51,64


TABLE 2.4 SURFACE MARKER EXPRESSION DURING MATURATION OF GRANULOPOIETIC PRECURSORS IN THE BONE MARROW


Antigen


Blasts


Promyelocytes


Myelocytes


Metamyelocytes


Bands


Segmented Neutrophils


CD10


+


CD11a


d


d


d


+


+


+


CD11b


d


+


+


b


CD11c


d


d


d


d


CD13


d


+


+


d


d/+


b


CD15


-/+


d/+


+


+


+


+


CD16


d


+


b


CD18


+


+


b


+


+


+


CD24


+


+


+


+


CD33


-/d/+


b


+


d


d


d


CD34


d/+


CD35


d


d


CD44


b


+


d


d


+


b


CD45RA


d


d


CD45RO


d


+


b


CD54


+


+


-/d


-/d


-/d


-/d


CD55


b


+


+


b


b


b


CD59


b


b


b


b


b


b


CD62L


+


+


+


+


+


+


CD64


d


d


+


+


CD65


-/+


d


+


+


b


b


CD66a


+


+


+


+


CD66b


b


b


+


+


+


CD66c


b


b


+


+


+


CD117


d


+


CD133


d


-, Negative; -/+ or (d), partially positive (or dim); d, dim, weakly positive; +, positive; b, bright, strongly positive.


TABLE 2.5 AVERAGE RELATIVE FREQUENCY OF MAJOR LYMPHOID CELL SUBSETS IN NORMAL TISSUES


Subset


Peripheral Blooda Children (%)


Peripheral Blooda Adults (%)


Bone marrowb (%)


Lymph Nodesa (%)


Tonsilsa (%)


Spleena (%)


2-5 Years


5-15 Years


Children


Adults


CD19+ B-cells


24


17


12


10


3


41


51


55


CD3+ T-cells


64


68


72


6


12


56


49


31


CD4+ CD3+ T-helper


37


38


44


3.2


6.5


48


42


17


CD4+CD8+ T-cytotoxic


24


26


24


2.6


4.2


10


6


14


Natural killer (all NK subsets)


10


13


13


2


4


1


<1


15


a Percentage of cells in the lymphocyte region (CD45 bright).

b Percentage of total bone marrow cells.

Only gold members can continue reading. Log In or Register to continue

Stay updated, free articles. Join our Telegram channel

Oct 21, 2016 | Posted by in HEMATOLOGY | Comments Off on Clinical Flow Cytometry

Full access? Get Clinical Tree

Get Clinical Tree app for offline access