This introductory chapter focuses on the general concepts of anemia, the classification of the most common types of anemia, the approach to patients with hemolysis, and the assessment of posthemorrhagic anemia. Anemia rarely is a disease by itself; almost always it is a sign of an acquired or genetic abnormality. The various medical conditions that lead to anemia encompass nearly the full spectrum of human disease.
DEFINITION OF ANEMIA
Red blood cells (RBCs) circulate in the peripheral blood for 100 to 120 days, and approximately 1% of the body’s red cells are lost and replaced each day. Red cells recognized as being old are removed from the circulation by macrophages in the spleen, liver, and bone marrow (Chapter 6). An erythropoietic feedback loop ensures that the total red cell mass remains constant. A reduced RBC mass results from loss of RBCs from the circulation at a rate greater than their production: this may reflect increased RBC clearance, decreased RBC production, or both.
Anemia is functionally defined as an insufficient RBC mass to adequately deliver oxygen to peripheral tissues. For practical purposes, any of the three concentration measurements performed on whole blood can be used to establish the presence of anemia: the hemoglobin (Hb) concentration, typically expressed as grams Hb per deciliter (g/dl) in the United States and as grams per liter in Europe; the hematocrit (Hct; also called the packed cell volume[PCV] or volume of packed red blood cells [vPRC]), which represents the proportion of blood volume represented by RBCs, expressed as a percent or as a decimal; and the RBC concentration in cells per microliter (106/µl) in the United States or per liter (1012/L) by international terminology.
In the past, these parameters were measured using manual physical and chemical techniques. The term “hematocrit” originally referred to the graduated tube in which the vPRC was measured following centrifugation. Now these parameters are determined by electronic cell counters and Hb analyzers (Chapter 1). In most of the current analyzers, RBC concentration, Hb concentration, and mean corpuscular volume (MCV in fl) are directly measured. These measured values are used to calculate the hematocrit (Hct), mean corpuscular Hb (MCH), and mean corpuscular Hb concentration (MCHC):
Most physicians prefer to define anemia using the Hb concentration, although for practical purposes the Hct is comparably reliable. The electronic counters also generate an index of red cell size, the red cell distribution width (RDW). The RDW is a quantitative measure of the variation in red cell size, and the higher the value, the more heterogeneous the RBC population size. The mean normal Hb and Hct values and the lower limits of the normal ranges of these parameters depend on the age and gender of the subjects, as well as their altitude of residence.
Anemia in Adults
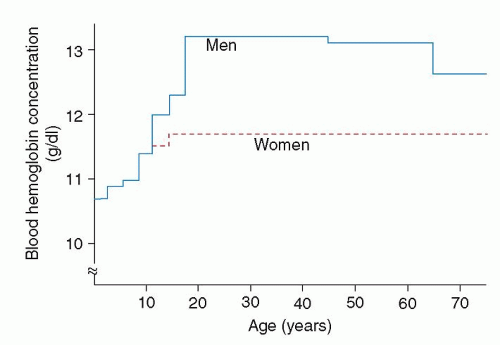
Many references consider Hb concentrations of 14 g/dl and 12 g/dl as the lower limits of normal, at sea level, in adult men and women, respectively, particularly in the industrialized world.2 These values have received wide acceptance and often are used in population surveys.3 However, data from a large, diverse, and carefully selected sample suggest that these values are somewhat high. The sample studied during the second National Health and Nutrition Examination Survey (NHANES II), 1976-1980, was selected statistically as representative of the entire population of the United States.4 Age, gender, and race, as well as geographic and socioeconomic factors, were figured into the selection process. For the purpose of determining normal values, subjects were excluded if they were pregnant, if a hereditary hemoglobinopathy was detected, or if the transferrin saturation, MCV, or erythrocyte protoporphyrin value was abnormal. By these means, iron deficient subjects were effectively excluded. The values of the remaining 11,547 subjects were used to calculate a 95% reference range. In adult subjects (age 10 to 44 years), the lower limit of normal was 13.2 g/dl in men and 11.7 g/dl in women (Fig. 22.1). Values for African-American subjects were approximately 0.5 to 0.6 g/dl lower than those of Caucasian subjects. Consistent with these observations, the World Health Organization (WHO) defines the lower limit of normal for Hb concentration at sea level to be 12.0 g/dl in women and 13.0 g/dl in men.5
FIGURE 22.1. The lower limit of normal blood hemoglobin concentration in men and women of various ages. Values were calculated from a sample of 11,547 subjects selected to represent the population of the United States. Subjects with iron deficiency, pregnancy, or an abnormal hemoglobin value were excluded from the sample. (Data from Dallman PR, Yip R, Johnson C. Prevalence and causes of anemia in the United States, 1976 to 1980. Am J Clin Nutr 1984;39(3):437-445.)
Hemoglobin Values in the Elderly
Anemia is a common condition in the older population. In a community dwelling American population of individuals over 65 years, 8.5% have a Hb concentration meeting the WHO definition of anemia.6 Other investigators have confirmed that the prevalence of anemia rises steadily with age, increasing from approximately 10% in individuals 65 years and older to 20% in individuals over 85 years.7 It is a significant predictor of morbidity, mortality, and performance status in the elderly, whether considered as a general risk factor or in the setting of a specific clinical circumstance, such as heart failure.8,9,10 and 11 While clinical conditions such as iron deficiency, B12 or folate deficiency, the decline in testosterone production in male aging,12 and the impact on EPO production of the routine decline in creatinine clearance with advancing age,8 are likely responsible for a majority of cases, the etiology of a significant proportion of these anemias cannot be readily explained.7 Studies of the development of otherwise unexplained anemia in the aging population have suggested the involvement of a number of possible mechanisms, from an increased incidence of underlying diseases which may be associated with cytokine activation and the anemia of chronic disease,13,14 to changes in the hematopoietic reserve15,16 or even in the characteristics of hematopoietic progenitors themselves.17 Taken together, slightly lower limits of normal Hb concentration may be applicable in evaluating the elderly. However, the too-easy acceptance of mild anemia as a physiologic phenomenon in the elderly runs the risk of ignoring a potentially valuable early clue to an important underlying disorder.
Hemoglobin Values in Infants and Children
At the other extreme of life, the definition of anemia in infancy and childhood is different from that in adults. The lower limit of normal Hb concentration at birth is 14 g/dl, and this decreases to 11 g/dl by 1 year of age. This Hb decrement, referred to as the physiologic anemia of infancy, occurs as part of the normal physiologic adaptation from the relatively hypoxic intrauterine existence to the well-oxygenated extrauterine environment (Chapter 43). Also, as fetal erythropoiesis is replaced, the MCV decreases from birth (100 to 130 fl) to 1 year of age (70 to 85 fl).
Even after the first year of life, normal childhood Hb and MCV values remain considerably lower than those occurring in adolescents and adults (Table 22.1). From the NHANES II study, the lower limit of normal Hb concentration in both male and female children aged 1 to 2 years was 10.7 g/dl, and the value rose with advancing age until adult levels were reached at age 15 to 18 years.
There has been no completely satisfactory explanation for these differences in normal Hb values of children and adults, but it is not due to nutritional deficiencies. Interestingly, it has been demonstrated that serum inorganic phosphate is 50% higher in children compared to adults, and this hyperphosphatemia is associated with elevated erythrocyte adenosine triphosphate and 2,3-diphosphoglycerate content, and thus the erythrocyte oxygen affinity is decreased in children compared to adults. On this basis, it has been postulated that lower Hb values in children may be due to altered Hb-oxygen affinity and may thereby represent a physiologic anemia of childhood.18
At puberty, the Hb concentration in children reaches the same levels seen in adults. The higher Hb levels in males presumably are a reflection of the effects of androgens on erythropoiesis.
Limitations in the Use of Hemoglobin Concentration, Hematocrit, and Red Blood Cell Measurements in Defining Anemia
For practical purposes, the blood Hb and Hct determinations are equally useful in assessing for anemia in most patients, but there are limitations that must be recognized:
Hb and Hct changes may reflect altered plasma volume, not a change in RBC mass (Table 22.2). In pregnancy, for example, the plasma volume increases, thereby decreasing the Hb concentrations, although in fact, total RBC mass actually is increased, but to a lesser degree than the plasma volume.19,20,21,22 Similarly, individuals with massive splenomegaly may have some anemia because of hypersplenism, but the degree of anemia may appear more severe because of an increased plasma volume. Conversely, burn patients lose plasma, not RBC, through the injured skin, leaving Hb and Hct concentrated at a higher level. Other causes of dehydration with depletion of intravascular space also produce a spuriously high Hb concentration. In chronically ill patients with a reduced red cell mass, the magnitude of anemia may be masked by an associated contraction of the plasma volume.23,24,25,26,27
Another consideration is that Hb and Hct changes may reflect underlying physiologic conditions with different oxygen needs. For example, chronically hypoxemic subjects, such as individuals who live at high altitudes or patients with a rightto-left cardiac shunt, are typically polycythemic with elevated Hb/Hct levels. A normal Hb/Hct level in such a patient actually may represent anemia by the functional criterion of adequately meeting tissue oxygen requirements.
TABLE 22.1 RED BLOOD CELL CHARACTERISTICS IN CHILDHOOD
Age
Lowest Normal Hb (g/dl)
Normal Red Blood Cell Size Mean Corpuscular Volume (fl)
Fetal Hb (%)
Birth
14.0
100-130
55-90
1 mo
12.0
90-110
50-80
2 mo
10.5
80-100
30-55
3-6 mo
10.5
75-90
5-25
6 mo-1 y
11.0
70-85
<5
1-4 y
11.0
70-85
<2
4 y-puberty
11.5
75-90
<2
Adult female
12.0
80-95
<2
Adult male
14.0
80-95
<2
Hb, hemoglobin.
TABLE 22.2 CONDITIONS ASSOCIATED WITH DISCORDANCE BETWEEN HEMOGLOBIN CONCENTRATION AND RED CELL MASS
Increase in plasma volume relative to RBC mass (Hb disproportionately low)
Hydremia of pregnancy
Congestive splenomegaly
Recumbency (vs. upright)
Decrease in plasma volume relative to RBC mass (Hb high, normal, or low; but high relative to RBC mass)
Dehydration
Protracted diarrhea (especially in infants)
Peritoneal dialysis with hypertonic solutions
Diabetic acidosis
Diabetes insipidus with restricted fluid intake
Burn patients
Stress erythrocytosis, spurious polycythemia
Decrease in plasma volume and RBC mass (Hb normal, RBC mass low)
Acute blood loss
Chronic disease
Hb, hemoglobin; RBC, red blood cell.
Some abnormal Hb variants have an altered ability to bind and release oxygen, and this can be associated with changes in Hb concentration. For example, Hb Yakima has increased oxygen affinity with a low P50, and higher than normal Hgb levels are characteristic. Conversely, Hb Kansas has decreased oxygen affinity, high P50, and lower than normal Hgb levels. Despite the disparate Hb levels in these cases, both satisfy the criteria of appropriate oxygen delivery for tissue oxygen needs.
Acute blood loss is another example of the problem of denoting anemia by the Hb concentration or Hct. Immediately after loss of a liter of blood, the Hb concentration/Hct is normal, because the initial response to acute hemorrhage is vasoconstriction. The shift of fluid from extravascular to intravascular space, and thus the decrease in Hb concentration, does not begin for 6 hours, and can continue for 48 to 72 hours. Reticulocytosis occurs after 24 to 48 hours.
Impaired partial synthesis of one globin chain, as in thalassemia trait, may be reflected in a low Hb (10 g/dl) and a high RBC count (6.5 million/µl), thus giving anemia by one measure (Hb) and erythrocytosis by another (RBC). This is largely why the RBC count is the least reliable and least commonly used indicator of anemia.
In addition to the issues listed above, changes in posture also have effects on red cell concentration that can influence Hb and Hct measurements. When normal individuals assume a recumbent position, the Hct falls an average 7% (range, 4% to 10%) within 1 hour.28 When the upright position is resumed, the Hct increases by a similar amount within 15 minutes. These changes have been attributed to alterations in plasma volume as fluid moves between the circulation and the extravascular spaces in the lower limbs as a result of hydrostatic forces.
CLINICAL EFFECTS OF ANEMIA
Patients with anemia usually seek medical attention because of decreased work or exercise tolerance, shortness of breath, palpitations, or other signs of cardiorespiratory adjustments to anemia. At times, they feel fine, but their friends or family may note pallor. It is not uncommon that anemia in a child is first recognized by a visiting relative, the process sometimes occurring so slowly as to not be noted by parents or other immediate family members.
Cardiovascular and Pulmonary Features of Anemia
The clinical manifestations of anemia depend on the magnitude and rate of reduction in the oxygen carrying capacity of the blood, the capacity of the cardiovascular and pulmonary systems to compensate for the anemia, and the associated features of the underlying disorder that resulted in the development of anemia. The Hb concentration is not the only determinant of the observed symptoms. Coexistent cardiovascular or pulmonary disease, particularly in older individuals, may exaggerate the symptoms associated with a degree of anemia that would be well tolerated under other circumstances.
If the anemia has been insidious in onset and there is no cardiopulmonary disease, the patient’s adjustment may be so effective that the blood Hb concentration may fall to 8 g/dl or even lower before the patient experiences enough symptoms to appreciate the situation.29 In cases of iron deficiency anemia, pernicious anemia, or other types of slowly developing anemia, Hb concentrations may reach levels of 6 g/dl or lower before patients are motivated to seek medical attention.30 This is particularly true in children where no limitations of physical activity may be apparent despite the existence of very severe anemia.31 The physiologic adjustments that take place with a slowly falling red cell mass chiefly involve the cardiovascular system and changes in the Hb-oxygen dissociation curve.
In many patients, respiratory and circulatory symptoms are noticeable only after exertion; however, when anemia is sufficiently severe, dyspnea and awareness of vigorous or rapid heart action may be noted even at rest. When anemia develops rapidly, shortness of breath, tachycardia, dizziness or faintness (particularly upon arising from a sitting or recumbent posture), and extreme fatigue are prominent. In chronic anemia, only moderate dyspnea or palpitation may occur, but in some patients, congestive heart failure,32 angina pectoris, or intermittent claudication33 can be the presenting manifestation. In patients with severe chronic anemia, tachycardia and postural hypotension may not be present because the total blood volume actually may be increased because of an expanded plasma volume. In the elderly particularly, cardiovascular adaptation to anemia is predominantly by increasing stroke volume, rather than by heart rate.34 It is in these cases that rapid administration of a blood transfusion may precipitate congestive heart failure by aggravating an already expanded blood volume. Concern about this possibility should not preclude expansion of the blood’s oxygen carrying capacity by transfusion if necessary; rather the judicious use of diuretics in the peritransfusion period should be considered in patients with clinical signs of volume overload.
Heart murmurs are a common cardiac sign associated with anemia. They usually are systolic in time and best heard in the pulmonic area.35,36,37 Often, they are moderate in intensity, and at times may be rough in quality and raise suspicion of organic valvular heart disease. In a study from Bosnia, 25% of the heart murmurs investigated in a pediatric cardiology clinic were attributable to anemia and resolved with its correction.38
Pallor
Pallor is a sign of anemia, but many factors other than Hb concentration affect skin color. These include the degree of dilation of peripheral vessels, the degree of pigmentation, and the fluid content of the subcutaneous tissues. Certain people routinely have pale-appearing skin without being anemic. Patients with myxedema may manifest pallor without anemia. In simple vasovagal syncope, pallor results from cutaneous vasoconstriction and is not a sign of anemia. Jaundice, cyanosis, racial skin pigmentation, and dilation of the peripheral vessels all can mask the pallor of anemia.
The pallor associated with anemia is best detected in the mucous membranes of the mouth and pharynx, the conjunctivae, the lips, and the nail beds. In the hands, the skin of the palms first becomes pale, but the creases may retain their usual pink color until the Hb concentration is less than 7 g/dl.
A distinctly sallow color implies chronic anemia. A lemonyellow pallor suggests pernicious anemia, but it is observed only when the condition is well advanced. Definite pallor associated with mild scleral and cutaneous icterus suggests hemolytic anemia. Marked pallor associated with petechiae or ecchymoses suggests more generalized bone marrow failure due to acute leukemia, aplasia, or myelodysplastic syndromes.
Skin and Mucosal Changes
Other changes in the integument occur with anemia. Thinning, loss of luster, and early graying of the hair may occur, the last especially in patients with pernicious anemia, in whom it may precede the development of anemia. The nails may lose their luster, become brittle, and break easily. This finding is especially noticeable in chronic iron deficiency anemia,39 in which the nails may actually become concave instead of convex. Chronic leg ulcers may occur, especially in patients with sickle cell anemia and rarely in those with other hemolytic anemias. Glossitis occurs in association with pernicious anemia. When nutritional deficiency is associated with anemia, symmetric dermatitis may develop, fissures may be present at the angles of the mouth, glossitis may occur, and erythematous lesions on the face, neck, hands, or elbows may be found.
Neuromuscular Features
Headache, vertigo, tinnitus, faintness, scotomata, lack of mental concentration, drowsiness, restlessness, and muscular weakness are common symptoms of severe anemia. Paresthesias are common in pernicious anemia and may be associated with other symptoms and signs of peripheral neuropathy, and more especially with combined system disease.
Ophthalmologic Findings
A variety of ophthalmologic findings have been observed in anemic patients.40,41,42 Approximately 20% of such patients have flame-shaped hemorrhages, hard exudates, cottonwood spots, or venous tortuousness affecting the retina. The hemorrhages occur even in the absence of coexisting thrombocytopenia. Papilledema related solely to anemia has been described,43,44 and it clears when the anemia disappears.
Gastrointestinal Changes
Gastrointestinal symptoms are common in anemic patients. Some are manifestations of the underlying disorder (e.g., hiatal hernia, duodenal ulcer, or gastric carcinoma); others may be a consequence of the anemic condition, whatever its cause. Glossitis and atrophy of the papillae of the tongue commonly occur in pernicious anemia and less often in iron deficiency anemia. Painful, ulcerative, and necrotic lesions in the mouth and pharynx occur in aplastic anemia and in acute leukemia, usually reflecting the neutropenia accompanying these conditions. Dysphagia may occur in chronic iron deficiency anemia.
EVALUATION AND CLASSIFICATION OF ANEMIA
History and Physical Examination
All aspects of the history and clinical examination are important. The duration of the symptoms and their onset, whether insidious or acute, should be established. It is very helpful to know the most recent date at which a routine hematologic examination was normal.
The family history is most useful for increasing suspicion of hereditary hemolytic diseases (including hemoglobinopathies) and hereditary bleeding disorders (including hereditary vascular abnormalities like hereditary hemorrhagic telangiectasias). Key clues are histories of bleeding, jaundice, gallstones, and splenectomy (see Approach to Hemolysis).
The patient’s occupation, household customs, and hobbies must be ascertained because certain drugs, solvents, and other chemicals may produce hemolytic anemia or aplastic anemia, as well as granulocytopenia and thrombocytopenia. Also, social habits (alcohol use), travel history (to malarious or other infectious areas), and drug history are all important in ascertaining the underlying etiology.
The dietary history is critical to the analysis, and questions regarding the diet must be specific in the hope of obtaining quantitative information. In very young children, those who obtain the bulk of their nutrition from cow’s milk (good for calories, very low in iron) are at great risk for iron deficiency anemia. Changes in weight are most important in both adults and children. Formerly obese individuals who have undergone bariatric surgery and other individuals who have undergone gastric resection are at risk for anemia from iron, copper, and other nutrient deficiencies.45
The patient should be questioned about early graying of the hair, burning sensations of the tongue, skin changes, sores about the angles of the mouth, and discomfort and brittleness of the fingernails, which are symptoms of anemias caused by deficiency of specific nutrients.
Change in stool habits may be an important clue to neoplasms of the colon and rectum underlying the anemia. The significance of tarry stools often is not appreciated by patients, and specific inquiry is necessary. The amount of blood lost from hemorrhoids may be overlooked or overestimated. In men, occult blood loss most often is from the gastrointestinal tract.
In women, additional important information includes an appraisal of the amount of blood lost during menstruation. Data about number of pads or tampons used and the presence or absence of clots should be obtained. The average amount of blood lost per period is approximately 50 ml, representing roughly 25 mg of elemental iron. Menstrual flow should be deemed excessive if more than 12 pads are used each period, if clots are passed after the first day, or if the period duration exceeds 7 days. The number of pregnancies and abortions and the interval since the most recent of these are also important, for each represents significant iron loss.
The presence or absence of fever must be known; its presence suggests infection, lymphoma, other neoplasm, or collagen vascular disease. Pains in the limbs, paresthesias, and difficulty in walking suggest pernicious anemia. Abnormal color of the urine, suggesting blood or Hb, may signify urinary tract disease or hematologic problems. Bilirubin is not detected in the urine of people with uncomplicated hemolytic anemia (“acholuric jaundice”), but a darker than normal color may result from the increased excretion of urobilinogen and its conversion to urobilin.
Bruises, ecchymoses, and petechiae are other important points in the history. Their presence indicates that the disorder producing anemia may also involve platelets or the liver. Alternatively, the anemia itself may be the consequence of blood loss resulting from a disorder of hemostasis.
In all instances, the presence or absence of symptoms suggestive of an underlying disease such as chronic renal disease, liver disease, chronic infection, endocrinopathy, or malignancy must be explored. Anemia can be the presenting feature of many of these disorders.
The physical examination can provide further clues to the cause of anemia. Scleral icterus suggests the presence of hemolytic anemia or ineffective erythropoiesis. Sternal tenderness near the middle or lower third of the sternum, of which the patient may have been unaware, may represent acute expansion of hematopoietic marrow and can be a useful sign in some patients with acute leukemia. Palpation of the liver and spleen and a systemic check for lymphadenopathy can provide clues to infection, lymphoma, leukemia, or metastatic carcinoma.
The initial patient evaluation should include a urinalysis. Even when the color of the urine does not suggest blood, the routine urinalysis should be tested for occult blood. A positive reaction may be due to hematuria, hemoglobinuria, or even myoglobinuria. Hematuria may be differentiated from the other conditions by finding RBCs on microscopic examination of the urine, or by centrifuging a fresh urine specimen, thereby clearing the bloody color from the supernatant and depositing the RBCs in the bottom of the tube. Hematuria reflects disease of the kidneys or urinary tract. Sickle cell trait may be accompanied by innocuous hematuria. Hemoglobinuria implies intravascular hemolysis. The significance of urobilinogen has been noted above.
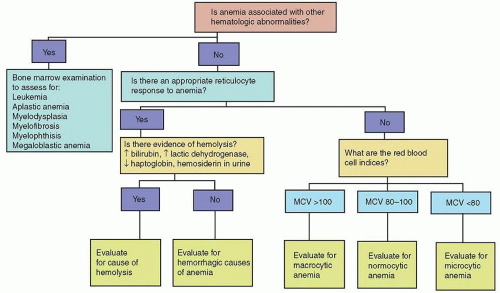
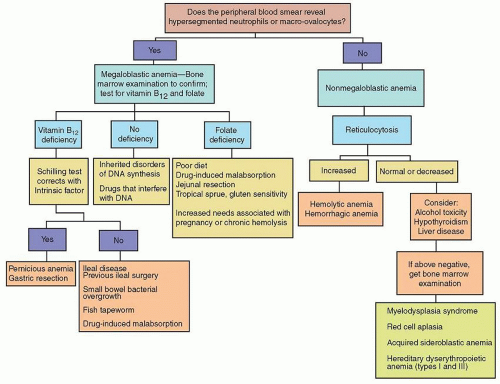
FIGURE 22.2. Questions to ask in the initial evaluation of anemia. MCV, mean corpuscular volume (fl); ↑, increased; ↓, decreased.
Evaluation of Basic Hematology Laboratory Data
To identify the cause of anemia, information from the medical history and physical examination must be integrated with some key laboratory tests. There is no one simple classification of anemia. A useful approach entails asking several questions, outlined in the following sections (Fig. 22.2).
Is Anemia Associated with Other Hematologic Abnormalities?
Specifically, is the anemia associated with thrombocytopenia or abnormalities in white blood cell numbers or the presence of abnormal leukocytes? If the answer to this question is yes, consideration must be given to the possibility of bone marrow failure due to aplastic anemia, leukemia, or other malignant marrow disease. Alternatively, pancytopenia can be secondary to peripheral destruction or sequestration of cells as in hypersplenism. In most cases, these disorders can be differentiated by careful review of screening hematologic studies and close attention to the medical history and physical examination.
Is There an Appropriate Reticulocyte Response to Anemia?
The number of erythrocytes in the circulation at a given time is the result of a dynamic equilibrium between the delivery of red cells into the circulation on the one hand and their destruction or loss from the circulation on the other. Each day, approximately 1% of the RBC pool is replaced by young erythrocytes released from the marrow. The homeostatic mechanisms of the body bring about recovery from anemia by accelerating erythropoiesis, and this response of the normal marrow is brought about through the release of erythropoietin. At maximum stimulation, the bone marrow is capable of producing erythrocytes at six to eight times the normal rate.
The reticulocyte count provides an initial assessment of whether the cause of anemia is due to impaired RBC production or to increased loss in the peripheral circulation (e.g., blood loss, hemolysis) (Fig. 22.2). The reticulocyte count is traditionally measured by microscopic examination of a smear prepared from fresh blood stained with a supravital stain, such as new methylene blue. The normal reticulocyte count by light microscopy is 0.5% to 1.5% of the total red cells. More recently, automated methods based on flow cytometry have become widely utilized. The automated methods count a larger number of cells, and exhibit a greater degree of reproducibility.46
In the presence of anemia, the reticulocyte count must be corrected because it is spuriously elevated when it is related to the reduced number of RBC in an anemic patient. An additional correction of this index needs to be made because reticulocytes released under intense erythropoietin stimulation remain in the peripheral blood for more than the usual 1-day survival time of nonstress reticulocytes. There are a number of ways to adjust the reticulocyte count for the degree of anemia (Table 22.3). While all of these methods have value, the absolute reticulocyte count is traditionally the easiest to estimate.
Automated reticulocyte counting also allows the evaluation of other parameters, such as reticulocyte hemoglobin content (CHr) and the proportion of immature reticulocytes (immature reticulocyte fraction, IRF). Availability of these methods depends on the particular cell counting equipment. A CHr < 28 pg suggests iron deficiency,47 while a reduced IRF (<0.23) suggests underproduction.48 The degree to which the IRF adds to information provided by any of the adjusted reticulocyte parameters is unclear.
If Anemia Is Associated with Reticulocytosis, Is There Any Evidence for Hemolysis?
The most characteristic presentation of hemolysis is reticulocytosis with some degree of hyperbilirubinemia as a marker of increased heme catabolism. Other markers reflect direct red cell injury (e.g., increased serum lactic dehydrogenase) or increased excretion of Hb (e.g., low serum haptoglobin, hemoglobinemia, hemoglobinuria, and increased urinary hemosiderin). The evaluation and diagnostic considerations related to hemolytic anemia are complex and are considered separately elsewhere in this chapter (see Approach to Hemolysis).
TABLE 22.3 METHODS OF CORRECTING THE RETICULOCYTE COUNT FOR THE DEGREE OF ANEMIA
Reticulocyte count = % reticulocytes in red blood cell (RBC) population
(Normal values for the absolute reticulocyte count are from 25 to 75 × 109/L; values < 100 × 109/L indicate an inappropriately low erythropoietic response to anemia.)
a Reticulocyte maturation time = 1 day for Hct ≥ 40%; 1.5 days for Hct 30-40%; 2.0 days for Hct 20-30%; 2.5 days for Hct < 20%.
Data from Hillman RS, Finch CA. Red cell manual, 5th ed. Philadelphia, PA: FA Davis, 1985.
If Anemia Is Associated with a Less Than Appropriate Reticulocyte Response, What Are the Red Cell Indices?
Anemia with low reticulocytes usually reflects some impairment of normal erythropoiesis, and this can be due to two kinds of defects. Erythropoiesis may be impaired because of a reduction in red cell precursors (hypogenerative). Alternatively, red cell production may be ineffective, a condition characterized by erythroid hyperplasia in the bone marrow, but with the production of essentially nonviable red cells, most of which do not reach circulation.
There are numerous causes of anemia with low reticulocyte counts, and it is in this group that analysis of RBC indices is most helpful. Of these, the MCV tends to be the single most useful measurement,49,50,51 although some clinicians prefer to use the MCH.52 The MCV and MCH almost always correlate closely.53,54
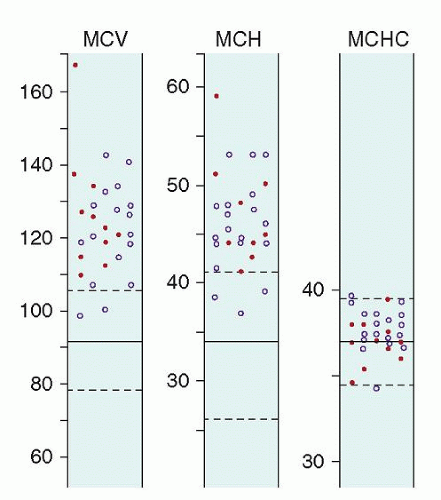
An initial step in classification of anemias with low reticulocyte counts separates them into three groups on the basis of average cell size: the macrocytic, microcytic, and normocytic anemias (Fig. 22.2). Anemia is classified as macrocytic if MCV exceeds 100 fl. Usually, the MCH is also increased, whereas the MCHC remains within normal limits (Fig. 22.3). Microcytic anemia is identified when the MCV is less than 80 fl in adults. The anemia is normocytic when the indices are within normal limits, with an MCV between 80 and 100 fl. In children, MCV values vary as a function of age, and, correspondingly, the definition of microcytic, normocytic, and macrocytic differ accordingly (Table 22.1). As a practical matter for those who take care of children, it is important to know the age-related differences in RBC size, because many laboratory reports contain only adult normal values, often signaling the child’s age appropriate hematologic values as abnormal.
The MCHC is useful in detecting severe hypochromia, but it is rarely abnormal when the MCV is normal.51,52,53,54,55,56 A reduced value for MCHC is observed most often in association with iron deficiency, and this index tends to be the last to fall as iron deficiency worsens.57,58,59 The changes in MCHC with iron deficiency were seen more frequently in the past when centrifugal methods were used to determine the Hct before the availability of electronic cell counting. Because of plasma trapping, centrifugal Hct methods overestimate the volume of packed red cells and, therefore, underestimate MCHC. Plasma trapping increases from 1% to 3% with normal blood to as much as 6% in iron deficiency, a consequence of anisocytosis and reduced cell deformability.60
FIGURE 22.3. Erythrocyte indices in 28 patients with untreated or relapsed pernicious anemia. Dashed lines enclose the 95% confidence limits in normal subjects. Solid dots indicate males; open circles indicate females. MCH, mean corpuscular hemoglobin; MCHC, mean corpuscular hemoglobin concentration; MCV, mean corpuscular volume. (From Hallberg L. Blood volume, hemolysis and regeneration of blood in pernicious anemia. Scand J Clin Lab Invest 1955;7(Suppl 16):1-127, with permission.)
Is the Anemia Associated with a Low Reticulocyte Response and Microcytic Red Blood Cells?
The large majority of patients in this category have defects in cellular Hb synthesis due to either iron deficiency, thalassemia trait, or Hb E syndromes (see Approach to Microcytic Anemia).
Is the Anemia Associated with a Low Reticulocyte Response and Macrocytic Red Blood Cells?
In these patients, the anemia is characterized by reticulocytopenia with red cells having an increased MCV. Many of these disorders are due to megaloblastic anemia resulting in impaired nuclear development, and the formation of other blood cells is also affected (see Approach to Macrocytic Anemia).
Is the Anemia Associated with a Low Reticulocyte Response and Normocytic Red Blood Cells?
Normocytic anemia, low reticulocyte count, and normal bilirubin levels characterize a large number of anemias. The anemia of chronic disease usually is normocytic, although rarely may be slightly microcytic. In these cases, there usually is clinical evidence of a syndrome associated with cytokine activation. The anemia of renal failure is normocytic and largely is due to reduced erythropoietin production. Acquired pure red cell aplasia (PRCA) is a normocytic anemia, which occurs in adults and children (see Approach to Normocytic Anemia).
Is the Anemia Associated with Populations of Red Cells of Different Size?
The red cell indices represent mean values and do not reveal any variation that may exist within a population of cells. The MCV can be normal if there are combined abnormalities, such as when iron deficiency (decreased MCV) is accompanied by a megaloblastic anemia (increased MCV). For these purposes, it is important to examine the peripheral blood smear. Also, the electronically derived RDW allows for recognition of these phenomena because it quantifies the degree of heterogeneity of RBC size (i.e., anisocytosis) in a population of cells, and this has proven to be of value.49,61 The upper limit of normal values for RDW is 14.6%.43 An increased RDW value is an early and pronounced finding in iron deficiency and most megaloblastic anemias; no differences from normal are seen in heterozygous thalassemia. In iron deficiency, the RDW value may become abnormal even before the MCV falls below the lower limits of normal.
Is the Anemia Associated with Abnormalities Seen on the Blood Smear?
Despite the technical advances provided by current electronic complete blood cell count (CBC) measurements, review of the peripheral blood smear remains a critical aspect of the diagnostic evaluation for anemia. It confirms the electronically determined classification of RBC size. Most important, it also allows for recognition of the many variations in RBC size and shape that frequently are seen in patients with hemolysis.
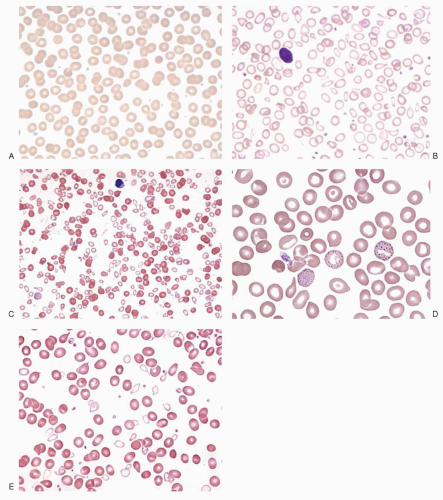
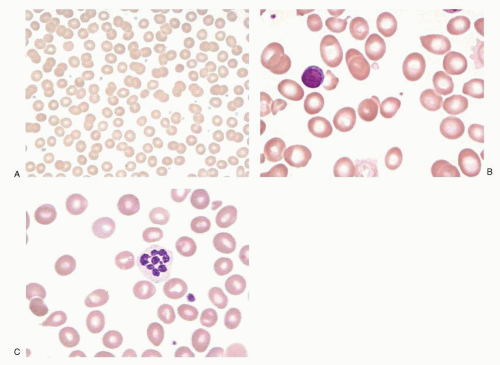
Microcytes and macrocytes can be detected on the blood smear on the basis of a change in red cell diameter. Normal red cells approximate the size of the nucleus of a small lymphocyte, and the area of central pallor is one-third to one-half of the diameter of the red cell (Fig. 22.4A). An increase in the area of central pallor of erythrocytes on the blood smear is indicative of hypochromia, and when the change is pronounced, little more than a faint ring of color in the periphery may be apparent (Fig. 22.4B). Hypochromia and microcytosis almost always occur together.
The automated analysis of the blood has made the erythrocyte indices more accurate and reproducible.62 However, the evaluation of the blood smear still remains important because it may reveal abnormal cell populations too small to affect the erythrocyte indices. For example, as iron deficiency develops, some microcytic cells are produced while the RBC indices are still normal. Furthermore, as B12 deficiency progresses, some characteristic oval macrocytes and hypersegmented neutrophils may appear long before there are MCV or Hb changes (Fig. 22.5B,C). Moreover, examination of the smear is important for detecting conditions characterized by two populations of cells, only one of which is of abnormal size. This dimorphic anemia is particularly characteristic of sideroblastic anemias (Fig. 22.4E). It also is seen in iron deficiency after iron therapy is started (Fig. 22.4C), and in iron deficient individuals who have been transfused.
Review of the blood smear may reveal underlying causes of the anemia. A leukoerythroblastic picture (teardrop RBC, nucleated RBC, early white blood cell precursors, or abnormalities in platelet shape) suggests marrow infiltration by hematologic or other malignant cells (Fig. 22.6). The marked elevation in serum proteins in multiple myeloma may result in a stacking of RBCs in rouleaux formation. The appearance of RBC in agglutinates (as opposed to their stacking into rouleaux) is seen with cold agglutinin disease. Also, probably one of the most valuable outcomes of reviewing the blood smear is that it often reveals abnormal red cell shapes characteristic of certain hemolytic anemias in particular.
Is a Bone Marrow Examination Needed to Clarify the Cause of Anemia?
Examination of the bone marrow is most useful in reticulocytopenic anemias, particularly when there is more than one hematopoietic cell line affected. Both hypoplasia and marrow infiltrative disease due to leukemia, tumor, or granulomas (myelophthisic anemia) may readily be demonstrated in the bone marrow aspirate and biopsy. Myelofibrosis can be recognized as a component of myeloid metaplasia. If the marrow is normocellular except for reduced erythropoiesis, the underlying cause may be red cell aplasia, renal disease, or endocrinopathy.
Examination of iron in bone marrow macrophages was traditionally considered the definitive way to demonstrate decreased iron stores. In most cases, however, the diagnosis of iron deficiency can be made by simple blood tests, thus obviating the need for an iron stain of the bone marrow. On the other hand, to make the diagnosis of sideroblastic anemia, a bone marrow examination is necessary to identify ringed sideroblasts. Megaloblastic anemias usually can be recognized by peripheral blood findings, but a marrow examination will confirm the diagnosis.
In some anemias with low reticulocyte counts, marrow erythropoiesis surprisingly is quite active. This is referred to as ineffective erythropoiesis, and it occurs when developing red cells are defective and are destroyed before they leave the marrow or shortly thereafter. A very small fraction of erythropoiesis is ineffective, even in normal subjects; however, in certain conditions, especially megaloblastic anemias, thalassemias, sideroblastic anemias, and congenital dyserythropoietic anemias, ineffective erythropoiesis becomes greatly exaggerated. The increased intramedullary destruction of erythroblasts in these conditions is associated with accelerated heme catabolism, resulting in an elevated unconjugated bilirubin level in the plasma. Also, the serum lactic dehydrogenase level, a marker of cell destruction, is markedly elevated. Ineffective erythropoiesis can be confused with hemolytic anemia because signs of excessive red cell destruction and erythroid hyperplasia of the bone marrow are found in both conditions. However, the two conditions are distinguished from one another by the degree of reticulocytosis, which is increased in hemolytic anemia and usually low in ineffective erythropoiesis.
FIGURE 22.4. Peripheral blood smear of erythrocytes in a variety of hypochromic, microcytic anemia. A: Normal red cells. B: Iron deficiency anemia. Note the large area of central pallor. C: Dimorphic population of cells in iron deficiency anemia responding to treatment. D: Thalassemia minor. The cells are thin and appear pale but nearly normal in diameter. Note the basophilic stippling in several RBC: Sideroblastic anemia. A hypochromic, microcytic population of cells is mixed with relatively normocytic red blood cell. Part C from Tkachuk DC, Hirschmann JV] in Wintrobe’s atlas of clinical hematology. Philadelphia, PA: Lippincott Williams & Wilkins, 2007. Part D from Pierira I, George TI, Arber DA in Atlas of peripheral blood. Philadelphia, PA: Lippincott Williams & Wilkins, 2012 and Tkachuk DC, Hirschmann JV in Wintrobe’s atlas of clinical hematology. Philadelphia, PA: Lippincott Williams & Wilkins, 2007.
APPROACH TO MACROCYTIC ANEMIA
Macrocytosis is a common finding in clinical settings. In 1.7% to 3.6% of cases involving patients seeking medical care, MCV is increased, often in the absence of anemia.63,64,65,66,67,68 Mild macrocytosis (MCV of 100 to 110 fl) is particularly common and often remains unexplained, even after careful study.63 Even so, this finding should not be ignored, because it can be an important early clue to reversible disease. For example, it may appear 1 year or more before anemia develops in patients with pernicious anemia, and neurologic disease can progress during that interval.69
Morphologic and biochemical criteria allow macrocytic anemias to be divided into two groups: the megaloblastic anemias and the nonmegaloblastic macrocytic anemias. The types of macrocytic anemias clinicians encounter vary considerably depending on the population served. If alcoholism is common in the population, it is likely to be the most common cause. In cancer patients, high MCVs are most likely due to chemotherapy. In hospitals largely serving the elderly, pernicious anemia and other nutritional anemias may predominate.68
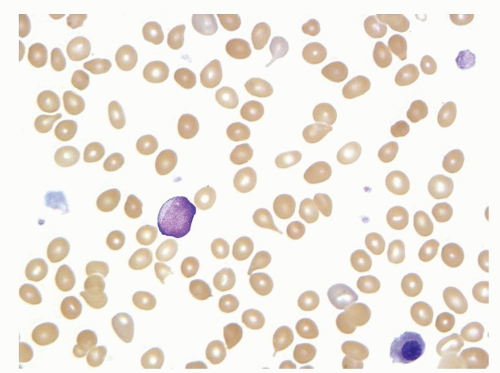
FIGURE 22.5. Megaloblastic anemia. A: Normal red cells. B: Macroovalocytes in pernicious anemia. From Pierira I, George TI, Arber DA in Atlas of peripheral blood. Philadelphia, PA: Lippincott Williams & Wilkins, 2012. C: Hypersegmented neutrophils seen in patient with megaloblastic anemia.
When confronted with a diagnostic problem involving macrocytic anemia, the physician should first distinguish between megaloblastic and nonmegaloblastic anemia (Fig. 22.7). The most useful steps for this purpose are morphologic examinations.
FIGURE 22.6. Peripheral blood smear. A leukoerythroblastic response seen in patient with metastatic breast cancer. From Pierira I, George TI, Arber DA in Atlas of peripheral blood. Philadelphia, PA: Lippincott Williams & Wilkins, 2012.
Megaloblastic Anemias
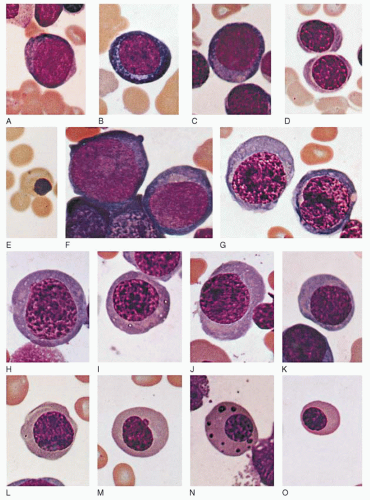
The term megaloblast is a designation that was first applied by Ehrlich to the abnormal erythrocyte precursors found in the bone marrow of patients with pernicious anemia. Megaloblasts are characterized by their large size and by specific alterations in the appearance of their nuclear chromatin (Fig. 22.8). These distinctive cells are now known to be the morphologic expression of a biochemical abnormality: retarded DNA synthesis.70 RNA synthesis remains unimpaired while cell division is restricted.71,72 As a result, cytoplasmic components, especially Hb, are synthesized in excessive amounts during the delay between cell divisions. An enlarged cell is the product of such a process. Megaloblastic anemias are defined by the presence of these cells or by other evidence of defective DNA synthesis.
A pathogenetic classification of the causes of megaloblastic anemias is presented in Table 22.4. Most often, megaloblastic anemia is the consequence of deficiency of vitamin B12 or folate, or both. Less commonly, megaloblastic anemia results from inherited or drug-induced disorders of DNA synthesis.
Hematologic Features of Megaloblastic Anemia
Examination of the blood smear often reveals the two most valuable findings for differentiating megaloblastic from nonmegaloblastic anemia: neutrophil hypersegmentation and oval macrocytes.
Neutrophil hypersegmentation is one of the most sensitive and specific signs of megaloblastic anemia (Fig. 22.5C). Normally, the nuclei of circulating, segmented neutrophils have fewer than five lobes. In megaloblastic anemia, neutrophils with six or more lobes may be detected. In a large study, more than 98% of patients with megaloblastic anemia had at least one six-lobed neutrophil of the 100 cells examined, as compared with only 2% of normal control subjects.73 Hypersegmentation is among the first hematologic abnormalities to appear as the megaloblastic state develops.74 It persists for an average of 14 days after institution of specific therapy.75
FIGURE 22.7. Diagnostic approach to a patient with macrocytic anemia.
The main products of megaloblastic erythropoiesis are macrocytic erythrocytes with a distinctly oval shape. Such cells are well filled with Hb, and often central pallor is reduced or absent (Fig. 22.5B). The oval shape may be useful in distinguishing megaloblastic anemias from other causes of macrocytosis; the macroreticulocytes that characterize accelerated erythropoiesis tend to be round and distinctly blue or gray in Romanowsky dyes.
Although oval macrocytes are prominent in megaloblastic anemia, the size and shape of the erythrocytes may vary considerably. Quantitative measures of anisocytosis, such as the RDW, are substantially increased, and the increase may precede the development of anemia.76 Morphologic changes on the blood smear, however, are most conspicuous when anemia is pronounced.
Megaloblastic anemias usually develop gradually, and the degree of anemia is often severe when first detected. Hb values less than 7 or 8 g/dl are not unusual. Macrocytosis characteristically precedes the development of anemia69,77,78 and may even do so by several years. The MCV usually is between 110 and 130 fl.
Bone Marrow
A megaloblastic marrow is cellular and usually hyperplastic, with erythrocyte precursors predominating. The characteristic megaloblasts are distinguished by their large size and especially by their delicate nuclear chromatin. The chromatin has been described as particulate or sieve-like, as distinguished from the normal denser chromatin of normoblasts (Fig. 22.8). This morphologic change may be detected at all stages of erythrocyte development; however, the identification of orthochromatic megaloblasts is particularly useful in the recognition of megaloblastic anemia because they differ so markedly from any cell found in normal marrow. In the orthochromatic megaloblast, the abundant cytoplasm appears mature (pink), whereas the nucleus appears immature as a result of the megaloblastic change.
Leukopoiesis is also abnormal; extraordinarily large (up to 20 or 30 µm) leukocytes are found. These abnormalities of cellular development may occur at any stage in the myeloid series, but they are particularly common among the metamyelocytes. The nucleus of these giant metamyelocytes is enlarged, both absolutely and in relation to the total cell size; it may be bizarre in shape and in chromatin structure or staining properties.
In general, megakaryopoiesis is less disturbed than that of either of the other two cell lines; however, when megaloblastic change is severe, megakaryocytes may be reduced in number and abnormalities of nuclear chromatin may be evident.
FIGURE 22.8. Normoblasts and megaloblasts contrasted (Wright stain X 1000). A-E: Normoblast. A: Pronormoblast. B: Basophilic normoblast. C: Early polychromatophilic normoblast. D: Late polychromatophilic normoblast. E: Orthochromatic normoblast with stippling. F-O: Megaloblasts. F: Promegaloblast (left) and basophilic megaloblast (right). G-K: Polychromatophilic megaloblasts. L-O: Orthochromatic megaloblasts.
Vitamin B12 and Folate Levels in Serum and Erythrocytes
Once it is established that a patient has CBC and morphologic evidence of megaloblastic anemia, it should next be determined if this is due to vitamin B12 or folate deficiency (Chapter 36). Useful studies include measurement of serum and RBC folate levels and serum Vitamin B12 levels. Unlike serum vitamin B12, serum folate is labile, being sensitive to short-term changes in folate balance. Thus, serum folate concentration may increase within a few hours after consumption of folate-containing food. Furthermore, a low intake of folate may result in reduced serum levels before true deficiency develops.74 The erythrocyte folate level is a much better index of tissue folate stores. Erythrocyte folate levels are established during formation of the red cell and persist throughout its lifespan. Thus, it may take 3 to 4 months of folate deprivation before low values are obtained. Other studies such as serum homocysteine and serum methylmalonic acid can confirm a diagnosis of B12 deficiency, particularly when initial assays are at odds with the clinical and hematologic picture. Vitamin B12 absorption studies (Schilling test) or antibodies to intrinsic factor or parietal cells, can further define the specific causes of these disorders.
TABLE 22.4 PATHOGENETIC CLASSIFICATION OF MEGALOBLASTIC ANEMIA
Nonmegaloblastic anemias are not united by any common pathogenetic mechanism. They simply represent macrocytic anemias in which the RBC precursors appear normal without the characteristic nuclear and cytoplasmic findings of megaloblastosis. When macrocytosis is found, it tends to be mild; the MCV usually ranges from 100 to 110 fl and rarely exceeds 120 fl.64 Several causes of nonmegaloblastic macrocytosis are recognized (Table 22.5).
Accelerated Erythropoiesis
Mild to moderate macrocytosis often follows erythropoietinmediated acceleration of red cell production, as may be induced by blood loss or hemolysis. In part, this increased cell size occurs because reticulocytes are approximately 20% larger than mature red cells.79 Also, under conditions of accelerated red cell production, a premature release of bone marrow reticulocytes (shift reticulocytes) occurs, and these cells are even larger and contain more RNA than normal circulating reticulocytes.80 Last, an erythroblast cell division may be skipped under this erythropoietic stress, a phenomenon that results in a macroreticulocyte that is approximately twice the normal size.81
TABLE 22.5 NONMEGALOBLASTIC MACROCYTIC ANEMIAS
Hemolytic anemia/reticulocytosis
Posthemorrhagic anemia
Alcoholism
Liver disease
Myelodysplastic syndrome
Myelophthisic anemias
Aplastic anemia
Acquired sideroblastic anemia
Congenital dyserythropoietic anemia (CDA) types I and III
Macrocytosis, usually mild, is evident in 40% to 96% of alcoholics, many of whom have no anemia.82,83,84 The finding is so characteristic of the condition that testing for macrocytosis has been used as part of the screening procedure for the detection of chronic alcohol use. It may be present in both heavy and moderate drinkers.85 Macrocytosis and anemia in alcoholic individuals have several causes. Folate deficiency can lead to megaloblastic anemia, and alcoholic cirrhosis may be associated with spur cell hemolytic anemia. Most often, however, alcoholic macrocytosis is associated with none of these factors and instead results from poorly defined direct effects of alcohol on the bone marrow. Antibodies against acetaldehyde-modified RBC protein are detected in up to 94% of alcoholics with high MCVs, but less frequently in those with normal MCVs.85 There are no morphologic stigmata of megaloblastic anemia. Serum and erythrocyte folate levels are usually normal, and the macrocytosis does not respond to folate treatment. If the patient abstains from alcohol use, the MCV returns to normal levels after 2 to 4 months.
Liver Disease
The causes of anemia in liver disease are multifactorial, resulting from intravascular dilution due to hypervolemia, impaired ability of the marrow to respond optimally to the anemia, and in some patients, a severe hemolytic anemia associated with morphologically abnormal erythrocytes (spur cells). The anemia is usually mild to moderate. In cirrhotic patients, the Hb level averages approximately 12 g/dl, and remains above 10 g/dl in the absence of bleeding or severe hemolysis. The anemia of liver disease is mildly macrocytic: the MCV rarely exceeds 115 fl in the absence of megaloblastic changes in the bone marrow. In addition, liver disease is associated with thin macrocytes, defined as cells with increased surface area86 but without a corresponding increase in volume.87 The increased surface area of thin macrocytes is the consequence of excessive membrane lipids, especially cholesterol,87 but also phospholipids. On the blood smear, thin macrocytes are characterized by an increased diameter and a visibly enlarged area of central pallor. The characteristic target cell of liver disease is a thin macrocyte. Because the volume of such cells is normal, their presence has no effect on the erythrocyte indices.
Only gold members can continue reading. Log In or Register to continue