FIGURE 25-1. Growth hormone (GH) regulatory axis: Major factors regulating GH release. GH is secreted after the integration of diverse hypothalamic stimuli. It stimulates insulin-like growth factor-1 (IGF-1) production by the liver, bone, and other tissues, as well as gluconeogenesis. GH release from the pituitary gland is under tonic inhibition by hypothalamic somatostatin, and GH-releasing hormone (GHRH) stimulates GH release when somatostatin (SST) tone wanes owing to fluctuations in input from higher neural centers. Ghrelin is an endogenous GH secretagogue (GHS) and orexogenic peptide mainly secreted by the stomach in response to fasting. Its major indirect effect on GH is to antagonize SST release at the level of the hypothalamus. Small amounts of GHS are formed in the hypothalamus, however, and these weakly stimulate GHRH release directly; neonatally, GHS pituitary expression is high. SST tone is inhibited by cholinergic, dopaminergic, and α-adrenergic neuronal inputs to the hypothalamus and is stimulated by β-adrenergic ones. Negative feedback effects are exerted primarily by the long-loop actions of blood glucose and IGF-1, but also by short-loop signals between the various signal peptides of the axis. IGF-1 and blood glucose also exert negative feedback effects on GH release. Pharmacologic stimuli to GH release are shown in boxes. Solid lines indicate major regulatory pathways, dotted lines minor ones. +, Stimulator of GH, GHS, or IGF-1 release; −, inhibitor of GH, GHS, or IGF-1 release.
Endocrine input includes the endogenous GH secretagogue (GHS) ghrelin, an orexigenic peptide originating in the stomach and hypothalamus. Ghrelin stimulates GH release, primarily through promoting GHRH release, but also by acting directly on the pituitary, through specific receptors (GHSR). In addition, there is negative feedback on GH secretion by circulating IGF-1, which is primarily of hepatic origin, and glucose levels.99,100
GH secretion is also influenced by androgens and estrogen (which appear responsible for the rise in GH secretion during normal puberty), as well as by thyroxine and glucocorticoids (hypothyroidism and cortisol excess reduce GH secretion).
After secretion, GH is approximately 50% bound to GH-binding protein (GHBP). GHBP rises through childhood.101 It is the extracellular domain of the GH receptor (GHR); its underlying alternate splicing may be differentially regulated from the intact GHR.102 GHR is a member of the cytokine family. One molecule of GH binds to two GHR molecules, indicating receptor dimerization, which is critical for GH action. (This leads to activation of a receptor-associated Janus tyrosine kinase [JAK-2] and, in turn, transduction through a number of pathways, including the MAPK [mitogen-activated protein kinase] and STAT [signal transducers and activators of transcription] pathways.103) These paths result in activation of genes (including IGF-1) that mediate GH’s biological effects. Abnormalities of the GHR and its signaling system result in GH insensitivity and growth failure (see discussion to follow).
GH appears to stimulate growth through a combination of direct effects and effects mediated by IGFs104 (described in Chapter 23). GH stimulates the production of endocrine IGF-1 and its major binding protein (IGFBP-3). It also directly induces the clonal expansion and differentiation of target stem cells (such as prechondrocytes), and these differentiating cells (chondrocytes) then respond to GH by forming IGF-1 and IGF-1 receptors, which makes them responsive to the growth-promoting effect of both endocrine IGF-1 and IGFs secreted locally (autocrine and paracrine IGFs).105,106
IGF-1, produced by the liver and other tissues, is a critical regulator of postnatal growth and represents a major mechanism by which GH promotes growth. Circulating IGF-binding proteins (IGFBPs) sequester IGFs, whereas at the cell surface they can promote IGF action and exert novel actions.107 The IGFs and IGF-binding proteins are discussed in detail in Chapter 34. Defects in IGF-1 synthesis or action lead to growth failure in humans and laboratory animals. The effects of IGF-1 may depend on the tissue of origin. Local production of IGF-1 in peripheral tissues appears to mediate GH-induced somatic growth, whereas circulating IGF-1, which originates primarily in the liver, may not be essential for growth, but provides negative feedback for the GH axis.106 The free (unbound) IGF-1 is thought to be the biologically active fraction of circulating IGF-1, but the validity of current assays for this moiety is in question.108,109 IGF-1 production is regulated primarily by GH when nutrition is normal. IGF-2 is produced by cells independently of GH and seems to be normally important only for local growth regulation.110 IGF-2 levels seem to be modulated locally by the activity of a metabolizing receptor complex consisting of the IGF-2 receptor and glypican-3.111
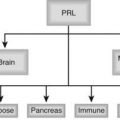
There is more to the regulation of plasma IGF-1 concentrations and bioactivity than GH. Hepatic IGF-1, the major source of blood IGF-1, is fundamentally under broad regulation by nutrition. Undernutrition decreases plasma IGF-1 levels despite normal or elevated GH concentrations.112 Overnutrition (i.e., obesity) has the opposite effect.89 Studies in rats suggest that insulin plays a role in mediating nutritional effects on hepatic IGF-1 formation through its stimulation of amino acid uptake.113,114 The increased plasma-free IGF-1 concentration in obese patients has been attributed to the suppressive effect of their insulin excess on IGFBP-1.115 Thyroid hormone and cortisol are necessary for hepatic IGF-1 production, and prolactin has a slight effect on it.116
Factors other than GH and nutrition—including age—determine IGF production, and these are poorly understood. Plasma IGF-1, IGFBP-3 levels,117 and somatomedin activity118 rise slowly during the prepubertal years with no change in GH production (Fig. 25-2).119 As a result, IGF-1 levels in normal children younger than 5 years of age overlap with those of GH-deficient children, making use of these tests in diagnosing GH deficiency difficult in young children. During puberty, IGF-1 levels rise further, and since IGFBP-3 levels rise to a lesser degree, free-plasma IGF-1 rises even more markedly.117 The pubertal increase in IGF-1 is mediated by sex hormone stimulation of GH secretion,120–122 although a separate direct effect on IGF-1 has been suggested.123 IGF-1 levels during adolescence, therefore, correlate more with pubertal development and bone age than with chronologic age.
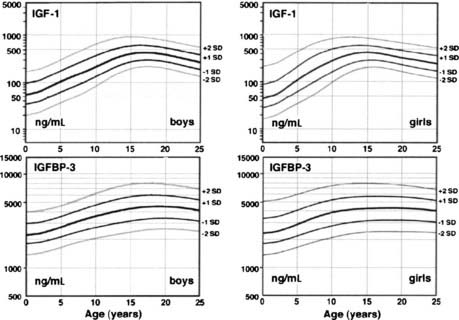
FIGURE 25-2. Plasma insulin-like growth factor-1 (IGF-1) and IGF-binding protein-3 (IGFBP-3) normal ranges from infancy to adulthood. Increases after 10 years of age are related to pubertal stage rather than to age. IGF-1 values are given in terms of the World Health Organization reference preparation 87/518, which is of low (44%) purity with respect to authentic recombinant human IGF-1, so the values shown are in excess of the true IGF-1 concentration.41
(Data from Diagnostic Systems Laboratories, Inc., 1997, Webster, TX.)
The relationship of plasma IGF-1 levels to normal linear growth is not a simple one. Plasma IGF-1 levels do not correlate with growth rate in childhood except during the pubertal growth spurt, when levels peak about a year after peak height velocity.124 IGFBPs in plasma determine the unbound concentration of IGF-1, transport the IGFs to target cells, and influence the interaction of IGFs with their receptors; a tissue IGFBP-protease system modulates IGF-1 bioavailability to target cells.105,107,125,126 IGFBPs also appear to be bioactive molecules that have IGF-independent functions.107,126 IGF bioactivity may be influenced by circulating somatomedin inhibitory activity, which is attributable to both glucocorticoids and incompletely characterized peptides.127,128 The cytokines interleukin-6 and tumor necrosis factor-α have direct inhibitory effects on chondrocytes.129
Growth may be normal with subnormal GH production in the poorly understood “growth without growth hormone syndrome.”130 Most often, this syndrome has been identified after surgical treatment for large hypothalamic and pituitary tumors, but the syndrome occasionally has been recognized in benign forms of hypopituitarism.131 IGF-1 levels may be low, but bioactivity normal. Most such patients are obese, so insulin excess or sensitivity has been suspected to be the underlying growth factor. Individual variation in local aromatase activity and thus availability of estrogen has also been suggested.132 Hyperprolactinemia is seldom found.
Thyroid hormone is necessary for postnatal bone growth because of both indirect effects on the GH-IGF axis and direct effects on bone growth.133 Thyroid hormone is required for normal GH secretion in response to GHRH and for normal GH action as indexed by GHBP, IGF, and IGFBP levels. Hypothyroidism (and, to a lesser degree, mutations of the thyroid receptor-β) produces short stature and delays bone maturation.
Glucocorticoids in above-normal amounts are inhibitors of linear growth.128,134 The mechanism is both indirect and direct. Glucocorticoid excess inhibits spontaneous GH secretion by stimulating somatostatin tone. The bioactivity of plasma IGF-1 falls during glucocorticoid therapy; this may reflect an increase in IGF-binding protein.135,136 Glucocorticoids themselves directly hinder cartilage growth,137 perhaps in part by inhibiting GH and IGF-1 induction of their respective receptors.138
Increased secretion of sex hormones clearly initiates the pubertal growth spurt. The growth-promoting actions of sex hormones require adequate GH; GH-deficient children will not undergo a normal pubertal growth spurt unless GH is replaced. About half of the contribution of sex hormones to the pubertal growth spurt is due to their stimulation of the GH-IGF axis, which appears to be mediated primarily by estrogen.91,120,121,139 The remaining effects of sex steroids on growth are direct or are mediated by a direct effect on IGF.123,140–142
Estrogen and androgen both stimulate bone growth, bone turnover, and epiphyseal growth.123,143,144 Androgen appears to stimulate and estrogen to inhibit periosteal bone formation, while estrogen promotes greater cortical thickening by inhibiting endosteal bone resorption. Estrogen is particularly effective in reducing bone turnover, however, and estrogens are responsible for epiphyseal closure.145 To some extent, these effects may be exerted prenatally, since maternal estrogen can have permanent effects on fetal bone development.146 Differences between these actions of sex hormones account for women’s bones being shorter and narrower than men’s.
Early pubertal amounts of estradiol (about 0.25 mg/month) stimulate growth in girls, in contrast to inhibition of growth by high doses of estrogen.147 Peak growth velocity of boys occurs at a testosterone production rate of about 50 to 100 mg/month.148 Whether other sex steroids play an independent role in growth is unknown; it has been reported that dehydroepiandrosterone sulfate promotes calcification of cartilage, and subandrogenic doses of androstenedione promote growth.49
INTRAUTERINE GROWTH
During the first trimester, tissue patterns and organ systems develop. In the second trimester, major cellular hyperplasia occurs in the fetus and its growth velocity is maximal. During the third trimester, organ systems mature and weight gain is maximal. Weight increases relatively more than length does in the third trimester because of the accumulation of fat and muscle. Overall, fetal growth is more rapid than postnatal growth.
Standards for intrauterine growth are shown in Fig. 25-3.149 Race, altitude, and gender cause subtle differences from these norms.150
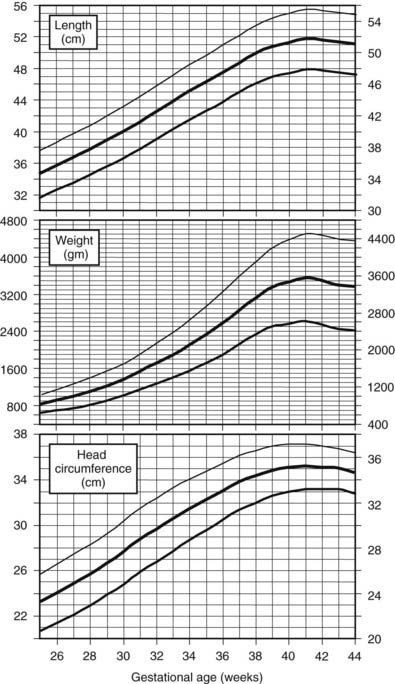
FIGURE 25-3. Intrauterine growth charts. Data represent birth weights according to gestational age of live-born Caucasian infants at sea level. Infants with major congenital malformations were excluded.
(Data from Usher R, McLean F: Intrauterine growth of live-born Caucasian infants at sea level: Standards obtained from measurements in seven dimensions of infants born between 25 and 44 weeks of gestation. J Pediatr 74[6]:901–910, 1969.)
Healthy infants born prematurely have weights appropriate for gestational age and continue to grow at the same rate that they would have grown in utero.151 When corrected for postconceptional age, length and weight follow postnatal standards. Consequently, the lengths of children born prematurely remain slightly less through infancy than those of children born at term, but the differences become negligible over time. Very premature infants, however, require intensive care to survive and uniformly lose weight during the first weeks of life; it takes several years for the great majority to catch up to the weight and length of term infants, and females achieve greater catch-up growth than males.152,153 In contrast to premature infants, 10% to 15% of those born small for gestational age prove to have persistent short stature beyond 4 years of age154 (see discussion that follows).
POSTNATAL GROWTH
Growth is the fundamental characteristic of childhood. Patterns of childhood growth are highly predictable, and deviation from these patterns often signifies the presence of serious disorders.
Postnatal growth patterns of normal children are well characterized, resulting in several clinical parameters for assessment of growth.
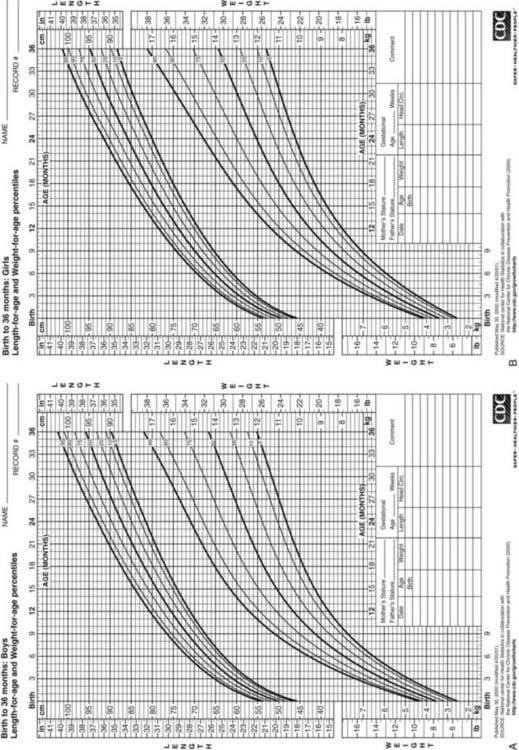
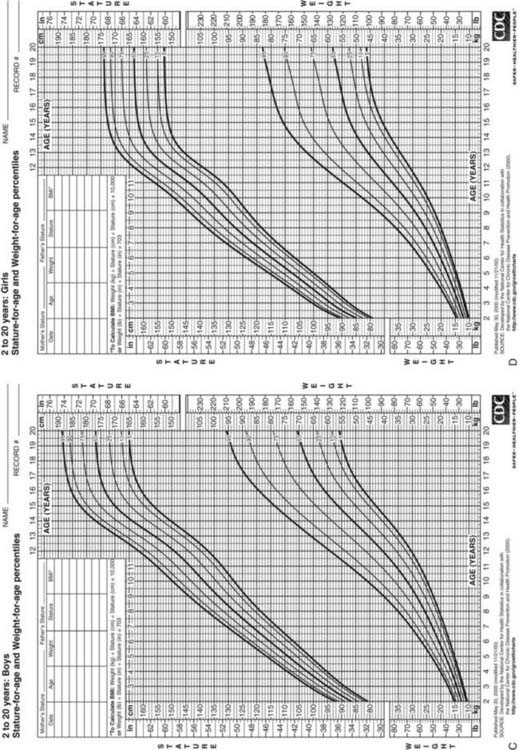
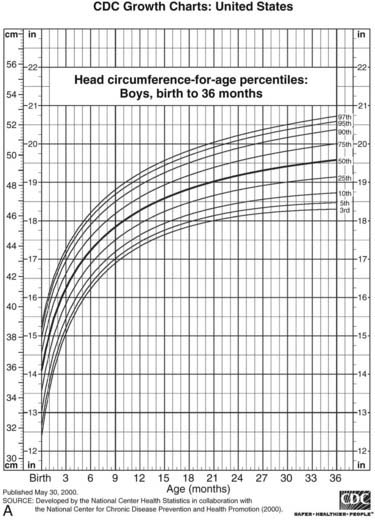
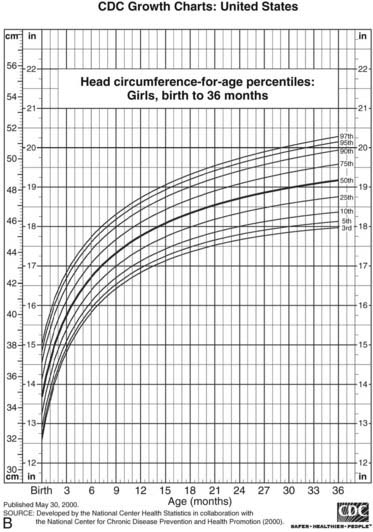
FIGURE 25-4. Postnatal growth standards. Current standards for height and weight of normal children in the United States. Figures A and B are infant growth charts for boys and girls, respectively. Figures C and D are for older boys and girls, respectively.
(From Centers for Disease Control and Prevention. CDC growth charts: United States, National Center for Health Statistics, Atlanta, GA.)
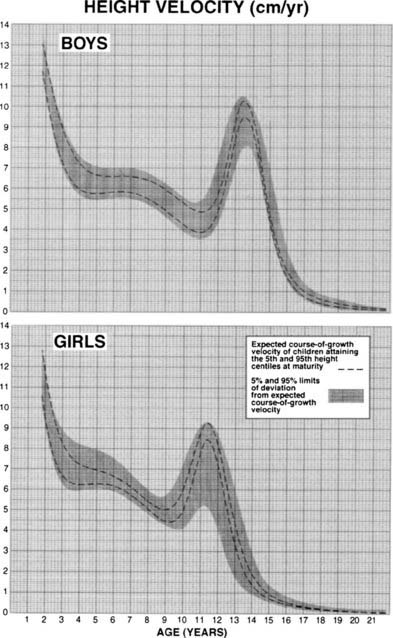
FIGURE 25-5. Longitudinal height velocity standards derived from the Fels, Berkely, and Denver growth studies.141
(Courtesy R.D. Bock.)
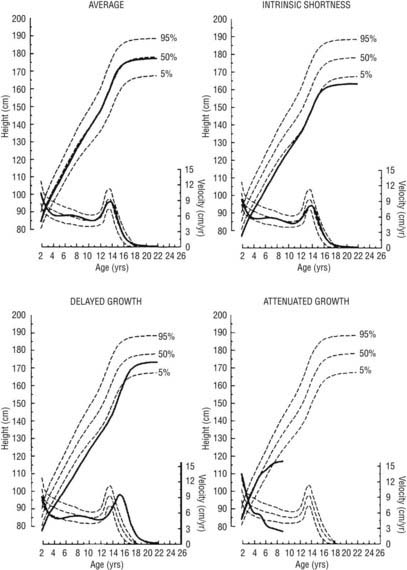
FIGURE 25-6. Linear growth curves in children with various types of growth patterns. Note that three prepubertal children of similar short stature at 9 years of age have different prognoses for growth. The growth curve of an average-size child is shown for comparison. On each chart, the upper scale shows the height attained, and the lower scale shows the height velocity. Normal percentiles are from the National Center for Health Statistics. Growth curves were generated by the TRI-FOUR program of Bock et al.
(Bock RD, du Toit SHC, Thissen D: A.U.X.A.L: Auxological Analysis of Longitudinal Data, Scientific Software, 1993, Chicago, IL. Courtesy of R.D. Bock.)
The growth channel seems to be genetically determined. Children grow as if to reach a genetically predetermined height. This target height, which represents the child’s genetic potential, can be approximated by calculating the midparental height (the average of the parents’ heights) and adding 6.5 cm for boys or subtracting 6.5 cm for girls (to adjust for the average differences between men and women). Alternative functions have been proposed for children with short parents. However, all such predictions are accurate only within a range of 7 to 10 cm.167
Deflections from this channel are firmly resisted, as if growth is being developmentally canalized.168 The mechanisms by which the growth channel is maintained are unknown. They may involve recognition of cell density, which is a determinant of the cell population in culture systems.169 In the course of a year, healthy children maintain their percentile position with respect to height attained by means of short-term fluctuations in growth velocity, termed stasis and saltation.170 These oscillations may be marked, growth sometimes seeming nil over 3-month periods, and are a potential source of error in growth diagnosis. GH variability has been reported to increase during periods of short-term growth.171 Variations tend to be seasonal, a “blooming” trend most often occurring in the spring.
During puberty, children may again cross height-attained percentiles because the pubertal growth spurts of individuals occur out of phase. The magnitude of this pubertal growth spurt is apparent only from growth-velocity standards based on age of menarche or longitudinal data. Peak growth velocity occurs approximately 1 year before menarche172 in girls, and at a bone age of approximately 12 years in girls and 13 years in boys.173 Girls on average achieve only 7 cm further growth after menarche.174 During the course of sexual maturation, the epiphyseal cartilage plates become progressively obliterated, and growth ceases when the process is complete. Only about 1 cm of growth occurs after fusion is complete in the femur and tibia.
The causes of the decrease in growth velocity from the fetal to the neonatal and subsequent early childhood years are not known but may be a consequence of differential expression of IGF-1 versus IGF-2, their receptors, and the various IGF binding proteins in the growth plate with increasing age.175 In addition, fibroblast growth factors may play a role.176
Some of the greater ultimate height of boys than of girls results from their later puberty and consequent longer period of prepubertal growth166; boys additionally have a slightly greater peak linear growth velocity than girls.156 Early maturers have more brisk pubertal growth than late maturers; however, they also stop growing earlier.156 This tendency occurs at comparable levels of bone maturation (Table 25-1).177 The growth patterns of nonwhite American children differ from those of whites in some particulars.178 Immigrant children go into a phase of catch-up growth in an optimum nutritional environment.179
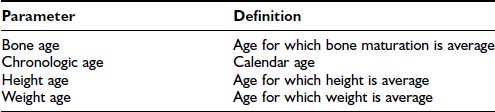
Table 25-1. Percentage of Adult Height Achieved at Successive Bone Ages, Variation in Height Prediction From Bone Age, and Variation in Bone Age in Relation to Chronologic Age
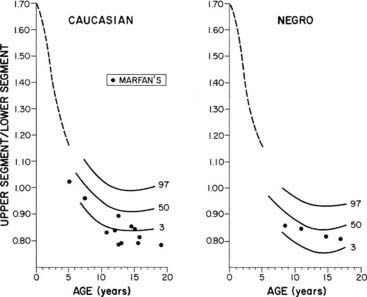
FIGURE 25-7. Normal standards for the ratio of the upper segment to the lower segment of the body. The lower segment represents the measurement from the top of the symphysis pubis to the heel; the upper segment is computed by subtracting the lower segment from height. The dotted line shows the average for young children in 1932.
(Percentile and Marfan data from McKusick VA: Heritable Disorders of Connective Tissue, ed 4. St Louis, Mosby, 1972.)
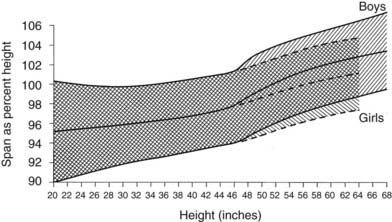
FIGURE 25-8. Standards for arm span as a percentage of height. The shaded area represents the normal range, smoothed.
(Data from Engelbach W: Endocrine Medicine, vol 1. Springfield, IL, Charles C Thomas, 1932, p 261.)
CATCH-UP AND CATCH-DOWN GROWTH AND COMPENSATORY GROWTH
Catch-up growth occurs upon relief from any disorder that has caused a deviation from a child’s genetic growth channel and restores the child to his or her original channel.168,186–188 In classic (“type 1”) catch-up growth, the rate of growth is supranormal and exceeds that expected for the age at which growth had been arrested. During adolescence, it may resemble the pubertal growth spurt. This type of catch-up growth has been further subclassifed.189 A different kind of catch-up growth (“type 2”) occurs following adequate therapy for sexual precocity.190 In this situation, restoration of height potential occurs because restitutional linear growth proceeds without bone maturation advancement, that is, height age catches up to bone age (Table 25-2). This is particularly true for sexual precocity that occurs very early; however, suppression of pubertal progression around the lower limit of normal age for pubertal onset may not be associated with similar benefits for height potential. Complete compensation for growth failure can occur upon correction of the underlying disorder if diagnosed early. Catch-up may be incomplete, however, if the growth disorder is of many years’ duration and extends into the age at which puberty normally occurs.
Table 25-2. Definitions of Growth Parameters
| Parameter | Definition |
|---|---|
| Bone age | Age for which bone maturation is average |
| Chronologic age | Calendar age |
| Height age | Age for which height is average |
| Weight age | Age for which weight is average |
Growth plate physiology plays an important role in mediating “catch-up” and “catch-down” growth. The growth plate goes through a programmed pattern of senescence through childhood and adolescence, dependent on factors intrinsic to the growth plate.191,192 Information regarding previous growth history appears to be retained in the memory of the growth plate, likely in resting zone “stem cell–like” chondrocytes, and influences future structural and functional changes in the growth plate, with effects on “catch-up” and “catch-down” growth.193
Endocrine deficiencies causing short stature have important effects on the growth plate. Following induced hypothyroidism and hypercortisolism in experimental models, growth plate chondrocyte proliferation slows down, with a slower depletion of resting zone chondrocytes, leading to preservation of proliferative capacity and slowing of senescence. With normalization of hormone levels, growth plates grow more rapidly, resulting in “catch-up” growth.194,195 However, akin to humans, catch-up growth after correction of hypothyroidism remains incomplete, with adult height being less than in euthyroid controls. Estrogen administration accelerates growth plate senescence, and fusion occurs with exhaustion of proliferative potential.195 The duration of estrogen exposure to induce epiphyseal fusion depends on age. A younger child requires more years of estrogen exposure than an older child, likely because a longer duration of estrogen exposure is required to exhaust the larger reserve capacity of growth plate chodrocytes in a younger child. Finally, although GH deficiency leads to marked growth deficits, provided sufficient time is available, GH replacement causes sustained “catch-up” growth sufficient to achieve target height.196
In contrast to situations of hormone replacement for endocrine deficiencies, “catch-up” growth in other situations of short stature is not as optimal. In SGA infants, an early increase in growth rate has been associated with an increase in IGF-1 levels after intrauterine constraints are eliminated, because high GH levels from intrauterine undernutrition and associated GH insensitivity take time to normalize.51 However, “catch-up” does not occur in as many as 10% to 15%, and only about half of very low birth weight, SGA infants demonstrate complete “catch-up.” About a third remain shorter than target height, with the initial “catch-up” being followed by “catch-down” growth.197 In addition, following GH therapy in short children born SGA, cessation of GH therapy before epiphyseal fusion leads to a reduction in growth velocity SD score (SDS) and height SDS over a 5-year period, with maximum growth deceleration occurring during the first year after GH therapy is stopped. Another form of “catch-down” growth occurs in children born in families with a history of short stature, in whom length SDS decreases over the first 2 years of life to the familial range, and the extent of loss of length SDS is greater in appropriate for gestational age (AGA) than SGA babies.
Compensatory growth is the term used for the local organ regeneration that occurs after the mass of an organ has been reduced, as by removal or destruction of a portion of that organ.168 Examples include the compensatory growth that occurs after partial hepatectomy or loss of a kidney. Local IGF-1 and IGF-2 are involved in this type of growth.110
SKELETAL MATURATION: BONE AGE IN PREDICTION OF ADULT HEIGHT AND PUBERTAL MILESTONES
Bone growth is accompanied by a predictable pattern of bone maturation. After epiphyseal ossification centers first appear, they undergo modeling in shape and then fuse with the shaft. Bone maturation is assessed as bone age (BA, skeletal age), based on x-rays of the left wrist (see Table 25-2). Figs. 25-10 and 25-11 schematically show the Gruelich and Pyle BA standards.198,199 The normal range for BA is indicated in Table 25-1. The evaluation is most reliable if the maturation of each center is assessed for calculation of the average,200 to circumvent normal variations in the epiphyseal ossification pattern.201 Other atlas methods are available for assessing bone maturation.202 Skeletal development of young black children is about 0.67 SD advanced over whites of comparable economic status.203 Other ethnic differences exist that are, to an unknown extent, nutritional.202 Bone age is influenced by thyroid hormone, growth hormone, sex steroids, and unknown factors. In both boys and girls, estrogen is responsible for ultimate fusion of the epiphyses.
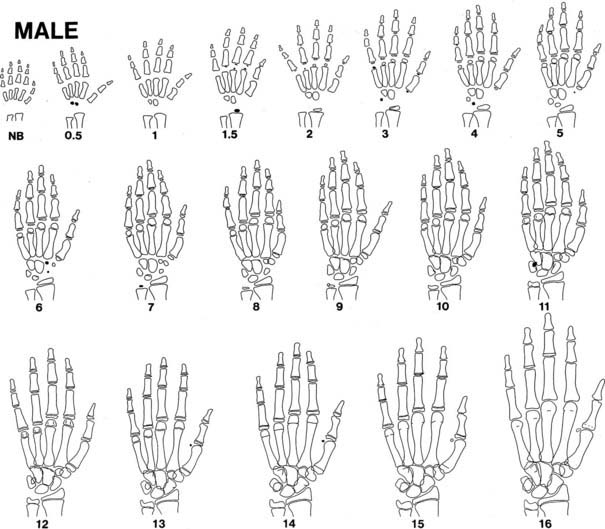
FIGURE 25-10. Progression of ossification of the hand and wrist in boys. Tracings are modified from the standards of Gruelich and Pyle,198 according to the manner of Wilkins.199 Newly apparent ossification centers are shown in black. Late perfusion is depicted as a single line at the junction of the epiphysis and the shaft. Bony projections, which appear as a double contour within the outlines of a center, are not illustrated after their appearance has matured.
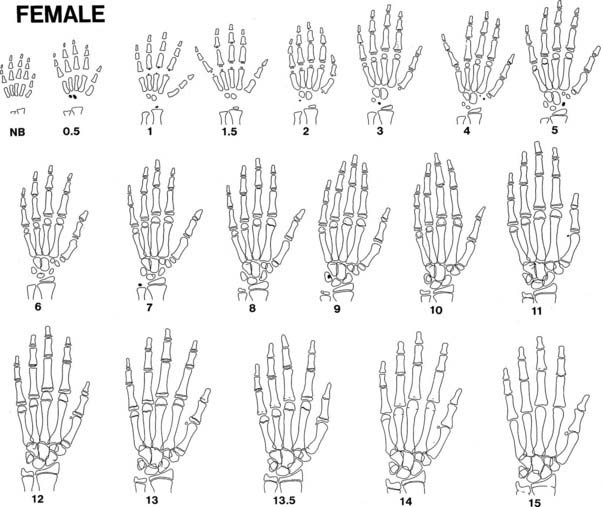
FIGURE 25-11. Progression of ossification of the hand and wrist in girls. See legend for Fig. 25-10.
BA is a better predictor of pubertal milestones than is chronologic age. It is as if bone and neuroendocrine maturation have common genetic, nutritional, and endocrine determinants.204 A BA of 11 to 12 years corresponds better to the onset of puberty in girls and boys, respectively, than do these chronologic ages. Peak height-velocity phase differences are 25% less when plotted against BA instead of chronologic age.165 In girls, menarche has been demonstrated to occur at a mean skeletal age of approximately 13 years.198,205
Bone age can be used to predict ultimate height potential, since the degree of bone maturation is inversely proportional to the amount of epiphyseal cartilage growth remaining. It follows that if a child’s BA and height age (HA; see Table 25-2) are equal, he or she has the potential to reach an average adult height. The fraction of final height achieved at each BA is known (see Table 25-1). Therefore, predicted adult height can be calculated by dividing a child’s current height by this fraction (method of Bayley and Pinneau).177 The error inherent in this method is less than 1.5 inches in normal children (see Table 25-1). However, spontaneous shifts by as much as 5 inches in predicted height may occur in 3% of the population for reasons that are unclear.206 The error is not reduced by serial readings.200 Because height prediction methods were developed based on normal children, the error is greater in children who are very short207 or have abnormalities such as bone dysplasias.
To reduce the error in height prediction, elaborate tables have been devised that take into consideration not only a child’s BA and height but also the height and weight of the genetic target.208 Genetic influences on height predicted from bone age can be roughly accounted for by adding one-third the amount that the midparental height differs from the average.174
Three methods for assessing height predictions based, in part, on bone age have been developed.177,208,209 All are based on data from normal children. The Bayley-Pinneau method can be applied simply to young children with abnormal bone ages, so it is used most frequently in children with growth disorders; however, its accuracy has not been verified in many of these.
Growth Disorders
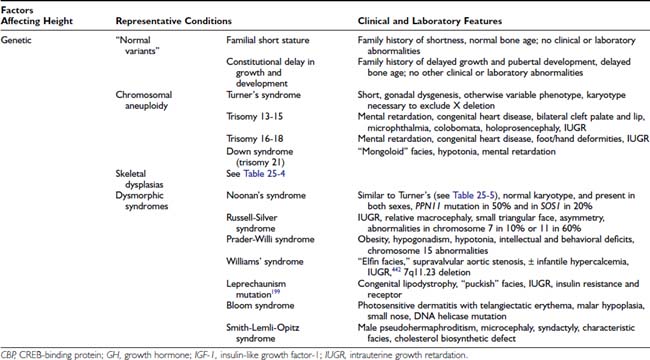
Children who present for inadequate or excessive linear growth generally have either a genetically based, normal variant growth pattern or a disorder of the factors that control growth, as discussed previously. In some children, no cause for abnormal growth can be identified (idiopathic short stature). The following section first categorizes the disorders that cause short stature according to the factors that influence growth. Endocrinopathies are discussed here only insofar as they affect growth; detailed discussion of these disorders can be found in other chapters. Alternative categorizations of growth disorders are possible; the one presented is preferred because it follows from an understanding of factors that influence growth and avoids ambiguous terminology. Then we present an approach to the differential diagnosis of these disorders according to the clinical assessment of the growth pattern with which the patient presents, along with those clinical features and laboratory tests that discriminate among these disorders. Discussion of treatment for short stature follows. Tall stature is discussed in a parallel manner in the final section.
SHORT STATURE
Causes of Short Stature (Table 25-3)
Genetic and Familial Conditions
Familial Variants
Conditions traditionally considered to be normal variants dominate as the most frequent causes of short stature. Two major nonpathologic familial patterns of growth cause the great majority of cases of short stature. One is familial short stature (sometimes termed familial intrinsic short stature or genetic short stature), in which normal children’s growth approximates that of their short parents. The other is constitutional delay in growth and pubertal development, in which healthy children who are short (delayed puberty may be the most prominent symptom) spontaneously achieve their normal growth potential at a later than average age. Characteristically, a parent or close relative has a similar growth pattern. In both of these growth patterns, which traditionally are considered normal variants, the typical patient is of normal birth size, and length progressively crosses growth channels to fall below the fifth percentile by 2 to 3 years of age. Height age and bone age then characteristically advance at a normal rate, so that height is below but closely parallel to the fifth percentile through the prepubertal years. These two normal variants differ, however, because in the former, the bone age is normal and puberty occurs at a normal age, whereas in the latter, the bone age is delayed and there is a corresponding delay of puberty until the child reaches a pubertal bone age, at which time a growth spurt results in an adult height that generally is normal for the family target height. These diagnoses rest on the family history, growth pattern, and bone age, and exclusion of other abnormalities. Predictions of adult height are particularly prone to overestimation of growth potential in some very short children.207 As the molecular controls of growth are elucidated, it is likely that some subgroup(s) of these children will be found to have specific diseases. Some endocrinologists now classify familial short stature and constitutional delay in growth and pubertal development as forms of idiopathic short stature (see later), although others disagree with categorizing these conditions as disorders.210
Skeletal Dysplasias
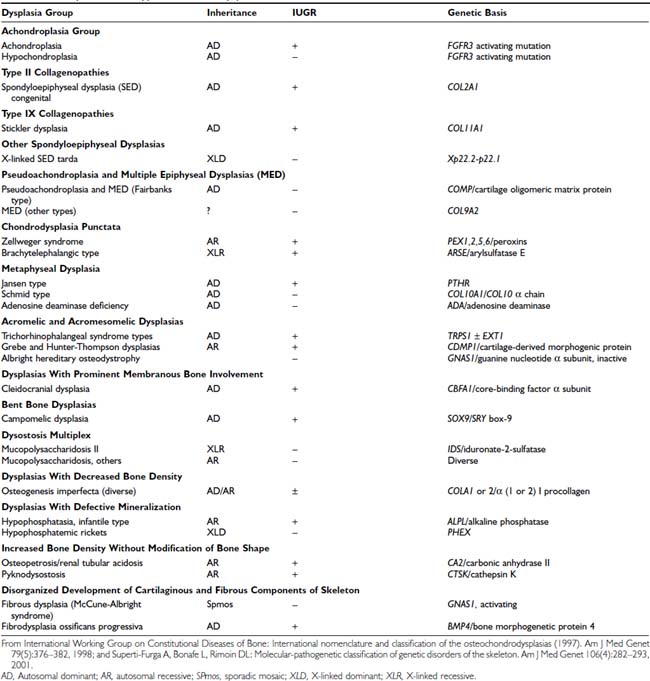
Osteochondrodysplasias consist of a large group of developmental disorders of chondro-osseous tissue, characterized by disproportionate growth, deformation of the skeleton or of individual bones or groups of bones, and genetic transmission; they often are associated with short stature. Osteochondrodysplasias include more than 150 mostly rare conditions, the number expanding as underlying molecular defects are characterized (Table 25-4).211,212 Abnormal body proportions, such as upper body segment abnormally longer than lower body segment (see Fig. 25-7),180 or arm span disproportionate to height (see Fig. 25-8),181 are characteristic in skeletal dysplasias, which are diagnosed by these features together with specific radiologic bone abnormalities.
Related posts:


Stay updated, free articles. Join our Telegram channel

Full access? Get Clinical Tree


