CT is currently the primary method of imaging the adrenal gland, both for evaluating patients with abnormal adrenal function and for demonstrating adrenal anatomy in patients with incidentally discovered adrenal masses. MRI can also detect the normal and abnormal adrenal gland with accuracy similar to CT, and frequently is used to help characterize many incidental adrenal masses as adenomas. Because CT is used much more often to evaluate the abdomen for a variety of known or suspected abnormalities unrelated to the adrenal glands, it is the imaging modality with which most incidental adrenal masses are first detected.1
COMPUTED TOMOGRAPHY
With the use of modern CT scanners, the normal adrenals can be visualized in virtually 100% of cases. With the advent of helical CT technology, axial slices of 3 to 5 mm can be obtained routinely in patients suspected of adrenal pathology. Oral contrast and intravenous contrast are not necessary for detection of adrenal masses, but are used routinely in abdominal CT.
MAGNETIC RESONANCE IMAGING
Recent advances in MRI technology have improved its ability to demonstrate the normal adrenal glands and small adrenal masses. Most notably, the development of breath-hold pulse sequences has dramatically decreased artifacts that limited the utility of adrenal MRI. The traditional advantages of MRI—improved tissue contrast resolution, ability to image in multiple planes, and utility in patients with renal insufficiency and previous idiosyncratic reaction to iodinated contrast material—have always made it a useful alternative to CT. But the image quality of gradient-echo breath-hold scans, use of in-phase and opposed-phrase imaging to detect intracellular lipid in adrenal adenomas, and improved spatial resolution on 3-dimensional dynamic imaging with thin slices, make MRI a truly competitive method with CT for imaging normal and pathologic adrenal glands.
NORMAL ADRENAL ANATOMY
The cross-sectional anatomy of the normal adrenal gland is nearly identical on CT and MRI. The right adrenal lies higher in the abdomen than the left adrenal. It is superior to the upper pole of the right kidney, whereas the left adrenal is anteromedial to the upper pole of the left kidney. The basic morphology of the adrenal glands on transverse axial CT and MRI is that of an inverted V or an inverted Y. In the inverted Y configuration, the anterior limb is shorter and thicker than the posteromedial and posterolateral limbs and sometimes is undetectable, thus the inverted V appearance (Fig. 105-1).
Clinical Utility of CT and MRI
CUSHING’S SYNDROME
Cushing’s syndrome (see also Chapter 15) results from excess circulating glucocorticoids, which causes characteristic clinical signs and symptoms. It refers to the clinical and metabolic disorder regardless of the underlying cause. The most common cause is iatrogenic steroid administration. Endogenous Cushing’s syndrome is due to overproduction of cortisol by the adrenal cortex, caused by (1) excess production of adrenocorticotropic hormone (ACTH) by a pituitary tumor; (2) a steroid-producing adrenal cortical tumor, benign or malignant; or (3) adrenal hyperplasia secondary to an ectopic source of ACTH production. Very rare causes of ACTH-independent bilateral hyperplasia also have been identified. Strictly speaking, Cushing’s disease refers only to bilateral adrenal hyperplasia due to overproduction of ACTH by a pituitary adenoma.
Most cases of Cushing’s syndrome (up to 85%) are due to excess ACTH production from a pituitary or ectopic source. The adrenals may be normal on CT or may show diffuse bilateral hyperplasia. A small percentage of patients (12% to 15%) with Cushing’s disease demonstrate multiple or, less commonly, single macronodules, varying in size from several millimeters to 7 cm. If macronodular adrenal hyperplasia is characterized by a single dominant nodule, this entity may be confused with a unilateral autonomous adrenal adenoma, leading to performance of an inappropriate unilateral adrenalectomy.2 Additional small nodules or diffuse overall enlargement of both glands usually is present, however, which together with the biochemical findings, allows the correct diagnosis to be made.
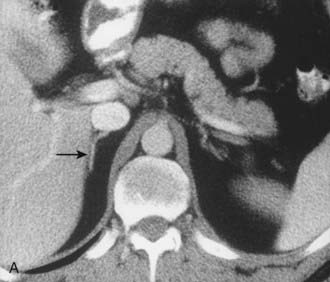
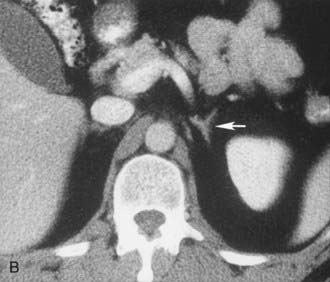
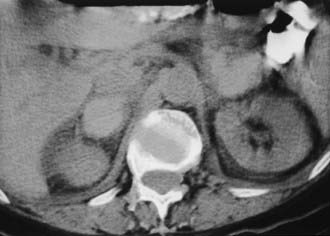
A much rarer form of macronodular adrenal hyperplasia is ACTH-independent disease. Two unique CT and MRI features of this disorder are the large mass of cortical tissue and the size of individual nodules (Fig. 105-2).3 The size of the nodules can suggest a diagnosis of bilateral metastases or bilateral adenomas, but, in the presence of Cushing’s syndrome, the appearance is practically pathognomonic of ACTH-independent macronodular adrenal hyperplasia, and bilateral adrenalectomy is indicated on the basis of clinical and CT findings.
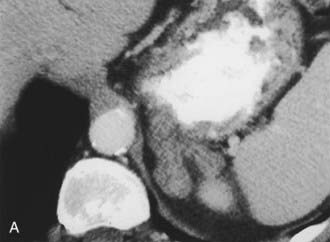
FIGURE 105-2. ACTH-independent macronodular adrenal hyperplasia. A and B show large nodules bilaterally superimposed on markedly thickened limbs. ACTH, Adrenocorticotropic hormone.
About 15% of cases of ACTH-dependent Cushing’s syndrome are due to ectopic ACTH secretion from a nonpituitary source. The most common source of an ectopic ACTH-producing tumor is a small cell carcinoma of the lung. The diagnosis of patients with occult sources of ACTH secretion presents a more difficult diagnostic challenge. Bronchial carcinoid tumors are the most common source of occult, ectopic ACTH secretion, which occurs in about 60% to 80% of cases. In one recent study, five of eight bronchial carcinoid tumors measured between 4 and 10 mm in diameter, and thin section CT was required to evaluate the lungs. Less common sources of ectopic ACTH production include small islet cell tumors of the pancreas, pheochromocytoma, medullary thyroid carcinoma, and thymic carcinoid.
About 30% of cases of Cushing’s syndrome are due to an ACTH-independent adrenal cortical neoplasm; about two thirds of these are due to adrenal adenomas and the other one third to adrenal cortical carcinoma. These tumors are easily detectable on both CT and MRI. Adrenal cortical adenomas are nearly always less than 5 cm in diameter, typically 2 to 2.5 cm, and have a nonspecific morphologic appearance (Fig. 105-3). Adrenal cortical carcinomas are typically larger than 5 cm in diameter, often show evidence of necrosis on enhanced CT and MRI scans, and frequently present with spread to adrenal or renal veins or evidence of distant metastatic disease (Fig. 105-4). Carcinomas are usually hypointense relative to liver on T1-weighted images and hyperintense to liver on T2-weighted images.
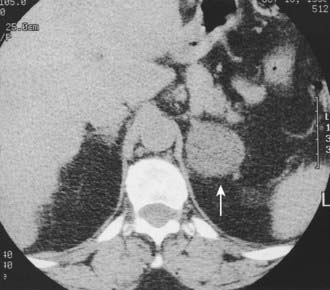
FIGURE 105-3. Adrenal adenoma causing Cushing’s syndrome. Homogeneous 4 cm left adrenal mass (arrow) has a nonspecific computed tomography (CT) appearance. L, Left.
(From Korobkin M, Francis I, Kloos R, Dunnick NR: The incidental adrenal mass, RCNA 34:1037–1054, 1996.)
PRIMARY ALDOSTERONISM
Primary aldosteronism is characterized by moderate to severe hypertension caused by unregulated secretion of aldosterone with elevated levels of serum and urinary aldosterone, hypokalemia, and suppressed plasma renin activity (see also Chapter 107). A solitary aldosterone-producing adenoma (APA) is present in about 70% of patients, and surgical or laparoscopic adrenalectomy corrects the hypertension and hypokalemia in about 75% to 90% of cases.4 Most of the remainder have idiopathic hyperaldosteronism (IHA) with bilateral adrenal hyperplasia. Unlike patients with unilateral APA, surgery rarely cures the hypertension and the biochemical abnormalities, and these patients usually are treated medically. It is essential, therefore, to distinguish APA from IHA in primary hyperaldosteronism.
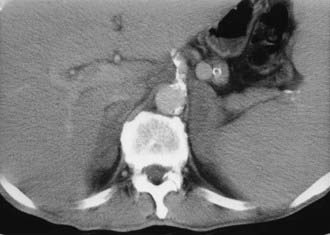
CT is widely used to differentiate between APA and IHA, but the sensitivity and specificity for the diagnosis of an adenoma vary widely in the literature, ranging from 71% to 100% and from 33% to 100%, respectively.5 If the imaging results are equivocal, adrenal venous sampling is usually recommended. Sensitivity of CT for the diagnosis of APA is lower than for most other adrenal masses because they usually are smaller than 2 cm, and sometimes are smaller than 1 cm, in diameter (Fig. 105-5).
FIGURE 105-5. Computed tomography (CT) demonstration of a 1 cm aldosterone-producing right adrenal adenoma.
(From Korobkin M, Francis IR: Adrenal imaging, Semin Ultrasound CT MR 16:317–330, 1995.)
CT evaluation is hampered by the fact that a unilateral aldosteronoma may be associated with non–aldosterone-secreting nodules in the ipsilateral or contralateral gland and can result in a false diagnosis of adrenal hyperplasia.6 In addition, bilateral hyperplasia may have a predominant unilateral macronodule and may cause an erroneous diagnosis of a unilateral aldosteronoma.
Doppman and colleagues7 demonstrated that CT cannot reliably differentiate APA from IHA whenever bilateral adrenal nodules are demonstrated. In their series, 6 of 21 patients with APA were incorrectly diagnosed on CT as having IHA. Non–aldosterone-secreting nodules were detected by CT, in addition to the aldosteronoma. Most patients with a unilateral adrenal mass can proceed to unilateral adrenalectomy. Patients with bilateral adrenal nodules, as well as those in whom CT and biochemical evaluations are discordant or equivocal, often undergo bilateral selective adrenal vein sampling for aldosterone levels.8
Although most cross-sectional studies of patients with primary aldosteronism have used CT, MRI also can accurately differentiate APA from IHA.9 Among the 20 patients studied, 10 (50%) had APA and 10 (50%) had IHA. In the detection of APA, MRI had sensitivity of 70%, specificity of 100%, and accuracy of 85%, which is comparable with values reported with CT.10–12 Traditionally, the diagnosis of IHA by CT or MRI has been made by excluding the presence of an adenoma. A recent study suggests that the diagnosis can be made more directly by measuring the limb size in patients with primary aldosteronism.5 This CT-based study showed that adrenals were significantly larger in patients with bilateral hyperplasia than in patients with APA or in healthy control subjects. Sensitivity of 100% was achieved when a mean limb width of greater than 3 mm was used to diagnose IHA, and specificity of 100% was achieved when the mean limb width was 5 mm or greater. Therefore, the use of adrenal venous sampling was recommended only when the mean adrenal limb width was between 3 and 5 mm. Even when the radiologist assessed limb thickness visually, the overall results were similar to quantitative measurements.
PHEOCHROMOCYTOMA
Pheochromocytoma (see also Chapter 109) is often called the “10%” tumor, because about 10% are extra-adrenal in location, multiple, inherited, or malignant. Most cases are sporadic, but some are associated with multiple endocrine neoplasia (MEN) syndromes, neurofibromatosis or von Hippel-Lindau disease, or familial pheochromocytoma. Pheochromocytomas secrete the neurotransmitter hormones epinephrine and norepinephrine, which often leads to hypertension, tachycardia, headaches, palpitations, diaphoresis, and chest pains. Some or all of these findings can be present, often in an episodic pattern, but can be absent in about 10% of patients. Diagnosis of pheochromocytoma can be suspected clinically and confirmed by elevated levels of these hormones, particularly their metabolites, in the blood or the urine. Localization of a pheochromocytoma is essential because surgical resection can be curative. CT, MRI, and 131I (and 123I)-meta-iodobenzylguanidine (MIBG) imaging all have been used to localize pheochromocytomas.
Most pheochromocytomas are readily detected on CT, because they typically measure 2 to 5 cm in diameter. Although some are small and homogeneous in attenuation, many have regions of necrosis or hemorrhage and can have a fluid density on unenhanced CT. For many years, intravenous ionic contrast material was avoided in patients with known or suspected pheochromocytoma because of an effect on catecholamine levels and the fear of inducing a hypertensive crisis.13 More recently, however, a study using nonionic IV contrast showed no significant increases in catecholamine levels in control subjects or in patients with pheochromocytomas.14
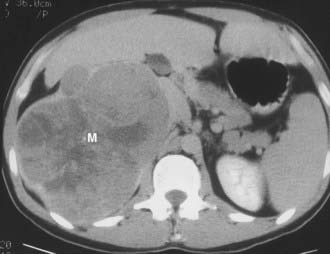
Contrast-enhanced CT of adrenal pheochromocytoma shows nonspecific homogeneous or, more commonly, inhomogeneous enhancement of a solid mass, similar to the finding in adrenal metastasis or adrenal cortical carcinoma (Fig. 105-6). Most pheochromocytomas have an unenhanced attenuation greater than 10 Hounsfield units (HU), although a recent report described a single case each of pheochromocytoma (9 HU) and medullary hyperplasia (2 HU) with lipid degeneration.15 Oral contrast opacification of the gastrointestinal tract is essential for the detection of para-aortic tumors in the retroperitoneum (Fig. 105-7), because unopacified bowel at times can simulate a “mass.” Although rare, intrapericardial paragangliomas can be detected by dynamic bolus contrast-enhanced CT of the mediastinum (Fig. 105-8). The inhomogeneous mass is usually located adjacent to or involving the left atrium.16
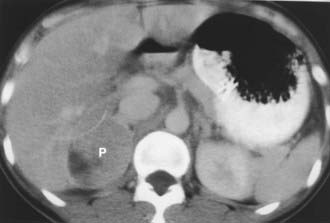
FIGURE 105-6. Intravenous contrast-enhanced computed tomography (CT) shows a right adrenal pheochromocytoma (P) with areas of necrosis.
(From Korobkin M, Francis IR: Imaging of adrenal masses, Urol Clin North Am 24:603–622, 1997.)
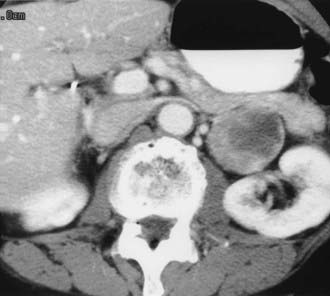
FIGURE 105-7. Retroperitoneal extra-adrenal pheochromocytoma. Enhanced computed tomography (CT) shows an inhomogeneous enhancing mass medial to the left kidney. A normal left adrenal was demonstrated on scans cephalad to this mass.
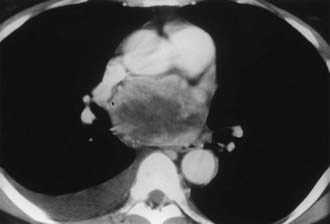
FIGURE 105-8. Intrapericardial extra-adrenal pheochromocytoma. Enhanced computed tomography (CT) shows an inhomogeneous mass in the expected location of the left atrium. MIBG scan was positive in this location.
(From Hamilton BH, Francis IR, Gross BH, et al: Intrapericardial paragangliomas [pheochromocytomas]: Imaging features, Am J Roentgenol 168:109–113, 1997.)
On MRI, most pheochromocytomas are hypointense on T1-weighted images and markedly hyperintense on T2-weighted images. Initial reports of MRI of adrenal masses suggested that pheochromocytomas could be distinguished by their marked hyperintensity on T2-weighted images. Considerable overlap with other neoplasms, however, including adrenal cortical carcinomas, was demonstrated in up to 33% of cases.17 The cause of the high T2 signal intensity of pheochromocytomas remains controversial. Most of the initial reports were from mid and low field strength magnets, whereas currently, most MRI magnets have high field strength (1.5 T). The cause may be related to the necrotic or cystic areas so common within these tumors. MRI angiography is useful for demonstrating the presence or absence of intracaval extension of adrenal pheochromocytoma, and MRI is useful in the search for an extra-adrenal paraganglioma from the neck to the bladder.
HYPOADRENALISM
Adrenal insufficiency, or hypoadrenalism, most often is due to autoimmune atrophy, and imaging usually is not useful for diagnosis. The glands are extremely small and may be difficult to identify on CT or MRI17 (Fig. 105-9). Atrophic glands may be due to chronic granulomatous disease, but these cases usually are associated with adrenal calcification. In patients with adrenal insufficiency due to granulomatous infection caused by tuberculosis, histoplasmosis, or blastomycosis, the acute and subacute phases are manifested as bilateral adrenal enlargement, although often some asymmetry is noted. Inhomogeneous low attenuation within the adrenal mass, best seen on enhanced CT or MRI, is due to caseous necrosis.18 Unlike patients with adrenal metastases, the enlarged glands in granulomatous adrenalitis typically retain their normal inverted Y contour.17 Percutaneous biopsy of the adrenals is often necessary to confirm the diagnosis of granulomatous adrenalitis and to identify the organism. Bilateral adrenal calcification from granulomatous disease can be seen in both adrenal hypofunction and normal adrenal function. Demonstration of uninvolved noncalcified adrenal tissue usually indicates normal function.
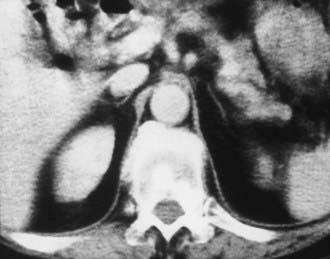
FIGURE 105-9. Computed tomography (CT) shows markedly atrophic adrenal glands in a patient with adrenal insufficiency secondary to idiopathic autoimmune atrophy.
(From Korobkin M, Francis IR: Adrenal imaging, Semin Ultrasound CT MR 16:317–330, 1995.)
Bilateral adrenal hemorrhage often is accompanied by adrenal insufficiency, and the detection of bilateral hyperattenuating masses on unenhanced CT can sometimes be the first clue to a clinical diagnosis (Fig. 105-10). Although bilateral adrenal metastases are commonly seen, they usually do not lead to clinically apparent hypoadrenalism. Adrenal insufficiency can be caused by acquired immunodeficiency syndrome (AIDS) and the antiphospholipid antibody syndrome; however, the adrenal anatomy in these diseases can be variable.19,20
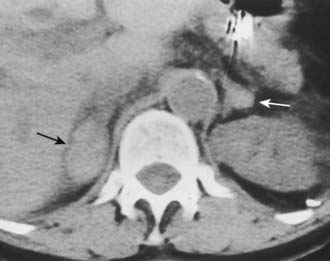
FIGURE 105-10. Adrenal insufficiency secondary to bilateral adrenal hemorrhage. Unenhanced computed tomography (CT) shows a high-attenuation mass in both adrenals (arrows) characteristic of acute or subacute hematoma.
(From Korobkin M, Francis IR: Adrenal imaging, Semin Ultrasound CT MR 16:317–330, 1995.)
THE INCIDENTALLY DISCOVERED ADRENAL MASS (INCIDENTALOMA)
The more widespread application of high-resolution anatomic imaging to screen the abdomen for diseases or to stage diseases unrelated to the adrenal has identified a growing number of unexpected adrenal masses or “incidentalomas.”21–24 Given their prevalence in from 4% to 10% of patients studied with CT or MRI for indications other than suspected adrenal disease, novel adaptations to imaging have been made to distinguish frequent, nonhypersecretory, benign adrenal masses from adrenal metastases and adrenocortical carcinoma.22 The discovery of an adrenal mass presents a diagnostic and, at times, a therapeutic challenge. Because an overwhelming majority of incidentalomas are benign and nonhypersecretory, an aggressive approach to them is not indicated.21–23 Of course, a solitary adrenal metastasis or an incidentally discovered adrenal carcinoma treated earlier would have a more favorable result. Given the uncertainty in diagnosis of adrenal masses other than cysts and myelolipomas, many diagnostic algorithms and approaches have been offered, making the evaluation of adrenal incidentalomas controversial.21,25 A thoughtful approach to such patients must include a biochemical evaluation sufficient to exclude both cortical and medullary hyperfunction and an anatomic and/or functional imaging evaluation sufficient to exclude a malignancy.21,25–27 The continuing uncertainty about appropriate clinical and imaging management of adrenal incidentalomas was attested to at a National Institutes of Health Consensus Conference on this subject in February 2002.28
Specific Imaging Features of Incidentally Discovered Adrenal Masses
Myelolipoma
A myelolipoma is a benign tumor that comprises bone marrow elements. Myelolipomas do not produce hormones and most are detected as incidental findings. Occasionally, large tumors or those undergoing tumor necrosis or spontaneous hemorrhage may cause flank pain.29,30 Although most are adrenal in location, extra-adrenal myelolipomas have been reported.31,32 Because they include large amounts of mature fat, most myelolipomas are recognized easily on CT (Fig. 105-11). Elements of soft tissue density are found in varying amounts, and calcification is seen in up to 20% of cases.
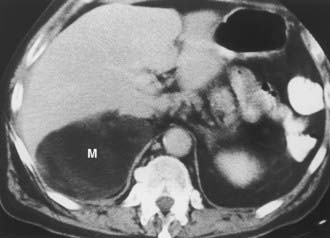
FIGURE 105-11. Myelolipoma. Large, fatty right adrenal mass (M) is seen on this contrast-enhanced computed tomography (CT) examination.
(From Korobkin M, Francis IR, Kloos RT, Dunnick NR: The incidental adrenal mass, Radiol Clin North Am 34:1037–1054, 1996.)
The appearance of a myelolipoma on MRI reflects portions of fat and bone marrow elements in the tumor. Fat exhibits high-signal intensity on both T1- and T2-weighted sequences. The bone marrow elements have a low signal intensity on T1-weighted images and a moderate signal intensity on T2-weighted scans.33,34 Because a confident diagnosis of myelolipoma usually can be made with CT or MRI, most are treated conservatively.
Cyst
Adrenal cysts are uncommon lesions with infrequent reports of their CT appearance. A 3:1 female predilection has been noted, and four types of cysts have been identified on the basis of pathologic classification: endothelial, epithelial, parasitic, and posttraumatic pseudocysts.35 A recent report of 13 new cystic adrenal masses and review of 26 benign adrenal cysts from the literature included one cystic adrenal cortical carcinoma.36 Of 37 reviewed benign cysts, 19 had mural and 7 had central calcification, 28 were unilocular, and 7 had high attenuation values. Wall thickness was 3 mm or less in 31 lesions. The authors concluded that a CT finding of a nonenhancing mass with or without wall calcification allows differentiation of an adrenal cyst from an adenoma (Fig. 105-12). A small adrenal cyst with near-water attenuation and a thin (≤3 mm) wall is likely to be benign.
Hemorrhage
Adrenal hemorrhage can be bilateral or unilateral. When bilateral, the cause is usually associated with anticoagulation therapy or a blood dyscrasia; less commonly, it is associated with the stress of surgery, sepsis, or hypotension, and, rarely, it is caused by trauma.37 Unilateral adrenal hemorrhage usually is caused by blunt abdominal trauma and involves the right gland more often than the left.38 Adrenal vein thrombosis may cause unilateral adrenal hemorrhage. This may be caused by catheterization performed to collect blood samples from the adrenal vein in patients with suspected adrenal endocrine disease.39,40 In the absence of catheterization or blunt trauma, unilateral adrenal hemorrhage into a preexisting neoplasm may occur, necessitating surgical exploration if follow-up imaging does not show a nearly normal adrenal gland.
Acute or subacute adrenal hemorrhage typically has an unenhanced attenuation value of 55 to 90 HU (Fig. 105-13). Follow-up studies show diminution in size of the adrenal mass with a gradual decrease in attenuation value.41 The high attenuation value of a recent adrenal hemorrhage is usually readily apparent on unenhanced CT but is indistinguishable from a solid adrenal neoplasm on contrast-enhanced CT. An adrenal mass detected on contrast-enhanced CT after trauma usually is assumed to be due to a hematoma, but an unrelated adrenal neoplasm can be excluded only by unenhanced CT or serial follow-up CT. Similarly, MRI may indicate hemorrhage by the high signal intensity on T1-weighted scans, reflecting the presence of methemoglobin.42,43
Nonspecific Imaging Features of Incidentally Discovered Adrenal Masses
Granulomatous Disease
Tuberculosis, histoplasmosis, and other granulomatous diseases are usually bilateral but often asymmetrical. CT findings are nonspecific and can include soft tissue masses, cystic changes, and/or calcification44 (Fig. 105-14). Although these are uncommon adrenal lesions that rarely occur unilaterally, they should be considered in the differential diagnosis of incidental bilateral adrenal masses in the absence of a primary neoplasm or coagulation abnormality. Biopsy is needed to confirm the diagnosis and identify the responsible organism.
Hemangioma
An adrenal hemangioma is a rare benign tumor. Hemangiosarcomas occur but are even less common.45 Hemangiomas comprise closely adjacent vascular channels lined with a single layer of endothelium.46 They do not produce adrenal hormones, and most are quite large when found as an incidental finding. On CT, hemangiomas are seen as large, well-defined masses. They have a soft tissue density on unenhanced images and demonstrate inhomogeneous enhancement. Most hemangiomas are calcified as the result of phleboliths within the tumor or previous hemorrhage.47
MRI findings include a hypointense appearance relative to the liver on T1-weighted sequences.48 Central hyperintensity due to hemorrhage may be noted. On T2-weighted images, hemangiomas are hyperintense. Peripheral enhancement that persists on delayed images is characteristic. Tumors are usually removed because of the risk for hemorrhage and inability to exclude malignancy.
Ganglioneuroma
A ganglioneuroma is a benign tumor composed of Schwann cells and ganglion cells. These tumors occur anywhere along the paravertebral sympathetic plexus, and approximately 20% to 30% arise in the adrenal medulla.49 Because they do not secrete hormones, most ganglioneuromas are detected as an incidental finding.50 On CT, ganglioneuromas appear as a solid adrenal mass ranging up to 11 cm in diameter.49 Extra-adrenal retroperitoneal tumors may be even larger.
Neuroblastoma
Whereas neuroblastoma is the third most common malignant tumor of childhood, it is seen much less frequently in adults. It may occur anywhere along the parasympathetic plexus. Adults are more likely than children to present with disseminated disease.51 The imaging findings of neuroblastoma in adults are similar to those in children.
Pheochromocytoma
Although most patients with pheochromocytoma present with manifestations of excess catecholamine production, approximately 10% of tumors are silent and are detected by other means such as an imaging study.52,53 The CT and MRI appearance of pheochromocytomas was described earlier.
Adenoma
Adenoma, the most common adrenal tumor, is reported as occurring in 1.4% to 8.7% of postmortem examinations, depending on the criteria used.54–56 The incidence is even higher among patients with hypertension or diabetes mellitus.55–57 Adenomas large enough to be recognized on survey abdominal CT examinations are found in approximately 1% of patients, but identification may be increasing with improvements in CT technology.58 On CT, adenomas may have the same density as normal adrenal tissue. Because most adenomas contain large amounts of intracytoplasmic lipid, many have a low density, often near that of water on unenhanced examination59 (Fig. 105-15). Calcification is rare. Adenomas enhance significantly after the intravenous administration of iodinated contrast media (Fig. 105-16). Although the degree of enhancement is not significantly different from that of other adrenal tumors, adenomas show more rapid washout of contrast than do adrenal metastases.60–62
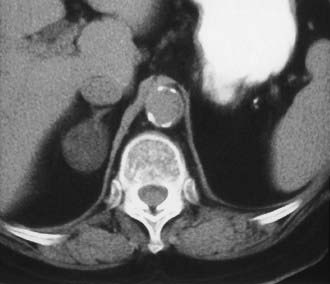
FIGURE 105-15. Lipid-rich adenoma. Right adrenal mass (3 cm) is shown on this unenhanced computed tomography (CT) scan. Attenuation value of −4 HU allows confident diagnosis of benign lesion, either cyst or lipid-rich adenoma.
(From Dunnick NR, Korobkin M: Imaging of adrenal incidentalomas: current status, Am J Roentgenol 179:559–568, 2002.)
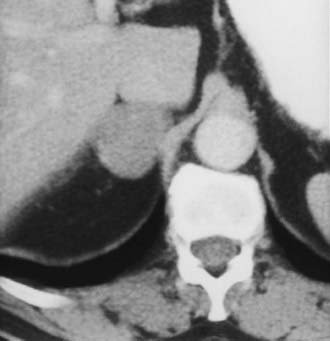
FIGURE 105-16. Adenoma. Right adrenal gland mass (4 cm) is shown on this contrast-enhanced computed tomography (CT) examination. Attenuation value on enhanced scans is not sufficiently characteristic to distinguish benign from malignant causes.
(From Dunnick NR, Korobkin M: Imaging of adrenal incidentalomas: current status, Am J Roentgenol 179:559–568, 2002.)
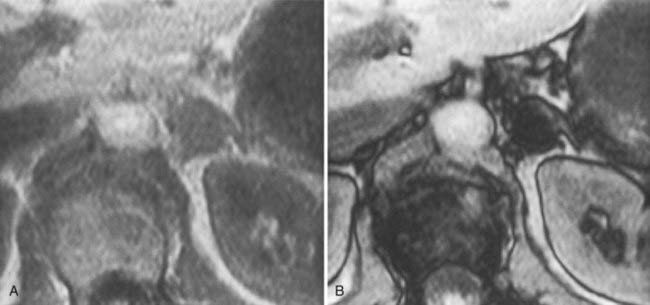
The MRI signal characteristics of adenomas are similar to those of normal adrenal tissue. Although the signal intensity of an adenoma tends to be low on T2-weighted sequences, this is not a useful way to distinguish adenomas from metastases, because an overlap of 20% to 30% has been reported with metastases. Chemical shift imaging is used to identify the intracytoplasmic lipid and can distinguish many adenomas from metastases63,64 (Fig. 105-17).
Carcinoma
Adrenal carcinoma is a rare tumor, with a reported incidence of two cases per million.65 Patients may present with abdominal pain, a palpable mass, or Cushing’s syndrome, as about 50% of these tumors elaborate unregulated amounts of cortisol. Many of these elaborate insufficient amounts of hormone to produce obvious clinical manifestations. Other endocrine manifestations of adrenal carcinoma include Conn’s syndrome, virilization, and feminization, but these are very rare. Tumors tend to be very large at the time of presentation (see also Chapter 106).
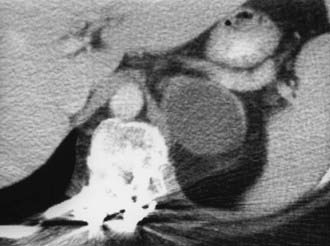
The CT appearance of an adrenal carcinoma is a large mass. Central necrosis is common, and calcification is seen in 20% to 30% of cases66,67 (Fig. 105-18A). Enhancement is heterogeneous after intravenous contrast administration. Venous extension of tumor into the left renal vein or the inferior vena cava is common and usually can be identified on contrast-enhanced images66 (Fig. 105-18B). It is important to define precisely the cephalad extent of the intravenous tumor, as this defines the point where the surgeon can gain vascular control of the tumor.68 Although this often can be done with CT, MRI may be helpful in problem cases.69 On MRI, carcinomas are usually heterogeneously hyperintense on both T1- and T2-weighted images, reflecting frequent internal hemorrhage and central necrosis. Enhancement is also heterogeneous, revealing nodular areas of intense enhancement and other areas with no enhancement. Intravenous extension of tumor typically is well seen on MRI because of the multiple planes in which data sets can be projected.69,70
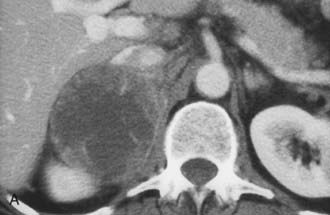
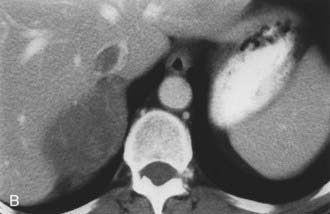
FIGURE 105-18. Adrenal cortical carcinoma. A, Contrast-enhanced computed tomography (CT) examination shows 9 cm right adrenal mass. Irregular wall and low-density center indicate necrosis. B, More cephalad image in same examination reveals tumor extension into inferior vena cava.
(From Dunnick NR, Korobkin M: Imaging of adrenal incidentalomas: current status, Am J Roentgenol 179:559–568, 2002.)
Lymphoma
Primary lymphoma of the adrenal glands is rare,71 but secondary involvement when another retroperitoneal lymphoma is present is seen more commonly among patients with non-Hodgkin’s lymphoma than among those with Hodgkin’s disease.72 Involvement is often bilateral, and other retroperitoneal disease is usually present. On MRI, lymphoma has a signal intensity lower than that of the liver on T1-weighted images. Lymphoma is typically heterogeneously hyperintense on T2-weighted sequences.
Metastases
The adrenal glands are a common site of metastatic disease, which is found in about 27% of postmortem examinations of patients with malignant neoplasms of epithelial origin.73 The most common neoplasms with adrenal metastases are carcinomas of the lung and breast, and melanoma.73,74 Small metastases are often homogeneous on contrast-enhanced CT (Fig. 105-19) or MRI, whereas large metastases often have local regions of heterogeneous appearance due to necrosis or hemorrhage or both (Fig. 105-20). Calcification is rare in adrenal metastases.
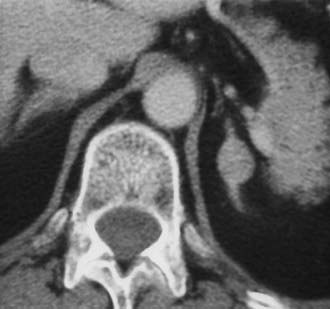
FIGURE 105-19. Metastasis from renal carcinoma in a 31-year-old woman. Small, homogeneous left adrenal mass is seen on this contrast-enhanced computed tomography (CT) examination.
(From Dunnick NR, Korobkin M: Imaging of adrenal incidentalomas: current status, Am J Roentgenol 179:559–568, 2002.)
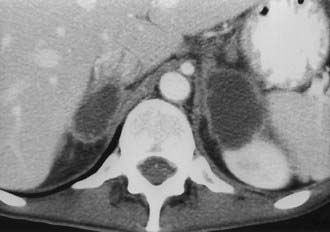
FIGURE 105-20. Necrotic metastasis from adenocarcinoma of the lung in a 34-year-old woman. Bilateral adrenal masses with areas of central necrosis are seen on this contrast-enhanced computed tomography (CT) examination.
(From Dunnick NR, Korobkin M: Imaging of adrenal incidentalomas: current status, Am J Roentgenol 179:559–568, 2002.)
ADENOMA OR METASTASIS
Although this section discusses the different methods of CT and MRI that may be used to differentiate a benign (usually adenoma) from malignant (usually metastases) adrenal masses, not all lesions or patients require an evaluation. The prevalence of adrenal adenomas is high, and small, homogeneous adrenal masses discovered incidentally are likely to be adenomas. If a patient shows evidence of metastases elsewhere and the presence of an adrenal metastasis will not alter therapy, further evaluation is not justified.
Evidence has accumulated that unenhanced CT densitometry can be used to accurately differentiate adrenal adenomas from metastases.75–77 Most adenomas have unenhanced CT attenuation values lower than those of metastases, and the scatterplot data from such studies were used to determine a threshold value that resulted in calculation of the optimal combination of sensitivity and specificity for the diagnosis of adenoma (Fig. 105-21). In an oncologic patient with an adrenal mass but no other evidence of distant metastatic disease, the goal of noninvasive diagnostic imaging is to characterize the adrenal mass as an adenoma with high specificity. With the use of pooled data from multiple published studies of calculated accuracies and corresponding threshold values of unenhanced attenuation values, it has been shown that the most optimal sensitivity (71%) and specificity (98%) for the diagnosis of adrenal adenoma results when a threshold attenuation value of 10 HU is chosen on unenhanced CT.77 Unlike unenhanced attenuation values, however, intravenous contrast-enhanced CT values show too much overlap between adenomas and metastases to allow accurate differentiation between them.76
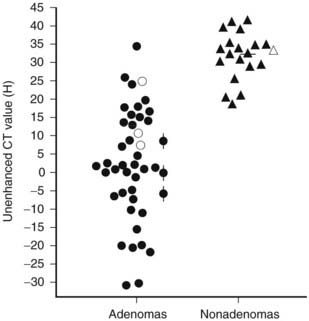
FIGURE 105-21. Scattergram of attenuation values on unenhanced CT of adrenal adenomas and nonadenomas. All masses with H values of less than 18 were adenomas. •, Nonhyperfunctioning adenomas;  , Cushing adenomas;
  , primary aldosterionism adenomas;
  , metastases;
  , pheochromocytomas;
  , cortical carcinomas.
(From Korobkin M, Brodeur FJ, Yutzy GG, et al: Differentiation of adrenal adenomas from nonadenomas using CT attenuation values, Am J Roentgenol 166:531–536, 1996.)
Evidence has accumulated that chemical shift MRI can also be used to differentiate adrenal adenomas from metastases. Taking advantage of the different resonant frequency peaks for the hydrogen atom in water and triglyceride (lipid) molecules, chemical shift MRI results in a decrease in the signal intensity of tissue containing both lipid and water in comparison with tissue containing no lipid.78 When a breath-hold gradient-echo technique is used, signal intensity loss on opposed-phase versus in-phase images indicates a mixture of lipid and nonlipid tissue that is often present in adrenal adenomas and absent in metastases. Assessment of the chemical shift change can be made via simple visual analysis or by quantitative methods using standard region-of-interest cursor measurements of the mass, and often of an adjacent reference tissue, on in-phase and opposed-phase images. Several different formulas have been proposed to measure the amount of chemical shift change and to determine optimal threshold values by analysis of scatterplot data.79
Although some investigators have used these quantitative measurements and formulas to detect the presence of lipid within adrenal adenomas, others have emphasized the advantages of simple visual analysis in detecting relative signal intensity loss on opposed-phase images of adrenal adenomas. The ability to subjectively compensate for motion and other artifacts that are superimposed over an adrenal mass and the identification of local rather than diffuse lipid are two of the advantages cited in favor of visual rather than quantitative analysis of chemical shift changes.80 Several studies have shown a similar accuracy for detecting intratumoral lipid in adrenal masses when both visual analysis and quantitative methods are used in the same patients,79–81 but recent observation suggests that quantitative methods may be more sensitive for detecting lipid in an adenoma.82 The most rigorous assessment of visual analysis of in-phase and opposed-phase imaging of adrenal masses showed a sensitivity of 78% for the detection of lipid within adrenal adenomas with a corresponding specificity of 87%.80
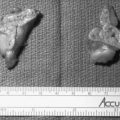
Two studies have suggested that unenhanced CT densitometry and chemical shift MRI both detect the presence and amount of lipid within adrenal adenomas. In one study of 47 adrenal masses, which all were imaged with both techniques, good inverse linear correlation was noted on MRI between the CT attenuation value and the amount of chemical shift change.83 In a histologic/radiologic study of a small number of resected adrenal adenomas that had undergone presurgical CT, chemical shift MRI, or both, good inverse linear correlation was seen between the estimated number of lipid-rich cells and the unenhanced CT attenuation value, and good linear correlation was noted with the relative change in signal intensity on opposed-phase MRI59 (Figs. 105-22 and 105-23).
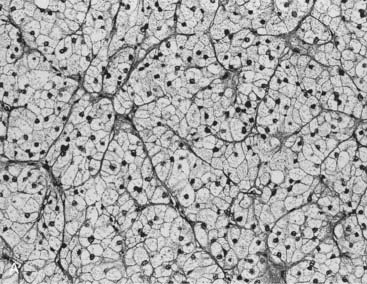
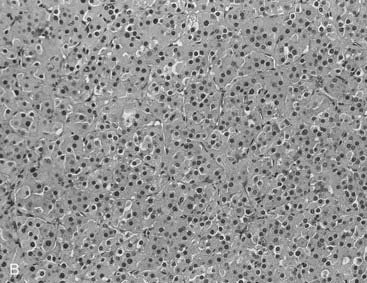
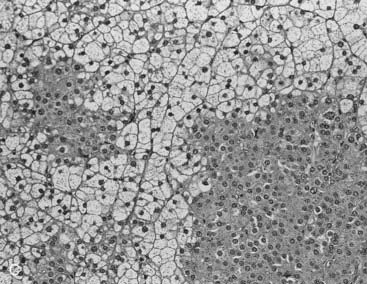
FIGURE 105-22. Histologic specimens from resected adrenal adenomas: A, Primarily of lipid-rich clear cells. B, Primarily of lipid-poor clear cells. C, Of an admixture of clear and compact cortical cells. (Hematoxylin-eosin stain, original magnification, ×200.)
(From Korobkin M, Giordano TJ, Brodeur FJ, et al: Adrenal adenomas: relationship between histologic lipid and CT and MR findings, Radiology 200:743–747, 1996.)
Related posts:
Stay updated, free articles. Join our Telegram channel

Full access? Get Clinical Tree


