Fig. 6.1
Body mass index, serum total cholesterol, serum triglycerides and serum HDL cholesterol in true normotensive (N), white coat hypertensive (WCH) and true hypertensive (H) subjects of the PAMELA population. The three conditions were diagnosed by office versus ambulatory (24 h mean values) or office versus home blood pressures. Asterisk refers to P < 0.05 (Modified from Mancia et al. [3], with permission)
6.3 White Coat Hypertension and Blood Pressure: Cross-Sectional Data
White coat hypertensives have been found to differ from true normotensives not only for a greater prevalence of metabolic risk factors but also for their higher out-of-office blood pressure values [8–10]. This is illustrated in Fig. 6.3 which shows that, compared to individuals defined as normotensive based on both office and ambulatory or home blood pressure , white coat hypertensives had, in line with the definition of this condition, an office systolic and diastolic blood pressure ≥ 140 mmHg or >−90 mmHg, respectively. However, ambulatory and home blood pressures, although lower than their upper limit of normality [11–14], were nevertheless several mmHg higher (+5/+2 mmHg and +8/+5 mmHg for the definition based on office versus ambulatory and office versus home systolic and diastolic values, respectively) than those of truly normotensive individuals. Based on the follow-up of the PAMELA population, these increases amount to a measurable greater incidence of cardiovascular as well as all-cause mortality [15].
Fig. 6.3
Office and out-of-office systolic and diastolic blood pressure (BP) values in normotensive N and WCH subjects of the PAMELA population. Data are shown separately for WCH defined by office versus ambulatory (24 h) and office versus home blood pressure. The dashed horizontal line indicates the upper level of normality for each pressure as calculated from the PAMELA data. These values are similar or only slightly lower than those recommended by European Guidelines. Symbols as in preceding figures (Modified from Mancia et al. [3], with permission)
6.4 White Coat Hypertension and New-Onset Diabetes: Longitudinal Data
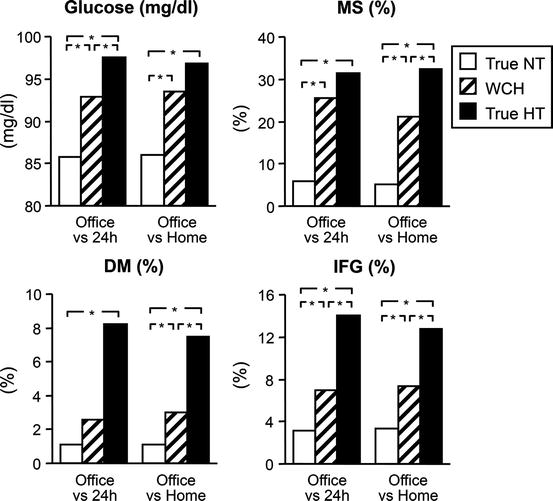
Re-examination of the PAMELA population 10 years after the first examination provided the chance to determine the long-term risk of developing diabetes (blood glucose ≥ 126 mg/dl) as well as an impaired fasting glucose state (blood glucose ≥ 100 mg/dl) in individuals with white coat hypertension vis à vis truly normotensive and hypertensive subjects [16]. As shown in Fig. 6.4, compared to true normotension, the incidence of new-onset diabetes was more than three times as large in white coat hypertensive subjects, with a three times increase in age- and gender-adjusted risk that was of the same order of magnitude of the increased risk of new-onset diabetes exhibited by truly hypertensive individuals. Similar observations were made when calculation included progression to an impaired fasting glucose state in individuals with a normal blood glucose at the first examination, the results being once again similar irrespective of whether identification of white coat hypertension was made by office versus ambulatory or office versus home blood pressure. The increase in the risk of developing diabetes was clearly visible also when data were adjusted for the antihypertensive drugs taken by the patients between the first and the second examination, to minimize the well antidiabetogenic or diabetogenic effects of some of the most commonly employed medicaments for the treatment of hypertension [17] (Fig. 6.5).
Fig. 6.4
Incidence and adjusted (for age and gender) risk of new-onset diabetes (NOD) or NOD plus an impaired fasting glucose (IFG) state in true normotensive (NT), white coat hypertensive (WCH) and true hypertensive (HT) individuals of the PAMELA population (Modified from Mancia et al. [16], by permission). P < 0.05. Numbers in parenthesis refer to 95 % confidence intervals
Fig. 6.5
Age- and gender-adjusted risk of new-onset diabetes in truly normotensive, WCH and truly hypertensive subjects before and after further adjustment for use of antihypertensive drugs. Symbols as in preceding figures (Modified from Mancia et al. [16], with permission)
6.5 White Coat Hypertension and New-Onset Hypertension: Longitudinal Data
Replication of the observations made 10 years before also allowed to investigate whether individuals with white coat hypertension of the PAMELA population had a different risk of progressing to true hypertension, i.e. moving to both an in- and out-of-office BP elevation, than true normotensive subjects [18]. The results are shown in Figs. 6.6, 6.7, and 6.8. Figure 6.6 shows that in more than 50 or 60 % of truly normotensives, the blood pressure status remained stable, whereas in the remaining one it worsened and moved subjects into the white coat hypertension, masked hypertension (normal office and high out-of-office blood pressure) or true hypertension categories. This was the case also in white coat hypertensives, about 20 % of which improved and became truly normotensives. Compared to truly normotensives, however, white coat hypertensives showed a much greater incidence of progressing to in- and out-of-office hypertension, regardless whether its definition (1) was based on office versus ambulatory or office versus home blood pressure and (2) out-of-office hypertension separately considered an elevation of ambulatory and home blood pressure in line with other findings [19, 20]. The increase in the adjusted risk of true hypertension exhibited by white coat hypertensive subjects ranged from more than two to more than three times that of true normotensive subjects, which indicated a substantial elevation over the background risk of the true normotensive population (Fig. 6.7). The results were not modified by limiting the analysis to the population that did not take antihypertensive drugs over the follow-up period, excluding a confounding effect of between group differences in blood pressure lowering interventions on the results (Fig. 6.8).
Fig. 6.6
Change of blood pressure (BP) status over the 10-year period from the first to the second examination in truly normotensive (NT) and WCH subjects. Definition of the two conditions is based on office versus ambulatory (24 h) or office versus home BP. HT hypertension. Other symbols as in preceding figures
Fig. 6.7
Progression to in- and out-of-office HT in true NT and WCH subjects over a 10-year period. The upper panel shows the 10-year incidence of (1) office + ambulatory HT in subjects with entry NT or WCH based on office BP elevation and ambulatory BP normality and (2) office + home HT in subjects with entry NT or WCH based on office BP elevation and home BP normality. The lower panel shows the age- and gender-adjusted risk of developing one or the other condition taking NT as reference. Definition of home and ambulatory blood pressure elevation was based on previous analysis of the PAMELA data. Numbers in parenthesis refer to 95 % confidence intervals. Other symbols as in preceding figures
Fig. 6.8
Age- and gender-adjusted increase in risk of developing true hypertension in truly NT and WCH subjects, after exclusion of patients under antihypertensive drug treatment. Symbols as in preceding figures (Modified from Mancia et al. [18], with permission)
6.6 Factors Involved in the Increased Risk of New-Onset Diabetes and True Hypertension of White Coat Hypertensives
Because white coat hypertensive subjects have higher blood glucose and out-of-office blood pressures (Figs. 6.2 and 6.3) than truly normotensive subjects, their greater incidence and risk of developing diabetes or true hypertension might be explained by a shorter distance of these values to the thresholds defining these two conditions. However, compared to truly normotensives, the increase of blood glucose that occurred over the 10-year period between the first and the second examination was significantly greater in white coat hypertension both when diagnosed by office versus ambulatory and when diagnosed by office versus home blood pressure (Fig. 6.9) [16]. This was the case also for the ambulatory or home increases of systolic blood pressure which were associated with a much greater increase in out-of-office pulse pressure as well (Fig. 6.10) [18]. Thus, in addition to the contribution of initially greater blood glucose and out-of-office blood pressure values, the much greater risk of developing diabetes and true hypertension exhibited by white coat hypertensive individuals also depends on a greater tendency to adverse modifications of their metabolic and blood pressure profile. Their much more marked increase in pulse pressure further suggests that the adverse modifications include a greater progression of arterial stiffening, i.e. a large artery alteration with documented prognostic significance both for the development of isolated systolic hypertension [21] and for the incidence of fatal or nonfatal cardiovascular events [22]. It is likely that in white coat hypertensive subjects, a more pronounced increase of arterial stiffness reflects a tendency to a greater worsening of organ damage in general because, compared to true normotensive subjects, individuals with white coat hypertension also showed a greater increase of left ventricular mass index and incidence of echocardiographic left ventricular hypertrophy, the increased risk being only slightly less than the one of true hypertensives (Fig. 6.11) [23].
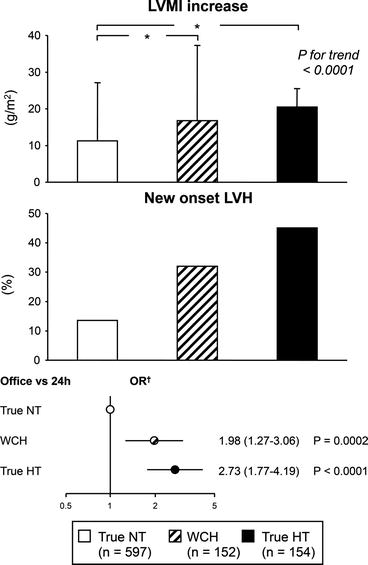
Fig. 6.9
Ten-year increase of plasma glucose in true NT and WCH subjects of the PAMELA population. Definition of WCH was based on office versus ambulatory or office versus home BP. Symbols as in preceding figures (Modified from Mancia et al. [16], with permission)
Fig. 6.10
Ten-year increase of out-of-office systolic (S) BP and pulse pressure in true NT and WCH subjects of the PAMELA population. Definition of WCH was based on office versus ambulatory BP data. Other symbols as in preceding figures (Modified from Mancia et al. [18], with permission)
Fig. 6.11
 Neurogenic and Non-neurogenic Mechanisms of White-Coat Hypertension
White Coat Hypertension and Cardiovascular Morbidity and Mortality
White Coat Hypertension and Target Organ Damage
White Coat Hypertension: Definition, Terminology and Prevalence
White Coat Hypertension: To Treat or Not to Treat
Diagnostic Approach to White Coat Effect and White Coat Hypertension
Neurogenic and Non-neurogenic Mechanisms of White-Coat Hypertension
White Coat Hypertension and Cardiovascular Morbidity and Mortality
White Coat Hypertension and Target Organ Damage
White Coat Hypertension: Definition, Terminology and Prevalence
White Coat Hypertension: To Treat or Not to Treat
Diagnostic Approach to White Coat Effect and White Coat Hypertension


Ten-year increases of left ventricular mass index (LVMI), incidence of new-onset left ventricular hypertrophy (LVH) and adjusted (for age and gender) risk of new-onset LVH in true NT, WCH and true hypertensive HT subjects of the PAMELA population over a 10-year time interval. Definition of the three conditions was based on office versus ambulatory (24 h) BP. OR odds ratio. Numbers in parenthesis refer to 95 % confidence intervals. Other symbols as in preceding figures data were collected via echocardiographic examinations (Modified from Zanchetti and Mancia [23], with permission)
Related posts:
Neurogenic and Non-neurogenic Mechanisms of White-Coat Hypertension
White Coat Hypertension and Cardiovascular Morbidity and Mortality
White Coat Hypertension and Target Organ Damage
White Coat Hypertension: Definition, Terminology and Prevalence
White Coat Hypertension: To Treat or Not to Treat
Diagnostic Approach to White Coat Effect and White Coat Hypertension
Stay updated, free articles. Join our Telegram channel
Full access? Get Clinical Tree
