Fig. 4.1
Timing of the maximal increase in both systolic and diastolic finger blood pressure during the physician’s visit. Vertical bars indicate number of subjects showing a maximal blood pressure increase during the 15-minute visit; arrows, timing of cuff blood pressure measurements by the physician (Taken from Parati et al. [10] with permission)
4.3 Influence on the Magnitude of the WCE by the Method Employed for Its Calculation, i.e.; by Use of Continuous or Intermittent BP Monitoring
A precise quantification of the pressor reaction triggered in the patient by physician’s presence, commonly known as “WCE,” needs implementation of continuous beat-to-beat BP recordings before, during, and after the medical visit. After the introduction in clinical practice of noninvasive techniques for intermittent out-of-office BP monitoring, the difference between office and average daytime ambulatory or home BP values was proposed as an alternative, indirect measure of the WCE, although this proposal faces important limitations (see Chap. 2) [4].
It was also assumed that the condition characterized by a persistently high BP in the clinic environment and a persistently normal BP in ambulatory daily life conditions, commonly referred to as “white-coat hypertension,” could reflect the persistence over time of an alerting reaction to the physician’s visit [4]. However, the evidence to support the concept that the difference between office and ambulatory daytime BP values specifically reflects the BP rise induced in the patient by the medical environment is limited and inconsistent. Indeed, the findings obtained by several studies comparing direct and indirect measures of the white-coat effect have shown limited [8] or no correlation [9–11] between these methods. One of such studies exploring how much direct measures of the WCE, obtained by means of continuous, noninvasive BP recordings, were related with the clinic-ambulatory daytime BP difference showed no correlation between the direct and indirect measures of the WCE performed using these two approaches, respectively [10]. The clinic-ambulatory daytime BP difference did correspond only to less than 30 % of the peak BP increases continuously measured at the w’s visit.
Overall, this study indicated that the difference between office and ambulatory daytime BP values is unrelated to the magnitude of the WCEs and does not necessarily reflect the alarm reaction to the medical visit [10]. The substantial discrepancies observed in this study suggested that although the alarm reaction may somehow contribute to the magnitude of the clinic-ambulatory BP difference, it might be largely influenced by mechanisms and predisposing factors other than those causing the alarm reaction (e.g., the degree of physical activity during daily life).
The type of BP measurements from which different indices of the WCE are derived may indeed importantly influence the estimation of this phenomenon. In the case of direct assessment, BP reactivity to the physician is precisely quantified both in its size and duration, taking the BP levels recorded under the standardized resting condition preceding the physician’s visit as a reference. Conversely, in case of the surrogate approach based on the clinic-daytime BP difference, the magnitude of the “surrogate” WCE depends on the difference between BP levels assessed during the visit and in daily life conditions. In fact, observations from several studies have raised the possibility that variables known to affect daytime BP levels, such as psychosocial, behavioral factors, varying degrees of physical activity, variable wake and sleep time periods, and stressful conditions occurring in daily life, may be more important determinants of the clinic-ambulatory daytime BP difference than the alerting reaction triggered by the medical visit [10, 12, 13].
Interestingly, it has been suggested that subjects with a pronounced WCE also display a more pronounced BP response to physical activity during daily life conditions and may thus experience greater BP variability during daytime activities than in the doctor’s office as a consequence of an enhanced BP reactivity to daily stress [12] (Fig. 4.2).
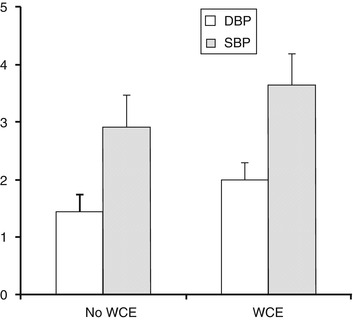
Fig. 4.2
Blood pressure (BP) response to an increase in mean physical activity in the 10 min preceding BP measurement of 1 log unit for subjects with and without a white-coat effect. For systolic BP (SBP), P < 0.03; For diastolic BP (DBP), P < 0.02; WCE, white coat effect (Taken from Leary et al. [12] with permission)
Other reports have also indicated that a “WCE” could be indirectly assessed by the presence of a pronounced rise in BP in the so-called white-coat window of an ABPM recording, with BP values being characteristically higher during the first and/or the last hour of a 24-h ABPM (i.e., during those hours when patients are in the hospital environment for fitting or removal of the BP recorder) compared to the remaining hours of the day and night [14, 15] (Fig. 4.3).
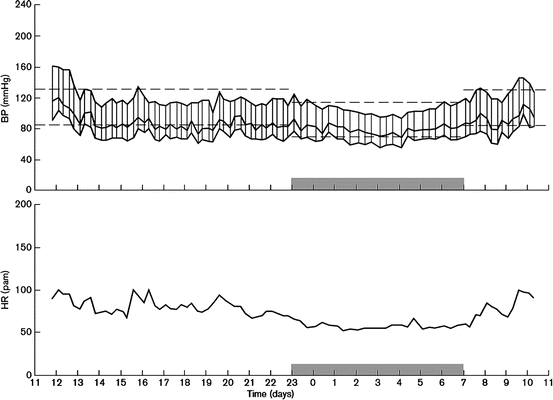
Fig. 4.3
Noninvasive discontinuous ambulatory blood pressure recording showing pronounced blood pressure reactivity in the first and last hours (hospital environment) and normal blood pressure behavior throughout the remaining portion of the recording. BP blood pressure, HR heart rate (Taken from Parati et al. [47] with permission)
It is also likely, as mentioned above, that the size of the “real” WCE might reflect the features of a more generic BP and heart rate responsiveness to daily life stress, outside of the laboratory environment. In other words, subjects who are hyperreactive to the physician’s visit might also be hyperreactive to daily life stress, leading to higher daytime BP levels and thus, at variance from the assumptions underlying the adoption of the surrogate method for assessing WCE based on clinic-daytime BP difference, being associated with a smaller, rather than a wider, clinic-daytime BP difference. Evidence on this regard has been provided by some studies (although not by all) showing that subjects with more pronounced direct measures of WCE also displayed increased daytime ABP levels and a higher level of 24-h average urinary epinephrine [11]. A further reason against the use of the clinic-daytime BP difference as a surrogate measure of WCE comes from the observation that, in different subjects, daytime BP levels may be differently influenced by the variable occurrence of physical activity, challenging emotional conditions, and periods of quiet rest during waking hours [11].
Finally, it should be considered that also errors in the BP measurement technique during the medical visit such as use of very small cuffs in obese subjects, fast deflation rates, measuring BP without the patient having rested enough, cigarette smoking, or coffee intake before the office measurements may cause overestimation of BP levels during the medical visit, thus increasing the magnitude of the white-coat effect. Conversely, the magnitude of the “surrogate” white-coat effect has been shown to be diminished if office BP is recorded with strict adherence to guidelines for proper BP measurement [16].
4.4 Role of the Person Who Conducts the Medical Visit: Physician vs. Nurse BP Measurements
The marked differences in the magnitude of the BP response to the medical visit and the absence of significant differences in clinical and demographic characteristics such as age, sex, and average 24 h BP levels explaining this interindividual variation [1] led to investigate the role of other potential contributing factors for this phenomenon. With the aim of assessing the relative contribution of the person who conducts the medical visit, one of these studies explored whether the alarm reaction would be attenuated if a nurse instead of a physician would be in charge of the visit and the related BP measurement. To this aim, researchers implemented 48 h beat-to-beat BP recordings in concomitance with two separate visits, one conducted by a doctor, the other by a nurse. Authors clearly showed a significantly much lower and more transient BP reaction when the visit and BP measures were performed by a nurse rather than by a doctor [17] (Fig. 4.4).
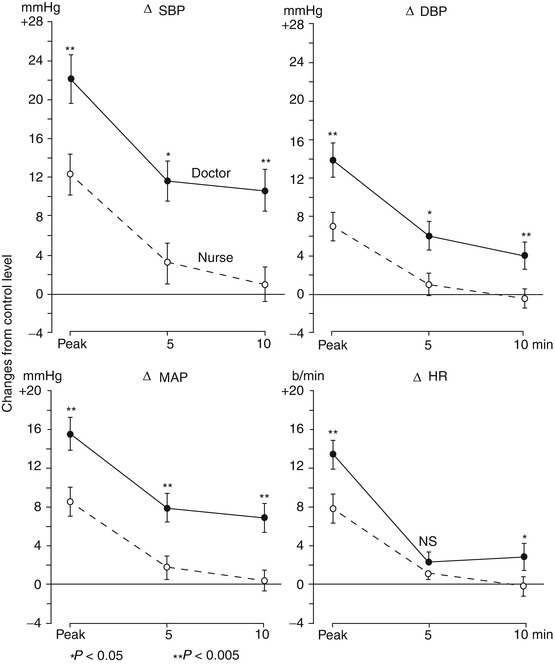
Fig. 4.4
Comparison of maximum (or peak) rises in systolic blood pressure (SBP), diastolic blood pressure (DBP), mean arterial pressure (MAP), and heart rate (HR) occurring in 30 hospitalized subjects during a physician’s and a nurse’s visits. The rises occurring at the 5th and 10th minutes of the visits are shown. Data are expressed as mean (±SEM) changes from a control value taken 4 min before each visit (Taken from Mancia et al. [17] with permission)
Also the BP response to automated BP measures triggered by the patient itself has been explored in other studies. While in studies implementing intra-arterial, continuous BP recordings in parallel to self-BP measurements performed by patients no alerting reaction was observed when it was the patient who triggered cuff inflation [7], other studies using intermittent 24 h ABPM have shown that even if the patient is alone and records BP by activating an automated sphygmomanometer, there may still be some alerting reaction although lower than that triggered by the presence of a physician or a nurse [18].
4.5 Does the Number of Medical Visits Influence the Magnitude of the WCE?
It has been postulated that when the patient becomes more familiar with the clinic environment or with the presence of the physician, the magnitude of the pressor response during repeated medical visits would tend to decrease. To address this question, different studies have been conducted implementing different BP measurement methodologies. One of these studies specifically explored whether the magnitude of the “true” WCE attenuates when the physician’s visit is repeated several times (i.e., four consecutive visits repeated over a 48-h intra-arterial recording period) showing that the peak mean BP and heart rate increases that occurred in the early part of the physician’s first visit (22.6 ± 1.8 mmHg and 17.7 ± 1.7 beats/min) remained of comparable magnitude during the three subsequent visits performed by the same physician throughout the 2 days of intra-arterial BP monitoring. Also the less pronounced pressor and tachycardic responses observed in the last part of the physician’s visit were virtually identical among the four visits. This study thus indicated that the BP response to the medical visit does not easily fade away and that overestimation of BP inherent in cuff BP measurement by a physician cannot be avoided by repeated visits by the physician over a short time span [17] (Fig. 4.5).
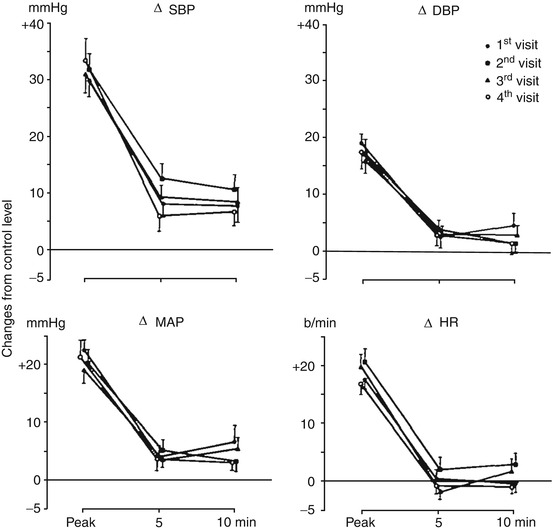
Fig. 4.5
Maximum (peak) rises in systolic blood pressure (SBP), diastolic blood pressure (DBP), mean arterial pressure (MAP), and heart rate (HR) occurring in 16 subjects during four visits by a physician. The peak rises occurred between the 2nd and 4th minute from the beginning of the physician’s visit. The rises occurring at the 5th and 10th minute of the visits are also shown. Data are represented as mean changes (±SEM) from a control value taken 4 min before each visit of the physician (Taken from Mancia et al. [17] with permission)
At variance from studies implementing intra-arterial BP recordings to detect day-by-day changes in BP levels, other studies have explored the BP response to successive medical visits performed over wider time windows. One of such studies explored the BP response in subjects with mildly elevated BP levels over 12 consecutive medical visits in which BP readings were performed in duplicate. While during visits 1–3 BP showed a systematic decrease which varied from patient to patient (on average by 15/7 mmHg) [19], during visits 4–12 no further systematic changes in BP levels were observed. After visit 4, the chance of a clinic-daytime BP difference of ≥5 mmHg was 0.50 and 0.32 for systolic and diastolic BP, respectively, which was further reduced by increasing the number of visits to six or more. Although this reduction in office BP with subsequent visits might be ascribed to a reduction in the alerting reaction, it is likely that other factors such as a regression to the mean phenomenon, a placebo or a nocebo effect, may also have played a role [20].
4.6 Is It the Doctor’s Office or the Clinical Environment That Causes the WCE?
On the background of the evidence showing that BP readings in the doctor’s office are frequently higher than home or ambulatory BP values, several studies have been conducted with the aim of better clarifying the relative contribution of the physician in the etiology of the “WCE.” In one of such studies, standard readings taken by the family physician were compared with readings obtained by an automated BP recording device, with the patient alone in the examining room, during the same office visit [21]. While, self-measurement of BP by the patient in the physician’s office did not reduce the magnitude of the white-coat effect [21], a further report by the same authors showed that the white-coat effect was virtually eliminated if office BP readings were obtained through use of automated BP measurement in the office waiting room [15]. It was thus clear that even in the absence of the physician, the medical office itself may trigger an important pressor response in the patient, which is clearly higher than that occurring while the patient is seated in the office waiting room.
In another study, resting BP measures taken in a nonmedical setting (i.e., a laboratory room) by a research assistant were compared with the BP values obtained at rest and by the same researcher on a different day in the physician’s office. Both sets of resting BP values were also compared with ABP values obtained during daytime activities. Compared to BP measures obtained in the clinical environment (even before the patient had seen the physician), resting BP readings obtained in a nonmedical setting were shown to be significantly lower. These findings were consistent both in normotensive and in hypertensive subjects. Consequently, the difference between clinic BP values taken by the physician and those taken in a nonclinical environment was significantly higher than the differences between BP values measured by the research assistant in the clinic when the patient was waiting to see the doctor and those obtained out of the medical environment [22].
In the same line, a study exploring the difference between self-BP measurements obtained at home and in a clinic environment showed that self-BP measures obtained in the clinical setting were higher than self-measured BP levels obtained by subjects at home, suggesting that the setting where BP is taken may be a more important contributor to the BP response during a doctor’s visit than the subject who is in charge of the measurement [23]. Taken together these findings indicate that the WCE may characterize not only the time period when the patient actually sees the physician but also the entire period spent in a clinic setting.
4.7 Responses to Physical and Mental Stress as Predictors of the White-Coat Effect
An increased cardiovascular reactivity to stress in a given subject might predict elevation of BP levels during the medical visit. Based on this assumption several studies have been conducted in order to test if a higher BP response to active physical activity (i.e., dynamic or static exercise), passive physical stress (i.e., cold pressure test), or mental stress (i.e., as evoked via a problem of mathematical, technical, or decisional nature) in the laboratory setting is associated with a tendency of BP to increase during the medical visit. In one of such studies, mental (i.e., mental arithmetics and the mirror drawing test) and physical stress tests (i.e., cold pressor test and handgrip test) were performed along with 24 h ambulatory beat-to-beat intra-arterial BP recordings in a group of essential hypertensive patients and normotensive controls [24]. Whereas all stressors induced a significant increase in BP levels, the elevation in BP levels elicited by most of these laboratory stressors was not correlated with the BP or heart rate response to the doctor’s visit, excepting a marginal relationship between the BP response to the mirror drawing test and the WCE [24]. Neither the pressor responses to laboratory stressors nor to the medical visit were correlated with the 24-h absolute or percent blood pressure variabilities (Fig. 4.6).
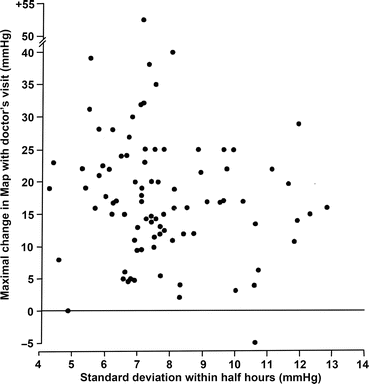
Fig. 4.6
Lack of relationship between pressor response to doctor’s visit and 24 h mean arterial pressure variability. Short-term BP variability was assessed from intra-arterial beat-to-beat BP recordings performed over 24 h as the average of the standard deviations obtained for each half hour of the recordings (within half-hour absolute and percent variability) (Taken from Parati et al. [24] with permission)
Overall, these studies indicated that the cardiovascular reactivity to laboratory tests is not a significant predictor of the BP response to the medical visit [24].
Along the same line other studies have indicated that the BP response to the laboratory tests is not a good predictor of the changes in BP occurring during real-life stressing situations since everyday physical activities, as well as outdoor and sport activities, differ in many respects from laboratory stress testing, so that a direct comparison cannot be made [25].
In another study investigating a possible relationship between the BP response to stressors and the magnitude of the WCE (as assessed by means of continuous BP recordings in concomitance with the medical visit), contrasting results were reported between normotensive and hypertensive subjects [26]. While in normotensive subjects, the WCE effect was very small and not correlated with the responses to stress and standing, hypertensive subjects showed an enhanced BP response to orthostatic and mental stress (i.e., the color-word Stroop test) which was significantly correlated with the magnitude of the WCE [8, 26].
Other reports in essential hypertensive subjects have shown that mental stimuli known to increase BP levels such as talking and counting loud are correlated to the magnitude of the white-coat effect, likely as a consequence of the emotional content of communication between patient and physician during the medical visit [27]. In the same line other studies have shown that subjects presenting the WCE are characterized by an exaggerated response to psychosocial stimuli such as speaking in public [11].
Although the WCE might reflect an impaired cardiovascular autonomic modulation and a higher degree of BP fluctuations in response to challenging situations, the contrasting results reported by different studies prevent from deriving consistent conclusions in this regard.
These discrepant results regarding the relationship between the BP response to stressors and the WCE may in part be due to the poor reproducibility of the pressor response to different stressors but also to the different type of tests employed in different studies. Indeed, the responses to the “mental” and “physical” stressors have been shown to be unrelated, suggesting that these tests may selectively evaluate specific cardiovascular responses [28], i.e., while public speaking might more likely reflect the BP response associated with emotional or psychological stress, other tests such as hand grip and cold exposure might reflect a more “physical” cardiovascular response to stressors (Table 4.1).
Table 4.1
Regression coefficients (b) between mean arterial pressure (MAP) or heart rate (HR) responses to different laboratory stressors
Mental arithmetic test | Mirror drawing test | Handgrip | ||
|---|---|---|---|---|
MAP responses | ||||
Mental arithmetic test | b | − | ||
r 2 | ||||
Mirror drawing test | b
Related posts: White Coat Hypertension and Cardiovascular Morbidity and Mortality
White Coat Hypertension and Target Organ Damage
White Coat Hypertension: Definition, Terminology and Prevalence
White Coat Hypertension, Metabolic Risk Factors and Cardiovascular Risk Profile
White Coat Hypertension: To Treat or Not to Treat
Diagnostic Approach to White Coat Effect and White Coat Hypertension White Coat Hypertension and Cardiovascular Morbidity and Mortality
White Coat Hypertension and Target Organ Damage
White Coat Hypertension: Definition, Terminology and Prevalence
White Coat Hypertension, Metabolic Risk Factors and Cardiovascular Risk Profile
White Coat Hypertension: To Treat or Not to Treat
Diagnostic Approach to White Coat Effect and White Coat Hypertension
Stay updated, free articles. Join our Telegram channel
Full access? Get Clinical Tree
 Get Clinical Tree app for offline access

| |||