Fig. 2.1
Original finger blood pressure and heart rate tracing showing the pressor and tachycardic effects of the physician’s visit in a representative subject. The segment of blood pressure and heart rate tracing between vertical bars corresponds to the time of physician’s visit (Taken from Parati et al. [25] with permission)
This study also provided direct and precise quantification of the magnitude of the WCE showing on average a peak increase in systolic and diastolic intra-arterial BP during the physician’s visit of 27 and 14 mmHg in a group of hypertensive patients. The magnitude of this WCE phenomenon also showed a high degree of interindividual variations (ranging from 4 to 75 mmHg in SBP and from to 1 to 36 mmHg for DBP) [1]. See Fig. 2.2.
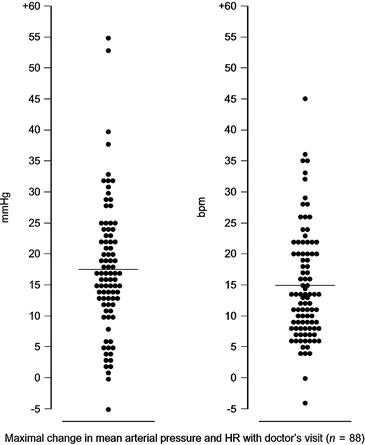
Fig. 2.2
Peak increase in intra-arterial mean arterial pressure (MAP, left) and heart rate (HR, right) in 88 patients during a visit by a physician measuring blood pressure with a sphygmomanometer. The intra-arterial blood pressure and heart rate values observed during the physician’s visit were compared with those observed 4 min before the visit. Data are shown for individual patients (points) and as average changes for the group as a whole (horizontal lines) (Taken from Mancia et al. [1] with permission)
This wide between-subject variability in the size of the WCE was not entirely explained by differences in demographic characteristics of recruited subjects (i.e., age, sex) nor by differences in average 24-h BP levels or in the degree of spontaneous 24-h BP variability, indicating that the degree of BP response to the medical visit is largely unpredictable in the individual subject [1].
A further study, exploring the effects on intra-arterial BP and heart rate of four repeated visits performed by the same physician over a 48-h period, showed no significant differences in the average BP peaks observed during the four visits. The absence of a consistent attenuation in the magnitude of the WCE when the patient was repeatedly visited by the same doctor seems to suggest that no reduction in the error of overestimation of OBP can be expected with the simple repetition of the physician’s visit, at least within relatively short time windows [2] (see Fig. 2.3).
Fig. 2.3
Peak changes in intra-arterial systolic blood pressure (ΔSBP) diastolic blood pressures (ΔDBP), mean arterial pressure (ΔMAP), and heart rate (ΔHR) during a physician’s visit in 46 hypertensive patients. Data are separately shown for four consecutive visits by the same physician performed over a 48-h period (Modified from Mancia, et al. [2] with permission)
However, in the same report, the peak BP and heart rate increases observed during the visit were significantly less if a nurse, rather than a physician, was in charge of BP measurement (Fig. 2.4).
Fig. 2.4
Intra-arterial systolic (S) blood pressure changes induced during the visit by a doctor and a nurse. Data are shown as average values ± SE from 35 patients. Values obtained at the time of maximal changes (peak), after 5 and 10 min since the beginning of the visit, are separately shown (Taken from Mancia et al. [2] with permission)
Further studies also provided important evidence to better characterize the nature of the WCE, showing that intermittent automated or semiautomated (i.e., triggered by the subject) cuff inflations do not trigger an alerting reaction and pressure rise, at variance from what is induced by a physician’s visit, and thus do not overestimate actual subject’s BP values [10]. This was elegantly demonstrated in a study performing intra-arterial continuous BP recordings in a group of hypertensive patients in whom BP levels were concomitantly measured automatically by a noninvasive oscillometric BP monitoring device programmed to measure BP levels every 10 min during 2 h, after which semiautomated BP measures were performed for other 2 h (i.e., cuff inflations were triggered by patient’s command at 10-min intervals). As shown in Figs. 2.5 and 2.6, cuff inflations, either automated or semiautomated, were not associated with an increment in intra-arterial BP levels neither before, during, nor after oscillometric BP measurements, except perhaps for the first few measurements only. This finding was evident not only when data were averaged but also when individual measurements were considered separately, showing that the WCE is not due to arm cuff inflation per se, but to the presence of a physician performing the measurement. This demonstration provides important information to exclude any increase in BP levels during noninvasive ambulatory BP monitoring, in response to repeated cuff inflations.
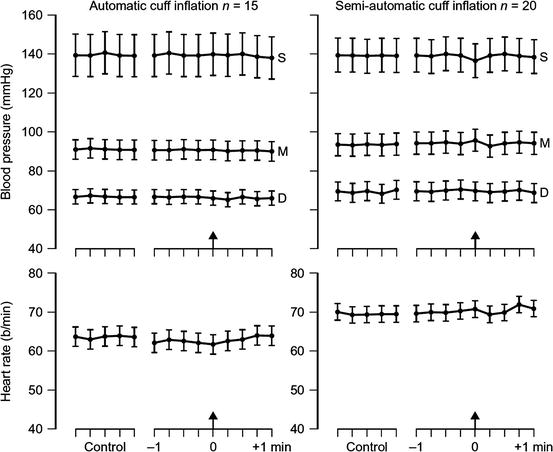
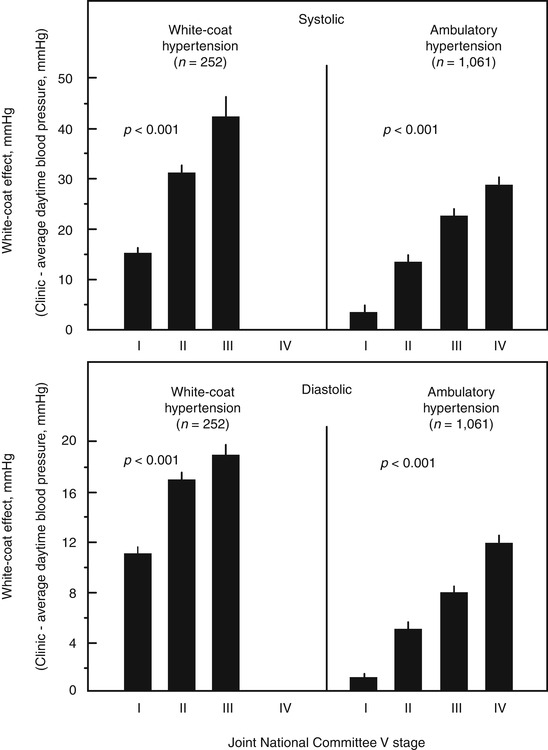
Fig. 2.5
Intra-arterial blood pressure and heart rate values obtained in 15 patients at the time of automatic blood pressure measurements and in 20 patients when the cuff inflation was triggered by the patient himself. Data are shown as average values ± SEM for 10-s segments of the intra-arterial tracing taken 5 min before cuff inflation and during the 1-min period immediately preceding and following cuff inflation. Arrows refer to the time of cuff inflation. S systolic blood pressure, D diastolic blood pressure, M mean arterial pressure (Taken from Parati et al. [10] with permission)
Fig. 2.6
Original intra-arterial blood pressure recordings performed in a representative subject at the time of noninvasive blood pressure measurements in which cuff inflation was started automatically (upper panel) or was self-triggered by the patient (semiautomatic measurement, lower panel). Arrows refer to the time of cuff inflation (Taken from Parati et al. [10] with permission)
Subsequent studies, although employing different BP measurement techniques (i.e., discontinuous ambulatory BP monitoring), provided additional evidence that the WCE may characterize not only the period when the patient actually sees the physician but also the entire period spent in a clinic environment [11, 12], indicating that the setting where BP is measured may be a more important contributor to the BP response during a doctor’s visit than the subject who is in charge of the measurement.
Although a direct and precise quantitative estimation of the magnitude of the WCE was originally performed by implementing intra-arterial beat-to-beat BP recordings, the ethical concerns associated with the invasive character of this approach (risks and inconveniences to the patients) prevented its routine implementation for large-scale human research or for use in clinical practice.
In the early 1970s, new approaches for noninvasive beat-to-beat BP monitoring were developed based on the principle of vascular unloading. This approach, originally described by Penaz [13], makes use of a small cuff wrapped around a finger of the hand, which contains an infrared photoplethysmograph and is connected to a computer-operated proportional pneumatic valve, a source of compressed air and an electropneumatic transducer. This device was later improved by Wesseling and coworkers in Amsterdam, resulting in a BP monitor called Finapres (from Finger Arterial PRESsure, Ohmeda, CO) [14]. In a number of validation studies, this device was shown to provide BP values close to those simultaneously obtained through intra-arterial recordings, during anesthesia as well as at rest or under laboratory tests known to induce rapid and often marked BP changes [15].
A portable version of this device is now also available, named Portapres (TNO, Amsterdam), which allows continuous noninvasive BP monitoring in ambulant subjects, all over 24 h, with acceptable accuracy [16] (Fig. 2.7).
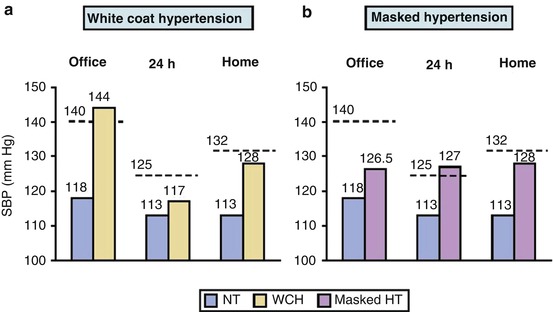
Fig. 2.7
Original ambulatory blood pressure recordings simultaneously obtained in the same subjects with the intra-arterial method (upper tracing) and with the Portapres device (lower tracing). Vertical bars at the bottom of Portapres tracing refer to between-finger shifts at 30-min intervals (Taken from Imholz et al. [16] with permission)
Although several studies implementing noninvasive, beat-to-beat BP recordings at the finger level before, during, and after the medical visit showed the ability of this approach to provide a direct and reliable measure of the WCE [17–19], the costs and technical complexity of these systems prevented their routine use in clinical practice, confining them to a research setting.
2.3 Indirect Assessment of the WCE from Intermittent Ambulatory BP Recordings
All the limitations associated with direct assessment of the WCE based on beat-to-beat BP recordings (either invasive or non invasive) stimulated the development of alternative, noninvasive, and simpler approaches for obtaining at least an indirect estimation of the WCE. Following the introduction of ABPM in clinical practice, some authors proposed the straightforward calculation of the difference between BP levels measured in the office and average daytime ambulatory BP values measured out of the clinic environment [20] as a means to estimate the magnitude of the WCE (“surrogate” WCE). Alternative methods based on ABPM only were also proposed which define the WCE as the difference between the average of all daytime readings (reflecting awake BP outside the medical setting) and the average of BP measures performed during the first or last hour of the ABPM recording (reflecting BP levels in the office, at the time of device application or removal, respectively) (“ambulatory” WCE) [21].
2.3.1 Assessing the WCE from the Combined Use of Office and Ambulatory BP Measures: The “Surrogate” WCE
The idea that the pressor response to the medical environment could be measured by means of ABPM without necessarily implementing continuous BP recordings was based on the abovementioned evidence provided by several studies showing that intermittent cuff inflations during noninvasive ambulatory BP monitoring do not trigger the alerting reaction and pressure rise induced by a physician’s visit and thus do not overestimate subject’s actual BP values [10]. This was further supported by the observation that in general BP measurements obtained out of the office during patient’s daily life are significantly lower than those measured in the clinic or office environment [11]. However, while in the case of its direct assessment, BP reactivity to the physician’s presence is precisely quantified both in size and duration, taking the BP levels recorded under the standardized resting conditions preceding the physician’s visit as a reference; in the case of the surrogate approach, based on the clinic-ambulatory daytime BP difference, important methodological problems are to be anticipated. On one hand, clinic BP is quantified from the average of a limited number of readings (usually 1–3), with the risk of poor reproducibility of the values obtained. On the other hand, ambulatory BP measures are not performed at the moment of the clinical visit and cannot precisely reflect either the basal BP levels immediately before the start of the visit or the BP changes occurring during the medical visit. In addition while, at variance from OBP, ambulatory BP levels are not influenced by the alerting reaction (excepting the first or last hour of the recording when the patient is in the clinical environment for fitting and removing the ABPM device respectively), they are instead importantly influenced by different factors modulating blood pressure values in daily life, such as the degree of physical activity [22, 23] and other environmental stimuli. These factors affecting ambulatory BP may indeed be largely responsible for the office-daytime BP difference, more than the effects on OBP by the alerting reaction to the doctor’s visit. In view of the important methodological differences between direct and indirect methods for estimation of the WCE, it is thus not surprising that large discrepancies were reported in literature between these methods for estimating the WCE [24–26].
Indeed, studies comparing direct measures of the “real” WCE (i.e., as assessed by means of continuous, noninvasive BP recordings during a doctor’s visit) with the clinic-ambulatory BP difference have shown limited [19] or even lack of correlation between these estimates [25, 17]. Significant discrepancies between these measures were shown in one of these studies, in which clinic-ambulatory BP difference corresponded to less than 30 % of the peak finger beat-to-beat BP increases directly recorded during the physician’s visit [25]. Moreover, this difference has been shown to correlate directly with baseline clinic BP, but inversely with baseline ambulatory BP [26], while no significant correlation has been reported between the clinic-ambulatory BP difference and the “real” WCE [24] (Fig. 2.8).
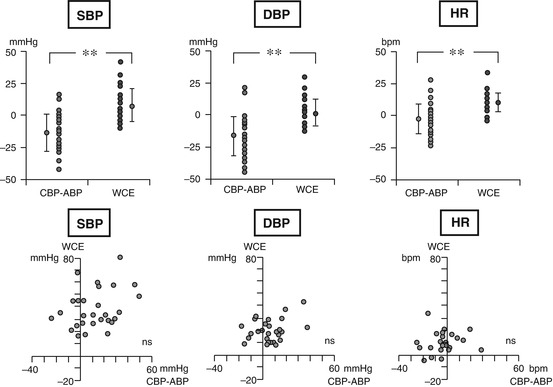
Fig. 2.8
Upper panels show the individual values of directly assessed white coat effect (WCE), obtained by beat-to-beat noninvasive blood pressure monitoring during a physician’s visit (black dots) and the surrogate quantification of this phenomenon based on the difference between clinic and ambulatory daytime average BP values (CBP-ABP) (open circles), as well as the average values of each parameter (±SE) for the group as a whole (dots with vertical bars), separately for systolic blood pressure (SBP), diastolic blood pressure (DBP), and heart rate (HR). Lower panels show the lack of correlation between direct measures of WCE (vertical axis) and the surrogate measure of this phenomenon (computed as the difference of CBP-ABP, horizontal axis). Individual data are separately shown for SBP, DBP, and HR. **p < 0.01 for the difference between WCE and CBP-ABP; bpm beats per minute (Taken from Parati et al. [25] with permission)
Despite all the above limitations and the lack of consistent evidence to support the use of the difference between clinic and daytime BP as a reliable quantitative index of the “real” WCE [25], this difference has gained popularity and is currently the most commonly used approach to indirectly quantify the WCE, largely because of the simplicity and feasibility of this approach, as well as because of the availability of techniques for intermittent out-of-office BP monitoring in clinical practice. However, the difference between office and ambulatory BP as a surrogate measure of the WCE should be interpreted on the background of its important limitations (see Table 2.1).
Table 2.1
Comparison of different methods for assessment of the WCE
Feature | Direct measurement of the WCE (real WCE) | Indirect measurement of the WCE (clinic-ambulatory or clinic-home BP difference) | Indirect measurement of the WCE based on ABPM data only |
|---|---|---|---|
BP measurement technique | Continuous BP recordings performed under ambulatory conditions over 24-h and/or in concomitance with the medical visit (before, during, and after the medical visit) | Intermittent ABPM or HBPM | Intermittent ABPM only |
The medical visit and ambulatory or home BP measures are generally performed in separate days | |||
BP measurement intervals | Beat-to-beat BP recordings over 24 h and in concomitance of the medical visit | ABPM: every 15–20 min over the 24 h preceding or following the medical visit | ABPM: every 15–20 min over the 24 h preceding or following the medical visit |
HBPM: duplicate measures obtained in the morning and in the evening during the 7 days preceding the medical visit, discarding the first day [50] | |||
Quantification of the WCE | The magnitude of the WCE is precisely quantified both in its size and duration, taking the blood pressure levels recorded under the standardized resting condition preceding the physician’s visit as reference | OBP is quantified from the average of a few number of readings (usually 1–3). Ambulatory or home BP measures are obtained in different days with regard to the medical visit | The WCE is calculated by subtracting the average of all daytime readings (reflecting awake BP outside the medical setting), from the average of BP measures performed during the first or last hour of the ABPM recording (reflecting BP levels in the office) |
The WCE is calculated by subtracting the average of all ambulatory daytime or of the 6-day home BP readings (reflecting awake BP outside the medical setting), from OBP | |||
Definition of the WCE | Difference between the average of beat-to-beat BP values recorded at the time of the maximum BP increase during the medical visit (during which a doctor repeatedly measures BP by the cuff method) and the average of the beat-to-beat values recorded at rest in 5 min preceding the doctor’s visit | Difference between clinic and ambulatory average daytime or home blood pressures | Difference between the average BP values obtained during the first or last hour of ABPM and the remaining daytime or 24-h BP average |
Terminology for the WCE | “Real” WCE | “Surrogate” WCE | “Ambulatory” WCE |
Advantages | Direct and precise quantification of the magnitude and time course of the real WCE | Ease of implementation in clinical practice | Requires performance of ABPM only |
ABPM: extensive information on day and nighttime BP and 24-h BP profiles | |||
HBPM is cheap and available | |||
Disadvantages | Ethical concerns regarding use of invasive intra-arterial BP monitoring | ABPM is not always available | ABPM is not always available |
Noninvasive devices for beat-to-beat BP monitoring are costly, and the stability of measurements outside the laboratory setting needs to be checked | HBPM requires patient training and involvement | Current software for analysis of ABPM does not yet incorporate separate calculation of average BP values obtained during the first or last hour of ABPM, from the remaining daytime or 24-h BP average | |
OBP is quantified from the average of a limited number of readings (usually 1–3), with the risk of poor reproducibility of the values obtained | |||
Out-of-office BP measures (either with ABPM or HBPM) are not performed at the moment of the clinical visit and thus cannot precisely reflect the basal BP levels immediately before and then in concomitance to the medical visit |
2.3.2 Assessment of the WCE Using ABPM Only: “Ambulatory” WCE
It is well accepted that ambulatory BP measures collected outside the medical office are not affected by the alerting reaction to the medical visit. However, several reports have indicated that ambulatory BP recordings are not entirely free from the WCE and that the first or final measurements of ABPM are characteristically higher than the mean value for the daytime ambulatory BP values (although yet smaller compared to OBP) [27]. This transient elevation in BP levels in the initial and final portions of ambulatory BP recordings has been interpreted as a consequence of the alerting reaction to the clinical environment when the patient attends the clinic for device placement and removal [21, 28] (Fig. 2.9), and these subperiods of the 24-h ambulatory BP recording have been commonly addressed as the “white coat windows,” i.e., the periods of time during an ambulatory BP recording in which it is still possible to at least partly appreciate the pressor response to the medical visit.
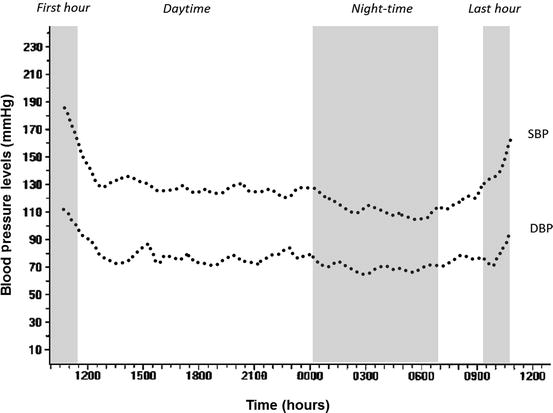
Fig. 2.9
Typical ambulatory blood pressure recording showing transient elevation in BP levels in the initial (first hour) and final portions (last hour) when the patient attends the clinic for device placement and removal, respectively. Modified from Owens P, et al. [21] with permission. SBP, systolic blood pressure; DBP, diastolic blood pressure
On the basis of this evidence, the question was raised on whether BP values monitored during the first or last hour of a 24-h ABPM recording, when the subject is usually in a clinic environment, might be used in replacement of conventional office BP measurements to identify the presence of the white coat phenomenon. Based on the assumption that the same stressful situation that is responsible for a WCE on OBP might affect also the initial portion of a 24-h ABPM (when the patient is still in the clinic setting for fitting the ABPM device), and possibly also its final segment (at the time when subjects go back to the clinic for device removal), it was suggested that the first and last hours of a 24-h ABPM might be taken to reflect the patient’s alarm reaction to a clinic visit, more than the effects of usual daily activities on ABP. Consequently, some authors have proposed separately to consider the readings obtained during the first and last hour of a 24-h ABPM (the so-called white coat window), taking them out from the calculation of the mean awake ambulatory BP levels [21]. According to this approach, the difference between the average BP values obtained during the first or last hour of an ABPM and the average of the remaining daytime or 24-h BP values would provide an indirect measure of the WCE (defined as “ambulatory” WCE) [21]. An indirect validation of this approach was provided in the frame of a large cohort study in non-treated hypertensive patients referred for ambulatory BP monitoring, by exploring the relationship between measures of the WCE obtained by applying the clinic-ambulatory BP difference and other measures obtained by considering the “white coat window” approach [21].
Overall, this study showed that measures of the WCE obtained by the “white coat window” approach were highly correlated with traditional measures of the WCE based on the clinic-ambulatory BP difference [21], although it should be acknowledged that the latter cannot be taken as a reference measure of the WCE, given its own intrinsic limitations, as discussed in the previous paragraphs of this chapter [23]. In spite of the fact that the agreement between this approach and the traditional although limited method for assessing the WCE was not perfect, their close correlation led authors to make a further step and to suggest that the finding of an elevated average BP in the first or last hour of a 24-h ABPM measurement (systolic BP ≥140 mmHg and/or diastolic BP ≥90 mmHg), when the average of the remaining ambulatory daytime BP values is normal (i.e., <135/85 mmHg), is to be taken as indicating a white coat hypertension condition, defined by the authors as “ambulatory white coat hypertension” [21]. According to this approach, both WCE and WCH could be, although indirectly, assessed from ABPM data only, independently of BP measures performed by the physician during the medical visit [21], an interesting proposal which however would need further validation with proper methodology (see Table 2.1).
2.4 Diagnosis of WCH from the Combined Use of Office and Ambulatory BP Monitoring (ABPM)
Consistent evidence has been provided that BP levels measured in the clinical setting are in general higher than ambulatory BP measurements performed out of the clinic environment [29]. This is considered a major explanation for the frequently observed disagreements between OBP and out-of-office BP measurements when classifying hypertensive subjects [30] (Fig. 2.10).
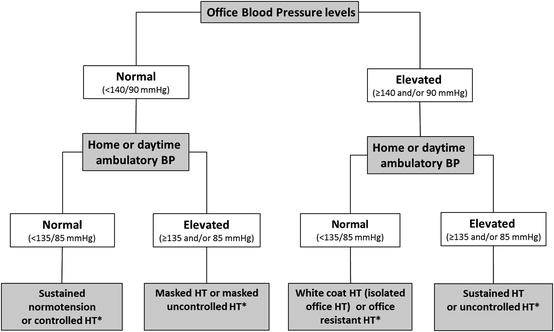
Fig. 2.10
Schematic relationship between office and home or daytime ambulatory blood pressure. BP blood pressure, HT hypertension, In treated hypertensive subjects (asterisk)
Based on this evidence and assuming that the discrepancies between office and out-of-office BP levels might be the result of the alerting reaction to the physician’s visit, the condition characterized by a persistently high BP in the physician’s office and a persistently normal BP away from the clinical environment was referred to as “white coat hypertension” [20].
Although WCH is a consequence of the white coat effect, the presence of a significant WCE in a given subject may not necessarily be accompanied by WCH, unless the rise in BP levels during the medical visit is high enough to reach the hypertensive range. That is why some subjects even despite having a marked WCE (i.e., a substantial difference between office and out-of-office BP levels), but with office BP levels still in the normal range, cannot be considered as having WCH; conversely, subjects with a small WCE, but with office BP levels in the hypertensive range, may fall in the category of WCH if their ambulatory BP levels are persistently normal. Relevant evidence in this regard was provided by a report of the Progetto Ipertensione Umbria Monitoraggio Ambulatoriale (PIUMA) conducted in a large population of 1,333 untreated subjects with essential hypertension in which the severity of hypertension (according to the JNC V stage) was inversely correlated with the prevalence of WCH (i.e., the more severe the hypertension, the lower the prevalence of WCH), but directly correlated with the magnitude of the WCE (i.e., as estimated by the difference between clinic BP and average daytime ambulatory BP). The results of this study raised important concerns regarding the clinical relevance of the clinic-ambulatory BP difference as an index of the WCE, as this difference cannot reliably predict WCH nor normalcy in ambulatory BP levels.
A critical condition for the diagnosis of WCH or isolated office hypertension is the occurrence of a persistent BP elevation at the time of consultation and of normal out-of office BP levels over time. Thus, isolated elevations in OBP levels that can be found only at the beginning of the first few visits, and that later disappear, should be regarded as temporary BP increases [31] and should not lead to the diagnosis of WCH. Indeed, the inclusion of subjects with a temporary rather than a persistent office hypertension could have contributed to the inflated prevalence of WCH (i.e., 60 %) reported in some population studies [32].
In some subjects, rather than representing a real pressor response to the doctor’s presence, these transient, non-sustained increases in BP levels may be just the result of an increased BP variability, i.e., a phenomenon that characterizes BP levels in daily life. As clearly shown by studies carried out by means of 24-h intra-arterial ambulatory BP monitoring techniques [33], both fast and slow fluctuations occur continuously over the day and night, in response to different behavioral challenges, the magnitude of which is greater among hypertensive subjects (Fig. 2.11).
Fig. 2.11
Beat-to-beat blood pressure (BP) tracing obtained in an ambulant subject over the 24-h period through the Oxford technique, based on insertion of a catheter in a peripheral artery (Taken from Mancia et al. [72] with permission)
Although, in general, WCH has been shown to be a reasonably reproducible phenomenon, the ABPM levels in subjects defined as having WCH might represent, by chance, a sample taken at the low extreme of their random distribution. Consequently, day-to-day reproducibility of WCH might be impaired by a regression-to-the-mean phenomenon. In one study, in a group of mild hypertensive subjects who underwent duplicate ABPM 3 months apart, diagnosis of WCH was not reproducible in as many as 50 % of subjects (likely as a consequence of the regression toward the mean), indicating that the current diagnosis of WCH is also subject to selection bias [34]. Based on the above observations, an argument sometimes raised against the concept of WCH is that if patients are seen a sufficient number of times in the clinic, BP will return to normal. However, while this may be true in a subset of patients (by effect of an increased BPV or the regression to the mean phenomenon) in many subjects, clinic BP will remain high indefinitely, despite persistently normal ambulatory BP levels.
Finally, also the criteria considered for defining normalcy of BP levels during daytime may lead to over- or underestimation of the frequency of WCH. The first reports on the frequency of white coat hypertension, considering a threshold value of 140/90 mmHg as the upper limit of normality for both office and daytime ambulatory BP levels, found WCH to be present in as much as 60 % of the overall hypertensive population [32, 35]. However, after the evidence provided by the PAMELA study [36] and other population studies [37, 38] and meta-analyses [39] supporting a threshold value of <130–135/85 mmHg as the upper limit of daytime ambulatory BP normality, the frequency of this phenomenon was found to be significantly lower. Indeed, the prevalence of white coat hypertension in subsequent studies was reported to range from 9 to 16 % in the general population and from 25 to 46 % among hypertensive subjects [40, 36, 41, 42, 6]. While the conventional cutoff value for hypertension is an office BP value of ≥140/90 mmHg, most studies in WCH have used a cutoff value of ≥135/85 mmHg for out-of-office daytime or home BP and ≥130/80 mmHg for 24-h BP. Following the demonstration by several prospective population studies of the superiority of nighttime BP levels over other components of ABPM in predicting cardiovascular outcomes [43, 44] and in consideration that a subset of subjects with WCH present elevation in BP levels during nighttime (i.e., nighttime hypertension) and/or during the 24 h, current hypertension guidelines [5, 6] have expanded the definition of white coat hypertension, requiring normality not only in awake BP values but also in 24-h (i.e., <130/80 mmHg) and sleep (i.e., <120/70 mmHg) BP levels.
Related posts:
 White Coat Hypertension: The History of the Irresistible, Resistible Ascent of a Misnomer
Predictive Factors for White-Coat Hypertension
White Coat Hypertension and Target Organ Damage
White Coat Hypertension: Definition, Terminology and Prevalence
White Coat Hypertension, Metabolic Risk Factors and Cardiovascular Risk Profile
White Coat Hypertension: To Treat or Not to Treat
White Coat Hypertension: The History of the Irresistible, Resistible Ascent of a Misnomer
Predictive Factors for White-Coat Hypertension
White Coat Hypertension and Target Organ Damage
White Coat Hypertension: Definition, Terminology and Prevalence
White Coat Hypertension, Metabolic Risk Factors and Cardiovascular Risk Profile
White Coat Hypertension: To Treat or Not to Treat
Stay updated, free articles. Join our Telegram channel

Full access? Get Clinical Tree


