Developing Countries
Over the past 25 years, published data have indicated huge differences in ARI mortality rates between developing and developed countries. A World Health Organization (WHO) study in 1990 revealed that, in the world as a whole, the number of deaths attributable to ARI was 12 times greater in developing countries than in developed countries.
2 A recent WHO report estimated that in 2008 18% of all mortality in children aged younger than 5 years was attributable to acute respiratory infections (
Table 19-1).
3 The burden of mortality falls heaviest on developing countries. Those countries where infant mortality rates exceed 25 per 1000 suffer 98% of the world’s deaths from ARI in infants and 99% of those deaths in children aged 1 to 4 years.
4 Furthermore, countries with infant mortality of approximately 100 per 1000 can be expected to contribute 58% of the ARI-related deaths in infants and 66% of those in children aged 1 to 4 years.
4 As these estimates are based on national mortality reporting systems of varying quality, underestimation of the true mortality rate from ARI is possible.
Recent Estimates of Total Pneumonia Mortality and Morbidity
A systematic analysis of the global, regional, and national mortality in children younger than 5 years of age in 2008 was published recently.
3 According to this analysis, an estimated 8.795 million deaths
occurred in children younger than 5 years in 2008. Of these deaths, 68% (5.970 million) were due to infectious diseases, with the largest proportion due to pneumonia (18%; 1.575 million), followed by diarrhea (15%; 1.335 million), and malaria (8%; 0.732 million). Neonatal deaths accounted for 41% of deaths and included preterm birth complications and deaths from a variety of other causes, including 386,000 deaths due to pneumonia in this age group.
A previous systematic review of under-5 mortality in 2000 estimated the total global mortality in this age group to be 10.6 million, with 19% of these deaths due to pneumonia.
1 Estimates of the global burden of disease caused by infection with two major respiratory pathogens,
Streptococcus pneumoniae and
Haemophilus influenzae group B, have been published as well.
5,
6 One study estimated that
S. pneumoniae caused approximately 826,000 deaths (range: 582,000-926,000) in children aged 1-19 months in 2000.
5 Of these deaths, 91,000 (range: 63,000-102,000) occurred in human immunodeficiency virus (HIV)-positive children and 735,000 (range: 519,000-926,000) in HIV-negative children; more than 61% of these deaths occurred in 10 African countries.
S. pneumoniae infection was estimated to cause approximately 11% of all deaths in children 1-59 months of age. Acceleration of the use of protein-conjugated
S. pneumoniae vaccines in these high-risk populations in Africa and Asia is a critical public health priority at present.
The global burden of disease of
H. influenzae type b (Hib) in children 1-59 months of age was estimated to include approximately 8.13 million serious illnesses per year in 2000.
6 Infections with this organism were estimated to have caused some 371,000 deaths (range: 247,000-527,000) in children 1-59 months of age in 2000. A highly effective and safe vaccine to prevent Hib infection is available, so these infections are almost entirely preventable. Fortunately, by 2006, 108 countries had implemented routine childhood vaccination with Hib vaccine.
6
Global Alliance for Vaccines and Immunization
After the successful eradication of smallpox with a well-organized, coordinated public health program, which relied on an effective vaccine as a central component of the campaign, interest in using vaccines to control other infectious diseases increased. The first international vaccine effort after smallpox eradication in 1980 was the Childhood Vaccine
Initiative (CVI), which began in 1990 and functioned in collaboration with UNICEF and WHO’s Expanded Program on Immunization (EPI). The CVI was organized to help develop and provide preventive vaccines for developing country populations by providing a link between the pharmaceutical industry and public health authorities from developing country populations.
7 Subsequently in 2000, the Global Alliance for Vaccines and Immunization (GAVI) was formed as a successor to CVI.
GAVI is a public-private partnership between the relevant experts and political decision makers in vaccines and immunization. It includes developing and donor countries, international development agencies and financial organizations (e.g., WHO, UNICEF and the World Bank), philanthropic organizations (i.e., the Bill and Melinda Gates Foundation), academia, the vaccine industry in both industrialized and developing countries, and representatives from civil society and the business community. GAVI was born and launched at the World Economic Forum in Davos in January 2000.
Developing countries can apply for funds from GAVI to support their immunization activities. Eligibility requirements include a gross domestic product per capita of less than $1500/year; a clear commitment to immunization, as shown by coverage of at least 50% children in each birth cohort with the six EPI vaccines; and a population of fewer than 150 million persons.
8,
9 and
10Over its first 10 years of operation, GAVI received and distributed $4.5 billion to process and buy vaccines and strengthen the health systems for 72 developing countries. A major success of this alliance has been a dramatic increase in the use of Hib vaccine. Use of this vaccine has resulted in an estimated 5.4 million future deaths prevented.
9,
10 In addition, a vaccine to prevent meningococcal meningitis type A infections in the meningitis belt in Africa has been developed and distributed. Future challenges include the use of protein-conjugated polysaccharide vaccines for
S. pneumoniae, typhoid fever and rotovirus vaccines, and other preventive vaccines.
Morbidity in Developing and Developed Countries
In contrast to the mortality data, ARI-related morbidity is similar for children in both developing and developed countries.
4,
11 In India, Ethiopia, and Costa Rica, the mean number of episodes of respiratory illness per year for children younger than 3 years of age was reported as 7.3, 7.9, and 4.9, respectively. In older children (3-5 years of age), the rates were also similar across India, Ethiopia, and Costa Rica—6.2, 6.6, and 5.7 episodes/year, respectively.
11,
12,
13 and
14 Similarly, in the developed world, data from National Research Council studies of respiratory infection in young children in 12 countries suggest that the incidence of such disease in the first year of life ranges from 5 to 9 episodes.
11 Older data from the Seattle Virus Watch found that from 1965 to 1969, infants experienced a mean of 4.5 episodes per year.
15 In Tecumseh, Michigan, infants experienced a mean of slightly more than 6 episodes of respiratory illness per year, and children aged 1 to 4 years experienced a mean of just more than 5 episodes per year.
16 Caution is in order when considering these data, however: the studies from which these data were culled used widely differing methodologies and were reported several years ago. Thus prevalence rates might not be directly comparable or might have changed in recent years.
The incidence of chronic bronchitis (chronic obstructive pulmonary disease) is generally similar in developing and developed countries.
17 For example, Lai et al. found 6.8% of an elderly group of Chinese living in Hong Kong to have chronic bronchitis,
18 and pharmaceutical research indicated a 6.9% incidence in Taiwan.
17 However, Pandey found a high incidence of chronic bronchitis (18%) in Nepal,
19 with women and men equally affected by the disease. Indonesia also appears to have an especially high incidence of chronic bronchitis, although available data do not differentiate chronic bronchitis from acute bronchitis or account for multiple episodes during the observation period.
17 An age profile in a sample of nearly 250,000 persons in Indonesia noted the incidence of chronic bronchitis was 15.7% in those persons aged 30 to 39 years, 19.3% in those aged 40 to 54 years, and approximately 6% in those aged 55 years or older.
17
Developed Countries
In developed countries, ARI is the leading cause of morbidity, accounting for 20% of medical consultations, 30% of absences from work, and 75% of all antibiotic prescriptions.
1 Of all the ARIs, pneumonia has been the most thoroughly studied.
In 1900, pneumonia was the second leading cause of death in the United States, after tuberculosis.
20 Mortality rates per 100,000 population between 1910 and the present are shown in
Figure 19-1.
17 In 1918, pneumonia mortality skyrocketed due to complications from the great influenza pandemic, which that year killed more than 540,000 Americans. Since that time, the pneumonia-related mortality rate has fallen significantly because of better hygiene practices and the availability of effective treatment, including antipneumococcal serum, sulfa drugs, penicillin, and other antibiotics, as well as the use of influenza Hib and pneumococcal vaccines. The slight increase in
pneumonia-related deaths since 1990 primarily reflects the increase in proportion of Americans who are elderly and who have a high pneumonia risk.
17 Mortality rates from influenza and pneumonia in the United States declined between 1999 and 2008, especially in persons older than age 75 and after 2003 (
Table 19-2). This decline may be due in part to more widespread use of conjugated pneumocccal vaccines in children and more extensive use of influenza vaccines, in addition to the absence of a major influenza pandemic during these years. The sharp rise in influenza seen in the figure for 2009 reflects the severity of the 2009 influenza season. Currently, in the United States, mortality rates from community-acquired pneumonia range from 1% to 5% in outpatients and from 15% to 30% in inpatients, making it the eighth leading cause of death.
21,
22,
23 and
24 Community-acquired pneumonia results in hospitalization in 20% of patients and 65 million days of restricted activity.
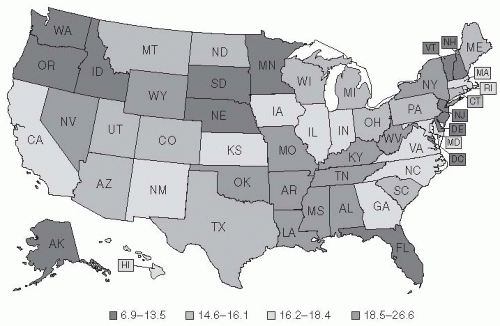
21Figure 19-2 pinpoints where in the United States deaths from pneumonia occurred between 1979 and 1992.
20 Although it was long theorized that a higher mortality rate from pneumonia occurred during winter and that cold temperatures promote pneumonia, these ideas are not consistent with the pattern of mortality.
20 Indeed, no definitive pattern with regard to climate is apparent in the United States from the 1979-1992 data: California had the highest pneumonia-related mortality rates; Georgia and Massachusetts had high rates; and North Dakota had the third lowest rate. The apparent contradiction raised by Florida, a state known as a retirement destination, being among those states with low rates of pneumonia is believed to be due to the “healthy retiree” effect. Healthy older people are able to retire to places such as Florida, whereas less healthy people in the older age group remain at home (
Figure 19-2).
20
Hospital-acquired (nosocomial) pneumonia is the second most common nosocomial infection in the United States, but it is the type of nosocomial infection most frequently associated with a fatal outcome.
26 The annual incidence is 5 to 10 cases per 1000 hospital admissions, and up to 20 times this figure in patients on ventilators.
26 Mortality rates run as high as 33% to 50% in patients on ventilators.
27,
28 The availability of penicillin, macrolides, and other antibiotics to treat pneumonia has greatly reduced the mortality and morbidity associated with this infection.
Age-specific incidence rates of minor episodes of respiratory illness (primarily upper respiratory tract infections) in the United States have varied little since 1933, as indicated by the results of studies that evaluated populations of varying compositions and used differing study methodologies and definitions of acute respiratory illness.
29 Over this period, however, pneumonia mortality rates have decreased in all age groups, except the elderly (
Table 19-2). Indeed, since 1981, mortality rates have increased in pneumonia patients aged 55 years or older. It is unclear why this trend is occurring, although alterations in the types and pathogenicity of organisms causing pneumonia and changing host factors may be contributory factors.
29Despite decreasing mortality rates for pneumonia and influenza in young children and infants, lower respiratory tract illness (croup, bronchitis, bronchiolitis, and pneumonia) remains an important cause of morbidity in this age cohort, annually affecting approximately 25% of children aged less than 1 year and 18% of children aged 1 to 4 years.
30,
31,
32,
33,
34 and
35 In 1989, Wright et al. reported the cumulative incidence of first episodes of lower respiratory tract infection in infants to be 32.9% in children of families participating in a prepaid health plan.
36 This higher rate might have been seen because of differing diagnostic criteria compared with previous studies,
32,
33 and
34 an active rather than a passive followup regimen, and increased physician attendance because of lack of a financial disincentive in a prepaid health plan. In older children and adults in the United Kingdom, ARI accounted for almost one fourth of all
primary care contacts, and one third of days taken off work.
37 In a survey in Australia, 17% of patients aged 15 years or older and 43% of children aged less than 15 years consulted a doctor for respiratory symptoms during the 2 weeks preceding the survey.
38 A study in Adelaide, South Australia, showed that children younger than 5 years experienced a mean of seven episodes of respiratory illness per year, which prompted three doctor visits, 15 days of medication, and 52 days of respiratory symptoms annually.
38,
39The incidence of chronic bronchitis is similar in the United States and Europe.
20 In 1994, Enright et al. reported that 5.1% to 5.4% of the middle-aged to elderly population in the United States have chronic bronchitis, with a lower prevalence in nonsmokers.
40 In Europe, chronic bronchitis has been reported to affect 3.7% of people in Denmark,
41 4.5% in Norway,
42 6% and 6.4% in Barcelona and Valencia, Spain, respectively,
44 and 6.7% in Sweden.
45In the United States in 1998, community-acquired pneumonia accounted for an estimated $3.6 billion in expenditures for treating patients younger than age 65 years and $4.8 billion for treating patients aged 65 years or older.
46 In 1999, costs associated with acute exacerbations of chronic bronchitis were $419 million in patients younger than 65 years and three times that much ($1.2 billion) for patients aged 65 years and older.
47 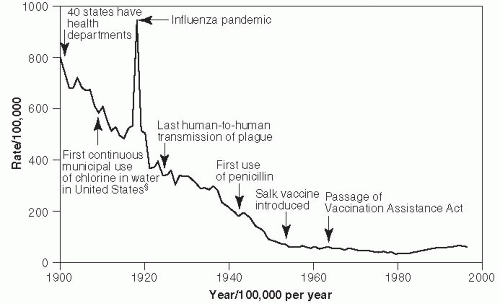
 Early History of Infectious Disease: Epidemiology and Control of Infectious Diseases


