Molecular Epidemiologyand Infectious Diseases


Molecular Epidemiology
and Infectious Diseases


Susan M. Harrington

John S. Francis

William R. Bishai

Karen C. Carroll


The past 20 to 30 years have seen significant advances in the ability of the clinical microbiologist to identify substrains of bacterial pathogens and use this information to track infectious diseases. Most strain typing has focused on bacteria, but fungi and viruses can also be typed. Medical diagnostic evaluations for a particular infectious disease usually end with identification of pathogens to their species; most clinical microbiology laboratories do not routinely identify organisms to the substrain level. For example, strains of Staphylococcus aureus, which are implicated in many hospital-acquired (nosocomial) infections, are identified to the species level, but are not routinely evaluated for evidence of belonging to a particular type. Similarly, Streptococcus pneumoniae isolates can be identified by serotype as well as by species, yet subtyping is not part of a routine microbiology culture result. Serotyping is occasionally performed to assess vaccine efficacy in immunized patients who develop invasive disease. Strain typing is used to determine how closely isolates of the same species are related to one another. When isolates from different patients are related or indistinguishable from one another, it may indicate a common source of the infection. This information is useful to epidemiologists who are responsible for tracking communicable diseases within a healthcare institution or a community. Such information helps them to identify point sources and transmission patterns of infections so that appropriate interventions may be applied. Likewise, when isolates are found to differ by subspecies analysis, it suggests a different source of infection. Hence, if two people are diagnosed with tuberculosis in the same community at the same time, differences by strain typing indicate that the individuals are highly unlikely to have passed the infection between each other.

In short, the goal of strain typing is to distinguish epidemiologically related isolates from those that are unrelated, based on the premise that related isolates share detectable characteristics that will distinguish them from others. Although strain typing is a very powerful tool for the epidemiologist, this procedure should be done with clear goals in mind and should be used to enhance a sound epidemiologic investigation. Many of the tools used to strain-type organisms involved in outbreaks and investigations conducted over a short time period are not applicable to population and evolutionary studies of genetic relationships between strains. It is important for the investigator to have an understanding of typing methods and the situations in which they are most applicable.


APPLICATION OF TYPING TECHNIQUES

Strain typing systems are widely used to characterize bacteria, fungi, and, more rarely, viruses. Many applications for typing methods exist, including studying the relationships between colonizing and infecting strains; documenting nosocomial transmission; distinguishing relapse from reinfection; establishing clonality of isolates within clusters of patients in the hospital or community; and tracking the spread of isolates between hospitals or communities over time.1

Often the laboratory is asked to subtype isolates when an epidemiologist notices increased incidence of disease associated with a specific pathogen or increased isolation of a microbe on routine surveillance of microbiology culture results. For example, during a 6-year period, an increased incidence of pediatric empyema was noted at a children’s medical center
in Salt Lake City associated with Streptococcus pneumoniae infection. Each pneumococcal strain was determined to be serotype 1, and pulsed-field gel electrophoresis (PFGE) indicated that the isolates were indistinguishable or at least closely related, supporting the hypothesis of clonal spread.2

Sometimes a relatively rare organism recovered over a short period of time from patients not obviously linked epidemiologically may be an indication of disease transmission. In one example, three cases of Listeria monocytogenes bacteremia, noted in two departments in the same hospital within a 2-week time period, led investigators to suspect a common source of contamination. Molecular typing quickly determined the isolates to be distinct; thus no further investigation was indicated.3 Conversely, as part of a prospective study of tuberculosis transmission in Baltimore, two patients whose only link was the hospital in which they were treated were found to have the same Mycobacterium tuberculosis subtype. Upon further examination, the second patient was thought to have acquired tuberculosis from a contaminated bronchoscope that had been used on the other patient 2 days earlier.4

Reports of unusual pathogens (e.g., those with rare antimicrobial resistance patterns or unexpected isolates from environmental sources) alert microbiologists and epidemiologists to potential outbreaks. For example, molecular analysis of plasmid DNA proved useful in demonstrating clonality of a relatively rare strain of chloramphenicol-resistant Salmonella in California. The Los Angeles County Health Department Laboratory noticed a 4.9 times increase in this species; 87% of the cases involved chloramphenicol-resistant organisms. A case-control study showed the illness to be associated with consumption of ground beef derived from feedlots using antibiotics in cattle. The strain was further linked to contaminated beef, slaughterhouses, and dairy farms.5 Likewise, use of polymerase chain reaction (PCR) and DNA sequencing was essential in identifying monkeypox (usually isolated in Africa) during an outbreak in the midwestern United States associated with individuals who had contact with pet prairie dogs exposed to an ill Gambian giant rat.6 These molecular epidemiology-based techniques were also useful in the detection of a novel coronavirus as the causative agent of severe acute respiratory syndrome (SARS) during a worldwide outbreak originating from a single healthcare worker in China.7, 8

Strain typing techniques are now used for other clinical applications as well. To determine if isolates of the same genus and species cultured from a patient weeks or months apart represent reinfection with a new strain or recrudescence of a previous infection, they might be typed by molecular methods. In one report, an immunocompromised child had episodes of bacteremia 4 months apart with the same uncommon gram-negative bacterium, Flavobacterium meningosepticum (now called Elizabethkingae meningoseptica). Molecular analysis by PFGE showed the isolates to be indistinguishable; the two episodes of sepsis likely resulted from an indwelling central catheter that harbored small numbers of organisms.9 In another example, 1 year after having been adequately treated for a M. tuberculosis infection, a patient with human immunodeficiency virus (HIV) was again found to have active disease. Was the therapy inadequate or had the patient been reinfected? Molecular studies showed the second strain recovered to be the same as the first, except for a mutation rendering it resistant to rifampin. The strain was presumed to have become resistant in vivo during rifabutin prophylaxis intended to prevent infection with Mycobacterium avium. Hence, molecular analysis proved reactivation of disease with a new antibiotic resistance pattern in the patient’s original strain.10

Molecular techniques may also be used to determine if multiple blood cultures drawn over 1 or more days yielding coagulase-negative staphylococci or other skin flora represent a true bacteremia or culture contamination. Multiple strains isolated from a true bacteremia generally have the same molecular type, whereas skin contamination will likely produce heterogeneous strains.11, 12

Finally, molecular typing techniques are being used to assist both healthcare institutions and communities at large with understanding the transmission and spread of multidrug-resistant gram-negative rods such as Acinetobacter spp. and carbapenemase-producing Enterobacteriaceae. In recent years, these organisms have become more prevalent within both acute care hospitals and extended care facilities. Understanding the dynamics of hospital-to-community-to-hospital spread is another critical role of molecular typing techniques.


DEFINITIONS AND BACKGROUND

Throughout this chapter, vocabulary known to the microbiologist and molecular biologist will be used. To create a framework for the reader, some basic concepts with respect to strain relatedness are defined in this section. In particular, strain typing methods that preceded molecular techniques are discussed. An overview of microbial nucleic acids and ways in which the genetic content of a microbe can vary is given as
well. The laboratory techniques used to detect genetic change are also explained in this section before specific molecular typing methods are presented.


Relevant Concepts and Conventional Strain Typing Methods

An isolate refers to the bacterium or other microbe recovered from a primary microbiology culture. Typically, an isolate is characterized only by its source and its genus and species. The word strain is applied after some further testing is performed. Isolates may be grouped as a single strain based on characteristics they have in common—that is, if they give the same strain typing result. They can be considered unique strains if the typing technique distinguishes them from other strain types tested. Clones are isolates that have been derived from the same parent strain. Isolates are considered clones if they are indistinguishable from one another. Although progeny strains are produced from indistinguishable isolates, normally occurring genetic mutations will cause them to diverge gradually. Therefore, after multiple generations, daughter strains may no longer be identical, but will likely be clonally related.

Relationships among strains are to some extent relative. They may depend on which test is used for characterization. Different techniques provide information about different aspects of the organism. Also, isolates may be related to varying degrees depending on the amount of mutation within a species and the number of generations between the isolates.13

Before the advances in molecular biology of the past 20 to 30 years, the techniques used to characterize microorganisms were based on their phenotypic characteristics. The phenotype of an organism is derived from the expression of the genetic material. Biotyping, antimicrobial susceptibility patterns, serotyping, phage typing, bacteriocin typing, and proteinbased methods are all examples of phenotypic tests. Each of these measures varies within a species, and each has observable properties. Although more discriminatory molecular methods have replaced these techniques owing to the new methods’ ability to provide even more accurate strain typing, the information provided by phenotypic results should not be minimized.

Speciation of bacteria and yeasts has traditionally required testing for expression of metabolic functions with a series of biochemical tests. The results produced in these tests provide characteristic patterns for identification, and they are referred to as the “biotype.” Biochemical identification is gradually being replaced by molecular methods, however, as it has not been a sensitive indicator of strain differences.

As pathogenic bacteria are identified to the species level, the clinical laboratory routinely performs testing of that microbe’s susceptibility to a panel of antibiotics appropriate for therapy. The susceptibility results are reported as “susceptible,” “intermediate,” or “resistant” to each antibiotic. The susceptibility profile of the organism to the panel of antibiotics is termed the antibiogram. Two isolates found to have the same atypical antibiogram may be an early indicator that clonal dissemination is occurring. For highly resistant nosocomial species, such as vancomycinresistant enterococci (VRE) or methicillin-resistant S. aureus (MRSA), antibiograms are of limited use because few changes will be seen in the susceptibility profile between isolates. Isolates with vastly different antibiograms are most likely unrelated. Sometimes, however, two antibiograms may differ by only one or a few antibiotic susceptibilities. Strains producing such patterns may be clonally related. Bacteria can become antibiotic resistant depending on the selective pressure of antibiotics in the environment or the presence of other resistant species that can transfer resistance genes. Conversely, organisms can also lose antibiotic resistance genes carried on extra-chromosomal DNA called plasmids. Overall, antibiograms provide highly standardized, prospective data and are an excellent place to start in making strain comparisons.

Some bacteria can be differentiated by serotype. Antigenic determinants (e.g., cell-surface carbohydrates, membrane proteins, and lipopolysaccharides) vary among organisms and can be detected with specific antibodies. Serotyping continues to be a useful method for species such as Haemophilus influenzae, S. pneumoniae, Neisseria meningitidis, Salmonella and Shigella species, Escherichia coli, and some viruses. Not only can serotyping differentiate stains, but certain serotypes also serve as markers of virulence. For example, H. influenzae type b causes severe invasive disease and E. coli O157:H7 can cause hemolytic uremic syndrome. Influenza viruses can be typed to determine which hemagglutinin (H) and neuraminidase (N) serotypes are circulating, for inclusion in yearly vaccine development. Serotyping, however, is limited as an epidemiologic typing method, because its discriminatory power is less than that of other, molecular methods. Additionally, serotyping can be expensive, and is useful for only a limited number of organisms for which antisera have been developed.14

Bacteriophage typing had long been the standard typing method for S. aureus. Unfortunately, this method is technically demanding and is generally available only in reference laboratories. Like phage typing, bacteriocin testing is expensive and technically difficult and is no longer performed in strain
typing laboratories. Multilocus enzyme electrophoresis (MLEE) is a protein-based method. With this approach, extracts containing metabolic enzymes from the bacteria are separated by electrophoresis in starch gels. The location for each enzyme in the gel is then detected with a colorimetric substrate specific to that enzyme. Because the electrophoretic mobility of the enzymes depends on their exact amino acid content, it is strain specific. When evaluated as a profile, the electrophoretic mobilities or isoenzyme patterns are referred to as an electrophoretic type. Although it is moderately discriminatory, this technique is not in widespread use because it is technically demanding and has generally been replaced by multi-locus sequence typing (MLST), a method described later in this chapter.15

Like all living forms, microbes are composed of nucleic acid, protein, lipid, and carbohydrate. Methods exist for identifying intraspecies differences based on each of these four categories, some of which were discussed earlier in this chapter. In the last two decades, however, methods based on the presence, size, and sequence of nucleic acids have come to predominate in the field of molecular epidemiology. These methods are referred to as “genotypic” because they assess the genetic content of the microbe.


The Basics of Microbial Nucleic Acids and Mutational Change

The primary location of the genetic content of a microorganism is its chromosome. Bacteria are classified as prokaryotes, and they generally contain a single, circular chromosome consisting of doublestranded DNA (dsDNA). Fungi, in contrast, are eukaryotes that carry multiple linear chromosomes. An understanding of the components of DNA is essential to the basic theory of molecular epidemiology.

All dsDNA has two complementary strands, which pair by hydrogen bonding. Each strand consists of a sugar-phosphate backbone and the nucleotide bases adenine (A), guanine (G), thymidine (T), and cytosine (C). Adenine always pairs with thymidine, and guanine with cytosine. It is the order or sequence of these base pairings that determines the genetic content. The amino acids that make up proteins are encoded in nucleic acid triplets. Molecular biologists measure chromosomes, specific genes, or other DNA fragments by their length in base pairs (bp). Many genome-sequencing projects have been completed, allowing for the determination of the number of base pairs in the chromosome, and complete DNA sequence for these species. On average, bacterial chromosomes range in size from 800 kilobases (kb) to 10,000 kb.

In addition to the chromosome, there may be extra-chromosomal segments of DNA known as episomes or plasmids. Such DNA elements usually range in size from 1 to 200 kb.


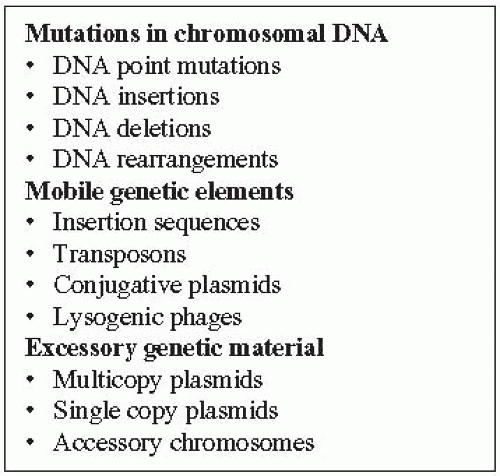
Figure 9-1 Types of Alterations in DNA That Can Be Detected by Molecular Epidemiology

The organism’s total genetic content (i.e., chromosomal and episomal DNA together) is referred to as the genome. Molecular epidemiologists determine strain relatedness by detecting changes in the genome. Variations in the genetic content of a bacterium may occur in several different ways, as described next (Figure 9-1).


Mutational Changes

Mutations are mistakes that occur when the DNA of a parent bacterial strain is being copied during the replication process. The basal mutation rate for most bacterial species is about one error in 108 bp per generation. Hence, in an organism that has a genome size of 107 bp, a base pair replication error will be made once every 10 generations. Two general types of mutations are seen: (1) point mutations, which involve the substitution of one base for another, and (2) rearrangements of fragments of DNA, including insertions or deletions from the chromosome. Substitutions are further divided into two classes: synonymous and nonsynonymous single-nucleotide polymorphisms (sSNPs and nsSNPs, respectively). sSNPs do not alter the amino acid sequence of a protein, but nsSNPs lead to an amino acid replacement.16

Most mutations are inconsequential or silent (i.e., they do not lead to physiologic or functional changes in the mutated progeny cell). In organisms that replicate quickly and are present in large environmental reservoirs, however, significant genetic drift is observed. If the basal rate of genetic replication errors is assumed to be constant, then the more genetic differences between two isolates of the same species, the more time that has passed since the two originated
from a common ancestor. Hence, it is possible to identify numerous changes of subspecies of most bacterial organisms, and to estimate the distance in evolutionary time between isolates.


Mobile Genetic Elements

Most bacterial species contain mobile genetic elements that create variability in the genome. A common type of mobile genetic element is the transposon. Duplicative transposons are capable of copying themselves and inserting a second copy at another site within the bacterial chromosome. Mobile genetic elements, such as transposons, lead to more easily detectable changes in the bacterial chromosome compared to point mutations resulting from the basal rate of mutation. Later in this chapter, we review how transposable elements may be used as part of a strain typing system.


Plasmids

Accessory genetic elements can be used to identify differences between species. In addition to the chromosome, many species contain relatively small, covalently closed, circular pieces of self-replicating DNA known as plasmids, which are present in single or multiple copies in the cytoplasm of the bacterial cell. Often these plasmids are nonessential and may come and go over time within a particular bacterial subpopulation. Some plasmids, however, carry elements that code for functional genes (e.g., metabolic enzymes, virulence factors, or antibiotic resistance). Antibiotic use can create selective pressure to maintain a plasmid. Likewise, absence of antibiotic can lead to loss of plasmids. Plasmids carried by a species (and their type and size) may be useful in identifying subspecies of the same strain.


Table 9-1 Some Common Restriction Endonucleases and Their Recognition Site Specificities


Restriction Enzyme


Recognition Sequence


Base Pairs Recognized (N)


Approximate Frequency of Cutting (bp)


HaeIII


5′—GG↓CC—3′


4


256


3′—CC↑GG—5′


Sau3AI


5′—↓GATC—3′


4


256


3′—CTAG↑—5′


EcoRI


5′—G↓AATTC—3′


6


4,096


3′—CTTAA↑G—5′


HindIII


5′—A↓AGCTT—3′


6


4,096


3′—TTCGA↑A—5′


PacI


5′—TTAAT↓TAA—3′


8


65,530


3′—AAT↑TAATT—5′


NotI


5′—GC↓GGCCGC—3′


8


65,530


3′—CGCCGG↑CG—5′


Note: Arrows indicate the place in the DNA sequence where cutting occurs.


MOLECULAR BIOLOGY TOOLS AVAILABLE TO THE MOLECULAR EPIDEMIOLOGIST

Some understanding of molecular biology laboratory techniques will be useful before the discussion of specific typing methods is presented. This section provides a brief overview of selected “tools.” The reader is referred to Molecular Cloning: A Laboratory Manual17 or Molecular Microbiology: Diagnostic Principles and Practice18 for more details on specific procedures.


Restriction Endonucleases

Restriction endonucleases or restriction enzymes are often used for strain typing. These enzymes scan dsDNA, searching for specific sequences. When a specific recognition sequence innate to the restriction enzyme is found, the enzyme cleaves the dsDNA. Table 9-1 shows several restriction enzymes and the sequences at which they cut.

In addition to having different recognition site sequence specificities, restriction endonucleases have different restriction site length specificities. Table 9-1 gives examples of restriction endonucleases that recognize four, six, or eight base pair sequences. As also shown in Table 9-1, endonucleases that recognize four base pairs will cleave DNA much more frequently than do those that recognize six or eight base pairs. For example, in DNA that is evenly distributed in it’s A+T and G+C content (50:50), SauA1, an enzyme that recognizes four base pairs, will be expected to cleave every 256 bp on average. The frequency of cutting depends not only on the number of bases in the recognition site, but also on the percent G+C and percent A+T of the organism.
If a bacterial species is GC-rich, for instance, a restriction endonuclease whose recognition site is biased toward AT will be an infrequent cutter and a restriction endonuclease whose recognition site has a heavy G+C content will cleave much more often than expected. A good example of this behavior occurs in M. tuberculosis, which is 67% G+C and 33% A+T in its DNA content. The eight-base cutter PacI, which recognizes the AT-rich sequence TTAATTAA, is expected to cut DNA containing equal amounts of AT and GC base pairs about every 65,537 bp. However, because of the heavy G+C content of M. tuberculosis DNA, PacI fails to cut even once within its 4.7 million bp.

If a mutation has occurred at a restriction endonuclease site, the alteration of bases will prevent the enzyme from cutting. This situation is illustrated in Table 9-2, where a change from an AT base pair to a CG base pair in an EcoRI restriction site destroys the recognition sequence and prevents EcoRI cleavage. Likewise, insertion or deletion of DNA may lead to the creation or elimination of a restriction site. The use of restriction enzymes is fundamental to some molecular typing methods. Isolates that are clones will have the same DNA base sequence and, therefore, share the same spacing of restriction sites.

When the chromosome of a microbe is cut with a restriction enzyme, many DNA fragments of a variety of lengths are produced according to the spacing of the restriction enzyme recognition sites for that restriction endonuclease. Base mutations (i.e., insertions, deletions, or point mutations) that alter restriction enzyme recognition sites will change the number and size of some of the restriction fragments. Also, nucleotides inserted or deleted between restriction sites will alter the length of restriction fragments.


Table 9-2 Sequence Recognized by Restriction Enzyme EcoRI


5′—G↓AATTC—3′


Recognition sequence for EcoRI.


3′—CTTAA↑G-5′


Arrows indicate site of enzyme cleavage.


5′—GCATTC—3′


3′—CGTAAG—5′


A point mutation occurs. AT base pair changed to CG. Restriction site specificity is lost.


5′—GAAGCAATTC—3′


3′—CTTCGTTAAG—5′


A DNA insertion occurs. Addition of four base pairs. Restriction site specificity is lost.


Note: Point mutations or DNA insertions or deletions cause loss of restriction specificity as shown.


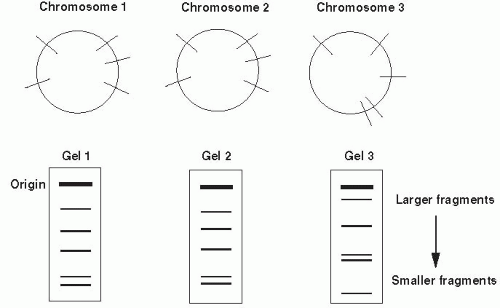
Figure 9-2 Restriction fragment length polymorphisms of three bacterial chromosomes. Lines on circles indicate sites for cutting with a restriction enzyme. Organisms 1 and 2 share restriction endonuclease sites and, therefore, have identical banding patterns on gel electropheresis as depicted. Bacterium 3 has different restriction sites. The fingerprint for organism 3 is different from the other two.

Changes in the genome sequence (which may be detected by altered patterns of restriction enzyme cleavage) are called polymorphisms. Restriction fragment length polymorphism (RFLP) refers to variations in the lengths of restriction fragments; different RFLP patterns indicate genetic differences between strains and suggest that the strains are not clonal. Figure 9-2 is a schematic diagram of the bacterial chromosome illustrating this principle. In the figure, organisms 1 and 2 are clones and, therefore, have an identical restriction site distribution as depicted by the lines cutting the circular chromosome. Organism 3 is
unrelated and has a different restriction site pattern. The differences between organisms may be visualized by separating the fragments resulting from restriction enzyme digestion by gel electrophoresis. Nucleic acid probes and Southern hybridization can also be used to identify specific restriction fragment differences. Only restriction fragments with specificity for the probe are detected (highlighted bands in Figure 9-2). Southern hybridization using a DNA probe to a region known to be highly variable is an efficient, sensitive way of detecting RFLPs.


Gel Electrophoresis

A technique known as gel electrophoresis may be used to separate DNA molecules. In this method, agarose gels are formed with wells, into which small amounts of solutions containing DNA are placed. Agarose is a polysaccharide derived from seaweed, which forms a large matrix through which DNA fragments must migrate. DNA is negatively charged; thus, when a positive electrode is placed at the distal end of the gel and a negative electrode at the proximal end, the DNA migrates in a lane toward the positive charge (Figure 9-3). Usually, this migration occurs on the basis of size, such that small fragments run more rapidly than large fragments. After the separation under an electric charge, the gel is removed from the electrophoresis apparatus and stained using a variety of intercalating fluorescent chemicals such as ethidium bromide, which enable visualization of the DNA bands. Cameras attached to computer systems capture gel images and store or print these files. A molecular weight marker or size standard is always run on the same gel to determine DNA band size.


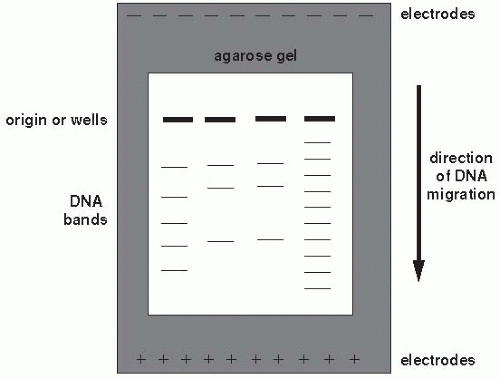
Figure 9-3 Conventional agarose gel electrophoresis. Fourth lane from left indicates molecular weight marker. © 2000, Susan M. Harrington.

Standard agarose gel electrophoresis enables the separation of fragments of DNA ranging in size from 50 bp to approximately 15,000 bp. Beyond 15,000 bp, the DNA molecules are too large to fit easily through the agrose gel matrix and the fragments fail to migrate proportionally to their size. Thus, segments greater than 15,000 bp in size tend to accumulate at the origin of the agarose gel.

An adaptation of standard gel electrophoresis is capillary gel electrophoresis, in which separation is achieved by migration of DNA fragments through a capillary tube containing a polymer in solution. For this application, DNA molecules must have previously been tagged with fluorescent dyes. Instead of the nucleic acid bands being visualized within a gel, the molecules pass by a detector and a fluorescent signal is converted into an electronic signal. This signal is visualized as a series of peaks called an electropherogram. Smaller fragments pass through the capillary first and will appear at the beginning of the electropherogram, with peaks for successively larger fragments following them. Peak heights correlate to the amount of nucleic acid of that size present in the sample. Depending on the application, capillary gels can be used to separate DNA fragments as small as 15 bp and can distinguish between fragments that differ by only 1 bp in size. Automated DNA sequencing relies on capillary electrophoresis.

A modification of standard agarose gel electrophoresis is pulsed-field gel electrophoresis. PFGE enables large fragments of DNA, ranging from 10,000 bp to 5 million bp, to be separated on the basis of size. This technique uses standard agarose gels; however, the electric field in which the DNA migrates is
not applied in just one direction as in conventional electrophoresis. Instead, PFGE utilizes alternating electric fields, in which the current is applied for varying lengths of time in each direction, depending on the size of fragments to be separated. Several electrode configurations have been used by investigators; the most popular system is the contour-clamped homogeneous electric field (CHEF). The CHEF apparatus consists of a hexagonal array of electrodes producing two electric fields at 120° angles to each other (Figure 9-4). The length of time that the current is applied in each direction is referred to as the switch time or pulse time. Larger DNA molecules require longer pulse times, whereas smaller fragments are separated adequately with shorter pulse times. PFGE can be used to separate the fragments created by restriction endonuclease digestion of bacterial or fungal genomic DNA. Such digestion generally yields approximately 10 to 20 bands that have a range of fragment sizes. The array of small, medium, and large size fragments is separated by “ramping” the pulse time. With ramping, the pulse time is increased incrementally from just a few seconds up to several minutes over the course of the run.19 Most users of PFGE purchase CHEF equipment, which can perform these intricate electrical switches with little programming by the operator.


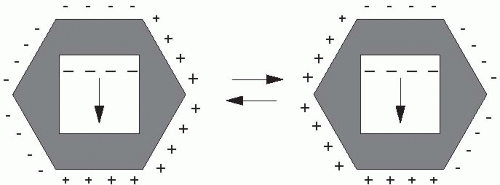
Figure 9-4 Schematic diagram of pulsed-field gel electrophoresis (PFGE) by the contour-clamped homogeneous electric fields (CHEF) technique. Alternation of current is shown. The figure on the left indicates current from northwest to southeast. The figure on the right shows the current from northeast to southwest. © 2000, Susan M. Harrington.

Handling large pieces of DNA requires great care because such DNA fragments are fragile. For PFGE, DNA is extracted from cells that have been immobilized in agarose so that the DNA is not broken by agitation, vibration, or excessive pipetting.


Hybridization and Nucleic Acid Probes

Hybridization refers to the pairing or annealing of nucleic acids, both RNA and DNA, to complementary nucleic acid strands. Because of the rules of base pairing (A pairs with T; C pairs with G), single strands of nucleic acid will anneal or hybridize to complementary strands that have the correct sequence of matching base pairs so as to form a complete set of Watson-Crick pairs. Nucleic acid probe technology, then, is based on the principle of hybridization. Sequences derived from specific genes or other DNA sequences can be used as probes to find places in the genome where their complementary sequences occur. The probe anneals to the genomic target sequences creating new, hybrid dsDNA.

In the process of Southern hybridization, target DNA, which has been digested with a restriction enzyme, is separated by size with agarose gel electrophoresis. The DNA bands are transferred by capillary action or “blotted” onto a nylon or nitrocellulose membrane and immobilized so that they will not come off even in liquid solutions (Figure 9-5). The target DNA, now on the membrane, is chemically treated to permit access to probe DNA. Probe DNA is then added, and hybridization is allowed to occur at the appropriate temperature. The probe DNA seeks out sequences that are complementary to it, and anneals to the target DNA bands immobilized on the membrane. Probe DNA is typically labeled with a radioisotope, or a fluorescent or chemiluminescent substrate. Following hybridization, the membrane is used to expose X-ray film (for radioisotope-labeled DNA) or treated with appropriate reagents to develop the indicator on the probe. This permits visualization of the target bands among the various bands on the membrane (Figure 9-5).


Polymerase Chain Reaction

Polymerase chain reaction is a tool used to amplify short sequences from among a diverse DNA pool such as a bacterial chromosome. The DNA length limits of PCR are sequences of approximately 10,000 bp.
In a standard PCR reaction, two specific oligonucleotide primers are mixed with template DNA. Oligonucleotides are very short segments of DNA, typically 15 to 30 bp in length. The template is the DNA that contains the sequences to be amplified. Template DNA is generated by lysing bacteria, fungi, or viral particles to release their respective genomes. The oligonucleotides are chosen based on the target sequence to be amplified within the template DNA. One oligonucleotide primer is complementary to the forward (top) strand at one end of the target sequence; the second oligonucleotide is complementary to the reverse (bottom) strand at the opposite end of the target sequence (Figure 9-6).


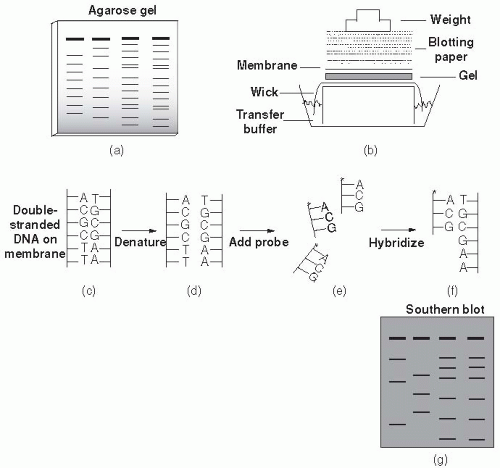
Figure 9-5 (a) Agarose gel electrophoresis. (b) Southern transfer of DNA from agarose gel to nylon membrane, steps involved in hybridization of probe DNA to target DNA on nylon membrane. Double-stranded DNA (c) is separated to the single-stranded form (d). Labeled probe (*) is added (e). Probe hybridizes to complementary DNA to form labeled dsDNA (f). Only bands from the agarose gel (a) with DNA sequence complementary to probe will hybridize. The hybridized Southern blot (g) shows target bands detected by labeled probe. © 2000, Susan M. Harrington.

Polymerases are enzymes that facilitate DNA replication. Because PCR requires both high and low temperatures, thermostable polymerases (e.g., the DNA polymerase enzyme from Thermus aquaticus [Taq]) are used to amplify the target sequence. A typical PCR reaction mixture contains template DNA, oligonucleotide primers, polymerase, magnesium, deoxyribonucleotide triphosphate bases, and a suitable buffer. First, the template DNA is dissociated by heating to 94°C. Oligonucleotide primer annealing then occurs by cooling to a lower temperature such as 55°C; at this stage, the oligonucleotides have an advantage because of their high concentration, and they bind to the target more quickly than the original complementary strand. Finally, an extension phase occurs at 72°C, where the polymerase adds the correct nucleotides to the short primer oligonucleotide strand to create a new complementary strand. After 30-40 cycles of dissociation, annealing, and extension, the result is a large amplification of the target sequence—namely, the sequence between the two oligonucleotide primers called the PCR product or amplicon (Figure 9-6). The amplicon can then be analyzed by agarose or capillary gel electrophoresis, restriction endonuclease analysis, or Southern hybridization.


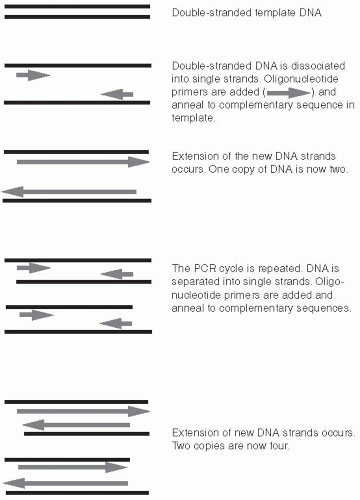
Figure 9-6 Polymerase Chain Reaction Amplification of Template DNA. Two cycles of PCR are shown. Double-stranded DNA is separated into single strands. Primers anneal. New DNA strands are created through extension. Typical PCR reactions are 30 to 40 cycles long, creating millions of copies of double-stranded DNA.


DNA Sequencing

DNA sequencing is used to determine the exact order of nucleotide bases in DNA. This process has experienced many advances since the first DNA sequences were determined. Now a highly automated procedure, sequencing can be used in many applications, ranging from molecular cloning to strain typing and forensics to sequencing whole genomes.

To determine the sequence of a region of DNA, that region is often first amplified by PCR. Following PCR, the double-stranded DNA is separated, and one strand is used as a template for the sequencing reaction. Next, a primer that recognizes the product of the PCR reaction anneals specifically to the template. Nucleotide bases are added to extend the complementary strand. Some of these nucleotides are labeled with fluorescent dye-terminator tags (one color for each nucleotide A, C, G, or T). As these tagged nucleotides (dideoxynucleotides) are incorporated, the extension of the sequence is terminated. The specificity of the added nucleotide is determined by the color of the label. This “sequencing” reaction occurs in cycles similar to PCR and yields products of varying lengths, each with a specific end label indicating the incorporated nucleotide. These DNA products are then separated according to size by capillary gel electrophoresis. The products pass a laser that determines which nucleotide has been incorporated based on the terminator dye fluorescence, and the resulting electropherogram displays the DNA sequence.


Microarrays

An oligonucleotide microarray (i.e., DNA chip) is an efficient method for detecting DNA sequences of interest. With this technique, more than 10,000 different oligonucleotides can be attached to a 1 cm2 solid
surface. The location of each DNA on the surface acts as an identifier. Unknown sequences that are complementary to known oligonucleotides on the DNA chip hybridize, allowing for their subsequent identification. Examples of the various formats used for SNP typing with microarrays include hybridization arrays and arrays with enzymatic processing. For hybridization arrays, alleles of known SNPs located at specific regions of a “chip” are allowed to hybridize with query SNPs present in fluorescently labeled PCR products. Hybridization results in positive signals that are detected by a computer, leading to identification of unknown SNPs. During arrayed primer extension, PCR products containing unknown SNPs are hybridized to the arrayed oligonucleotides. Bound oligonucleotides act as primers for a DNA polymerase extension reaction that incorporates fluorescently labeled dideoxynucleotides. The addition of enzymatic discrimination increases the specificity of the latter method.20

As typing methods are the focus of this chapter, the next section examines how these techniques use frequent and infrequent cutting enzymes, PFGE, hybridization, PCR, sequencing and microarrays to detect strain differences based on DNA sequence and/or restriction site specificities.


SPECIFIC TECHNIQUES OF MOLECULAR EPIDEMIOLOGY

This section describes the most commonly used nucleic acid molecular methods. Strengths and weakness of each method are highlighted, and examples are included. With the exception of methods that utilize DNA sequencing, these methods rely on visualization of DNA fragments, whether they are from plasmids, restriction digests, hybridization, or PCR products. These banding patterns serve as the “DNA fingerprints” used to compare one isolate to another.21


Evaluation of Typing Systems

Different typing systems measure different biologic properties and perform with varying degrees of success depending on the organism and technical requirements. No one system is best for all species, although several methods can be applied to almost all bacterial species, especially those causing the majority of hospital-associated outbreaks. As with other clinical laboratory methods, strain typing techniques must be carefully evaluated before they are used to answer epidemiologic questions. The specific question that needs to be answered may lead to the selection of one method over another.

To be widely useful, a typing system must give an interpretable result for every isolate of a given species—a capacity referred to as typeability. Plasmid analysis—one of the earliest typing methods—detects the extra-chromosomal DNA of bacteria. However, not all strains within a species will contain plasmids, rendering them nontypeable by this method.

Reproducibility is another critical factor for typing systems. An assay cannot be considered reliable if the same results are not obtained when an isolate is tested multiple times in the system. Some molecular methods are highly technique dependent in this sense. For example, the reaction conditions, reagents, and template DNA used in the arbitrarily primed PCR reaction must be carefully standardized or a different result could be obtained with each run. Thus standardization is another important component. Interpretation of results is much more reliable when methods are performed in the same way from batch to batch.14

Discriminatory power is the ability of the typing technique to distinguish unrelated isolates from epidemiologically related strains. It is critical to include epidemiologically unrelated strains in the evaluation of new typing systems as controls. Many methods are able to link closely clustered isolates; however, the more challenging aspect of such analysis is to exclude unassociated strains. Often some isolates are found with a molecular link for which no epidemiologic link exists. The key is to minimize this phenomenon with the most powerful typing tool available.14 It must also be understood that to some degree the ability to discriminate related from unrelated isolates is species dependent. For example, the number of different clones of MRSA is much more limited than the corresponding number for methicillin-susceptible strains, as a result of the way the methicillin resistance gene was acquired by some strains of the species.22 The limited number of clones could cause the test operator to falsely link strains that are truly unrelated. For MRSA, then, it is important to compare isolates over a short time frame and to combine laboratory results with careful epidemiologic analysis.

Discriminatory power may be calculated with Simpson’s index of diversity:


where D is the index of diversity (0-1), N is the number of isolates tested, K is the number of strain types
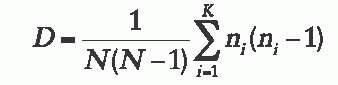
derived by the method, and n is the number of isolates of the ith type. Typing systems with a discriminatory index greater than 0.90 are considered to have effective power.23 One caveat to consider when applying this formula, however, is that the definition of a strain type must be determined; that is, the number of band differences or mutations that must occur for two isolates to be considered different types must be known. Accepted definitions of strain type are defined in the literature for some methods, but not all.

The ease of interpretation or readability of DNA fingerprints varies. Some methods, such as chromosomal restriction endonuclease analysis, produce many bands that are difficult to distinguish because they are so close together. Faint or very bold bands can be equally difficult to discern. Interpretability can vary between methods or even between applications of a single method. For example, in Southern hybridization methods, one probe may yield a much more readable RFLP than another. In the last 10 years, more investigators have begun using sequence-based methods to ease the burden of interpreting the bands generated by fingerprinting methods.

Issues of cost-effectiveness, ease of use, ease of interpretation, and turnaround time must also be considered when selecting an analytical technique. As molecular methods have become more discriminatory, their use has come to require increasingly more expensive and sophisticated machinery, including PCR thermocyclers, PFGE equipment, DNA sequencers, and computer software for archiving data and comparing run-to-run results. The time to obtain results using these powerful techniques may range from 1 or 2 days for PCR to approximately 4 days for PFGE and RFLP. Likewise, the technical expertise needed to perform molecular techniques varies from simple DNA extraction to lengthy hybridization procedures. Finally, interpretation of banding patterns and results is method dependent as well.

The choice of a typing method depends on all of these parameters; it will vary with the needs and capabilities of individual laboratories. As each method is presented here, it is evaluated based on these criteria.


Plasmid Analysis

As described, some bacterial strains harbor extrachromosomal DNA called plasmids. Analysis of plasmid DNA is one of the oldest of the nucleic acid-based methods for strain typing and has been used in the evaluation of many outbreaks.24 This method can easily be applied in many investigations, as plasmids are frequently present in bacterial cells and easily extracted for analysis with the inexpensive agarose gel electrophoresis equipment found in many laboratories.

On a practical level, some difficulties may be encountered when plasmid gel electrophoresis is performed. Plasmid DNA can range in size from just a few kilobases to almost 200 kb. Due to the size and secondary structure of plasmids, gels can have poor reproducibility and can be difficult to interpret. These problems can be overcome by cutting the plasmid DNA with a restriction enzyme. Referred to as plasmid restriction enzyme analysis (REA), this method creates smaller, linear fragments that migrate faithfully according to size, and the bands on the gels are then more easily interpreted. Cutting with a restriction endonuclease is dependent on DNA sequence; therefore, REA can distinguish whether single, large plasmids are the same in terms of both DNA content and size. The number of REA bands increases proportionately with the number of plasmids. Unfortunately, as band number increases, interpretation becomes more difficult.

When applying this method, the variable nature of plasmids must be appreciated. Depending on the environment and the antibiotic resistance genes or virulence factors encoded by the plasmids that a bacterium harbors, plasmids can be gained or lost because of selective pressures. Hence, depending on which antibiotic therapy is in use, strains involved in an outbreak can evolve through changes in plasmid content even as the outbreak is being evaluated.25 Movement of plasmids (or the transposable elements that they carry) between strains of the same species and even between species has been observed.26, 27 Thus a plasmid epidemic could be encountered.28 Plasmid results must be evaluated carefully in comparison to the susceptibility profiles of the organisms isolated at the time of an outbreak.

Two other factors should be considered when using plasmid analysis. First, not all strains will give a result because some do not carry plasmids. Second, because plasmid analysis focuses on only a small part of the genome, two bacterial strains might have the same plasmid content, yet possess unique chromosomes. With these comments in mind, it is probably best to apply this typing technique to studies that are relatively limited in time span and to combine plasmid analysis with other methods.


Restriction Endonuclease Analysis of Chromosomal DNA

Analysis of chromosomal DNA is an alternative to plasmid typing methods. The chromosome is the
more stable genetic element, not subject to gain and loss as is the plasmid. Chromosomal REA is performed by extracting genomic DNA and cutting it with a restriction endonuclease that cuts frequently. Hundreds of fragments approximately 0.5 to 50 kb in length are produced, which are then separated by conventional gel electrophoresis. The advantages of chromosomal REA are twofold: (1) with the correct selection of restriction enzyme, all bacterial species are typeable, and (2) this technique is easy to perform. However, the large number of bands produced makes interpretation difficult.15, 29 Chromosomal REA has been largely replaced by newer methods.


RFLP Analysis Using REA with Southern Hybridization

The interpretability of chromosomal REA has been improved with the addition of nucleic acid probes targeted to specific multicopy genes, insertion sequences, or mobile genetic elements such as transposons. With this technique, DNA cut with a frequent-cutting restriction endonuclease is first separated in agarose. Next, the DNA fragments are transferred from agarose to a membrane by the Southern blotting technique. The DNA fragments immobilized on the membrane can then be hybridized with a nucleic acid probe. Only a small portion (ideally 10 to 20) of the thousands of restriction fragments will have specificity for the probe and will be detected. This technique—known as restriction fragment length polymorphism—detects the number of copies of sequence homologous to the probe and reflects the size of the restriction fragments containing those sequences. The number of bands will be proportional to the number of copies of the target as long as the target does not contain a restriction site. When a single restriction site is present within the target sequence, the probe will hybridize along both sides of the restriction site and two bands will be produced for each copy of target.

Several probes are most commonly used for RFLP typing; however, theoretically, any repetitive sequence with species specificity can work. For example, the mec A gene, which encodes methicillin resistance, and Tn554, a transposon, have both been used as probes of chromosomal digests for oxacillin-resistant S. aureus.22, 30 Other types of probes have included insertion sequences, toxin-producing genes, and even random chromosomal sequences.18 Nevertheless, most of these probes are specific to only a single species, and sometimes only to strains within a species carrying the gene of interest.

Ribotyping has been a popular approach to RFLP typing, almost universally applicable to bacterial species. In this method, ribosomal RNA (rRNA) or DNA homologous to the ribosomal operon is used as the probe. The ribosomal operon, which encodes the rRNA transcripts essential to make a ribosome, is highly conserved within bacterial species and is usually present in multiple copies in the chromosome. Organisms such as E. coli, Klebsiella, and Staphylococcus species have 5-7 copies of this element, producing easily interpreted ribotype patterns with 10-15 bands.31 Ribotyping is not of value for strain delineation of M. tuberculosis because only one copy of the ribosomal operon is present in this organism’s chromosome.

Several repetitive elements have been studied as probes for RFLP.32, 33 IS6110, an insertion sequence present in 1 to 26 copies in M. tuberculosis complex organisms, has been widely used as a typing tool for this species.34 Rarely, M. tuberculosis or related organisms will lack IS6110; most of these aberrant strains have come from cases in Southeast Asia. Additionally, as many as 25% of isolates have fewer than six bands when M. tuberculosis DNA is hybridized with IS6110.35 Figure 9-7 is an example of an IS6110-probed Southern blot of M. tuberculosis. Isolates with low band numbers are shown in lanes 3 and 5. The fewer the bands present, the less reliable the discrimination and other methods must be used. Mycobacterial interspersed repetitive units and spoligotyping, discussed later in this chapter, are alternatives to IS6110 fingerprinting for M. tuberculosis. RFLP with IS6110 has been used to study transmission in large cities and HIV-infected populations, epidemiology between nations, laboratory contamination, and outbreaks.36, 37, 38, 39 and 40 In Figure 9-7, lanes 1 and 10 contain DNA from a well-characterized M. tuberculosis strain that is used as a standard molecular-weight marker. Inclusion of a bacterium as a marker instead of purchasing one commercially is highly desirable. Not only does using DNA from a live organism serve as a determinant of molecular size, but it is also a useful extraction control. To be confident of the extraction process in the laboratory, every time this strain’s DNA is extracted and cut with the indicated restriction enzyme, the same number and size of bands must be obtained.

Only gold members can continue reading. Log In or Register to continue

Stay updated, free articles. Join our Telegram channel

Jul 8, 2016 | Posted by in INFECTIOUS DISEASE | Comments Off on Molecular Epidemiologyand Infectious Diseases

Full access? Get Clinical Tree

Get Clinical Tree app for offline access