Epidemiology and Prevention of Influenza


Epidemiology and Prevention of Influenza


Mark C. Steinhoff


INTRODUCTION

Influenza remains a major respiratory infection, responsible for a global total of 250,000 to 500,000 deaths per year. Influenza virus has a unique epidemiology in two aspects: (1) annual epidemics of this respiratory disease with attack rates of 10% to 30% occur in all regions of the world, and (2) it is the classical emerging infection, with global pandemics arising when new antigenic variants emerge. Influenza viruses are epizootic in avian and animal species, and analyses of nucleic acid sequences suggest that human influenza A viruses derive from avian influenza viruses. The antigenic variation of this virus is the key to its ability to cause annual epidemics and periodic pandemics. Because antigenic change is random and not predictable, the influenza virus will continue to cause widespread epidemics, although many aspects of the epidemiology and variability of this virus are understood and effective antivirals and vaccines are available. Current control strategies require reevaluation to achieve a true reduction in the toll of influenza morbidity and mortality, and enhanced pandemic preparedness is essential.


CLINICAL FEATURES OF INFLUENZA

The word influenza is from the Italian (derived from Latin influentia), referring to the influence of the stars, reflecting ancient concepts of the causation of influenza epidemics. The clinical disease influenza is familiar, because almost everyone has been infected. It is characterized by an abrupt onset of fever and respiratory symptoms, including rhinorrhea, cough, and sore throat.1 Myalgia and headache are more common with influenza than with other respiratory viral infections, and the malaise and prostration of this disease are well known. Gastrointestinal symptoms are not common in adults, but 50% of infants and children may experience vomiting, abdominal pain, and diarrhea with influenza. Influenza disease is usually self-limited, lasting for 3 to 5 days, but complications, which are more frequent in the elderly and persons with chronic illnesses, can prolong illness. Some patients may develop a primary influenza viral pneumonia, which can be severe. More commonly, a secondary bacterial pneumonia may occur up to 2 weeks after the acute viral infection.2, 3 In infants and children, otitis media and croup are common complications. Other, less frequent complications include myocarditis, myositis, and encephalitis. Reye’s syndrome, a hepatic and central nervous system (CNS) complication seen in children, is associated with the use of aspirin and other salicylates.


TRANSMISSION

Influenza virus spreads through respiratory secretions of infected persons, which may contain as many as 105 virus particles/mL. An infected person generates infectious aerosols of secretions during coughing, sneezing, and talking. In addition, infectious secretions are spread by direct (by kissing) or indirect (by nose-finger-doorknob) contact with respiratory mucosa. The inhaled virus attaches to columnar epithelial cells of the upper respiratory tract and initiates a new infection in the host. The incubation period is from 1 to 4 days, and infected hosts are capable of transmitting the virus from shortly before the onset of clinical disease up to the fourth or fifth day of illness.


THE VIRUS

Influenza virus was one of the first human viruses to be cultured and studied. In 1933, Wilson Smith, Andrews, and Laidlaw in the United Kingdom first isolated human influenza type A virus from an ill ferret (infected by secretions from an ill patient, Andrews).5 Burnet developed the technique of culture in hens’ eggs in 1936, which enabled study of the viruses and the development of vaccines. Influenza type B virus was isolated in 1940, and type C virus in 1947.

Influenza type A and B viruses contain eight segments of single-stranded RNA that code for 11 proteins. Influenza type C has seven RNA segments and a single surface glycoprotein. Table 15-1 summarizes the gene segments and their associated proteins.


Table 15-1 The Genes of Influenza A Virus and Their Protein Products


RNA Segment Number


Gene Product


Protein


Proposed Functions of Protein


1


PB1


Polymerase


RNA transcriptase


2


PB2


Polymerase


RNA transcriptase (host range determinant)


3


PA


Polymerase


RNA transcriptase


4


HA


Hemagglutinin


Viral attachment to cell membranes; major antigenic and virulence determinant


5


NA


Neuraminidase


Release from membranes; major antigenic determinant


6


NP


Nucleoprotein


Encapsidates RNA, type-specific antigen


7


M1


Matrix


Surrounds viral core; involved in assembly and budding


M2


Ion channel


8


NS1


Nonstructural


RNA binding, anti-interferon


NS2


Nonstructural


Unknown


The hemagglutinin (HA) and neuraminidase (NA) are surface glycoproteins that are important in both pathogenesis and immune protection from infection. The HA functions as the attachment protein, mediating attachment to sialic acid-containing glycoproteins on columnar epithelial cells of the respiratory tract. HA has a binding site that is highly conserved and surrounded by five specific antigenic epitopes that manifest rapid changes. A specific antibody to these HA epitopes prevents attachment and entry of influenza viruses into host cells. HA specificity for receptor binding is a determinant of which species can be infected, or host range.6 This protein is also a virulence determinant. It must be cleaved into H1 and H2 proteins by host proteases to create a hydrophobic tail necessary for fusion of viral and host cell membranes. The host proteases are found in human respiratory and avian enteric tissues. In avian viruses, the introduction of basic amino acids near the HA cleavage site permits cleavage by proteases of other tissues, which allows viral infection of vascular, CNS, and other tissues (pan-tropism) and a dramatic increase in virulence. The NA cleaves sialic acid residues to allow virus release
from the host epithelial cell; specific anti-NA antibody presumably diminishes release of virons from host cells.

Of the 8 influenza genome segments, five have been present in influenza viruses circulating globally since at least 1918. Three genome segments (HA, NA, and PB1 polymerase) have been newly acquired through reassortment with avian influenza viruses. Each reassortment with an acquisition of a new gene segment coincided with global pandemics (see Table 15-1).

The subtypes of influenza A virus are determined by these two surface antigens, NA and HA. Among influenza A viruses that infect humans, three different HA subtypes have classically been described— H1, H2, and H3. Three more subtypes—H5, H7, and H9—have also recently been shown to infect humans.


NOMENCLATURE

The nomenclature of influenza viruses is necessarily somewhat complex because of the need to name all new strains. Virus strains are named with (1) the virus type, (2) the geographic site of first identification of the specific virus, (3) the strain number from the isolating laboratory, (4) the year of virus isolation, and (5) the virus subtype (for influenza A). For example, one of the viruses in the influenza vaccine that was recommended for 2004-2005 was A California/7/2004(H3N2). This refers to a type A virus first isolated in California in 2004, as laboratory strain number 7, which is subtype H3N2. The earliest isolate of influenza is A/WS(WilsonSmith)/33/H1N1.


EPIDEMIOLOGY OF EPIDEMICS AND PANDEMICS

The influenza virus causes annual epidemics of disease, and has caused five global pandemics in the last 100 years (pandemic from the Greek: pan = “all,” demos = “people”). Pandemics of febrile respiratory disease that resemble influenza have been described since the days of Hippocrates (Table 15-2). The characteristic pattern of an influenza pandemic is initiation from a single geographic focus (often in Asia) and rapid spread, often along routes of travel.7 High attack rates of all age groups are observed. Although case fatality rates are usually not increased substantially, because of the very large number of infections and cases, the number of hospitalizations and deaths is unusually high. In a pandemic, multiple waves of infections can sweep through a community, with each wave infecting sectors of the population different from those affected in the initial pandemic episode.

The 1918 Spanish influenza pandemic had an attack rate of 20% to 30% in adults, and 30% to 45% in children. The case fatality rate in adults was as high as 15% to 50%, with an unusual occurrence of deaths in young adults (Figure 15-1) and pregnant women. An estimated 20 to 50 million persons died in a single year in this global pandemic, many of them young adults (see the text box, “1918 Pandemic Flu”).


Table 15-2 Antigenic Shifts of Influenza A Virus


Years


Virus Description


Antigenic Change (Source)


Pandemic


1889


H3N2a


Not known


Severe


1900


H3N8a


Not known


Moderate


1918→1956


H1N1 “Spanish”


HA, NA (? swine)


Major; 50 million deaths in first year


1957→1968


H2N2 “Asian”


New HA, NA, PB1 (avian)


Severe


1968→


H3N2 “Hong Kong”


New HA,b PB1 (avian)


Moderate


1977→


H1N1 “Russian”


Apparently identical with 1956 H1N1c


Relatively mildd


2009→


H1N1 pdm 09


Triple reassortant (see text)


Moderatee


Notes:


a Data derived from serology; pandemic virus not available for study because influenza virus was first cultured in 1933.
b New human H3Ha varied by only six amino acids from parent avian H3HA, with all changes at sites important for receptor binding and antigenicity.
c May have escaped from a laboratory.
d Those aged more than 22 years had antibody from the 1918-1956 H1N1 strain.
e Those aged more than 60 years had antibody from the 1918 H1N1 strain of the 1940s.


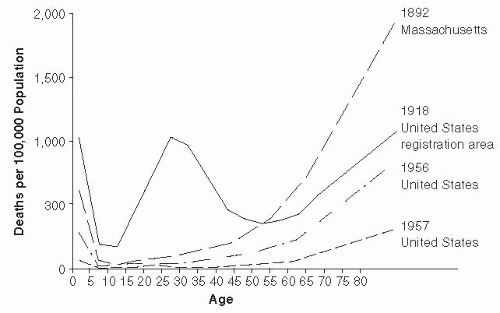
Figure 15-1 Age Distribution of Mortality of Selected Influenza Epidemics in the United States. Reproduced from C.C. Dauer and R.E. Sterling, 1961, Mortality from Influenza, American Review of Respiratory Diseases, vol. 82, Supplement, pp. 15-26. Official Journal of the American Thoracic Society.


Annual local epidemics follow a fairly predictable pattern. In North America, epidemics usually occur between November and March, manifested first by high rates of school and industrial absenteeism, followed by an increase in visits to healthcare facilities, an increase in pneumonia and influenza hospital admissions, and finally an increase in deaths from pneumonia or influenza. In any single locality, the influenza epidemic begins abruptly, reaches a peak within 3 weeks, and usually ends by 8 weeks. A city or region can experience two sequential or overlapping epidemics with different strains of viruses in a single winter. Epidemics in the Southern Hemisphere usually occur in the May to September winter season. The circulation of influenza viruses in the tropics links the two hemispheres8, 9 (as discussed later in this chapter). Virus spread during the winter season is said to be favored by the fact that the influenza virus survives better in environments of lower temperature and humidity. In tropical areas, its spread during the monsoon suggests that indoor crowding caused by weather may be a more important factor in transmission.10


A recent evaluation of the global patterns of seasonal activity of influenza virus analyzed data from the Northern and Southern Hemispheres from 1997 to 2005 in 19 temperate countries.11 The important findings were that temporal overlaps of influenza activity between the two hemispheres occurred for the H3 and B types. Type B epidemics occurred significantly later in the season than H3 or H1 epidemics. Type H3 was the dominant or codominant virus in most seasons, and was the most widespread geographically. Countries more distant from the equator experienced influenza epidemics later in the year. This observation suggests that the later-winter seasonality of influenza epidemics may not be entirely related to winter environmental factors such as lower temperature, decreased humidity, or increased indoor crowding, because winter starts earlier in the year in the higher latitudes. It does suggest that transmission of specific virus strains from tropical regions might be an important factor accounting for later onset of epidemics in the higher latitudes.


INFLUENZA IN TROPICAL AND SUBTROPICAL REGIONS

Until recently, the burden of influenza in these regions has been underestimated because of the lack of laboratory capacity. The lack of laboratories able to diagnose influenza resulted in a reporting bias that artificially reduced the estimates of influenza incidence rates. In the last few years, increased concern has created increased awareness of the risk of pandemic influenza, which in turn has substantially expanded the ability to detect and characterize influenza viruses in tropical regions. This increased testing has provided new information regarding the epidemiology and disease burden.12 In a review of these data,9 it was reported that the major difference between tropical regions and the higher latitudes is that seasonality is less marked in tropical regions. Year-round surveillance has revealed that influenza viruses circulate for 9-12 months per year. Many settings show year-round presence, with seasonal increases in incidence, associated with monsoon or other climactic patterns. The perennial presence of influenza virus is related to the sequential circulation of many different virus types. The perennial presence and the number of types of circulating virus overall increase the exposure of the local population to influenza virus infection, as well as the burden of disease.9 Incidence rates in Bangladesh show 102 infections per 1000 child-years for children younger than 5 years old—an annual 10% incidence. A detailed prospective serologic surveillance study showed an incidence rate of 32/100 infants.13 These data suggest that children in this region have infection rate five times greater than that documented in the United States.

The constant presence and variety of influenza virus in the tropics suggest a mechanism for the generation and dissemination of new epidemic drifted influenza virus strains. A recent analysis of genetic and antigenic distribution and shifts showed temporally overlapping viral epidemics in East and Southeast Asia, which sustain a network of continuously circulating influenza viruses. Commonly, one of these viruses undergoes antigenic drift that favors local spread and migrates to Oceania, North America, Europe, and South America along the major air routes.7 A comparison of phylogenetic relationships between influenza A/H3N2 viruses in 1999-2005 in New Zealand and New York concluded that global viral migration accounted for seasonal emergence of new strains.14 The continuous presence of multiple influenza virus strains in tropical regions has implications for immunization policy, as neither Northern nor Southern Hemisphere vaccines may be ideal in tropical settings characterized by perennial circulation of diverse influenza viruses.

In general, rates of infection in infants and children are higher than those in adults, and the rates of hospitalization are highest in infants, lower in children, and high in the elderly.15, 16 Infants younger than 6 months old have the highest rates of seeking medical care for influenza illness. In some winters, as many as 9% of all infants are seen in clinics or admitted for such an infection.15 Families with school-aged children have the highest rates of infection. These observations suggest that relatively immunologically naive children are important in the spread of epidemic strains.

Only gold members can continue reading. Log In or Register to continue

Stay updated, free articles. Join our Telegram channel

Jul 8, 2016 | Posted by in INFECTIOUS DISEASE | Comments Off on Epidemiology and Prevention of Influenza

Full access? Get Clinical Tree

Get Clinical Tree app for offline access