John J. Treanor
Influenza (Including Avian Influenza and Swine Influenza)
Influenza is an acute, febrile illness caused by infection with influenza type A or B virus that occurs in outbreaks of varying severity almost every winter in temperate climates and year-round in tropical climates. The most common clinical manifestations are fever, malaise, and cough. Two unique features of influenza are the epidemic nature of the disease and the mortality that results in part from its pulmonary complications.
History
Influenza virus has been causing recurrent epidemics of febrile respiratory disease every 1 to 3 years for at least the past 400 years. Although the disease is not associated with a characteristic manifestation such as rash, the high attack rate, the explosive nature of the epidemic, and the frequency of cough allow the identification of past epidemics. For example, Hirsch tabulated 299 outbreaks occurring at an average interval of 2.4 years between 1173 and 1875.1 The greatest pandemic in recorded history occurred in 1918-1919 when, during three “waves” of influenza, 21 million deaths were recorded worldwide, among them 549,000 in the United States.2
The modern understanding of influenza was ushered in by Smith and associates when they isolated influenza A virus in ferrets in 1933.3 Influenza B virus was isolated by Francis in 19394 and influenza C virus by Taylor in 1950.5 The discovery by Burnet in 1936 that influenza virus could be grown in embryonated hens’ eggs allowed extensive study of the properties of the virus and the development of inactivated influenza vaccines (IIVs).6 Animal cell culture systems for the growth of influenza viruses were developed in the 1950s.7 The phenomenon of hemagglutination, which was discovered by Hirst in 1941, led to simple and inexpensive methods for the measurement of virus and specific antibody.8
Evidence of the protective efficacy of IIVs was developed in the 1940s.9 The use of live vaccines for influenza was first suggested shortly after the virus was discovered,10 but the first live vaccine was not licensed in the United States until 2003, approximately 70 years later. Finally, four antiviral agents in two classes have been approved for prevention and treatment of influenza. These include the M2 inhibitors amantadine, in the mid-1960s, and rimantadine, in 1993, and the neuraminidase inhibitors (NAIs) zanamivir and oseltamivir, in 2000.
The Viruses
Classification
Influenza viruses belong to the family Orthomyxoviridae and are classified into three distinct types: influenza A virus, influenza B virus, and influenza C virus. Influenza A and B viruses can cause outbreaks and epidemics, and influenza A virus generally causes more severe and widespread disease. Influenza C virus causes sporadic upper respiratory tract illness. There are significant differences in genetic organization, structure, host range, epidemiology, and clinical characteristics between the three influenza virus types (Table 167-1). However, all three viruses share certain features, including the presence of a host cell–derived envelope, envelope glycoproteins of critical importance in virus entry and egress from cells, and a segmented genome of negative-sense (i.e., opposite of message-sense), single-stranded RNA. The standard nomenclature for influenza viruses includes the influenza type, place of initial isolation, strain designation, and year of isolation. For example, the influenza A virus isolated by Francis from a patient in Puerto Rico in 1934 is given the strain designation A/Puerto Rico/8/34, sometimes referred to as PR8 virus. Influenza A viruses are further divided into subtypes on the basis of their hemagglutinin (H, or HA) and neuraminidase (N, or NA) antigens (e.g., H1N1 or H3N2).
TABLE 167-1
Differences among Influenza A, B, and C Viruses
| INFLUENZA A | INFLUENZA B | INFLUENZA C | |
| Genetics | 8 gene segments | 8 gene segments | 7 gene segments |
| Structure | 10 viral proteins | 11 viral proteins | 9 viral proteins |
| M2 unique | NB unique | HEF unique | |
| Natural host range | Humans, swine, equine, birds, marine mammals* | Humans only | Humans and swine |
| Epidemiology | Antigenic shift and drift | Antigenic drift only; two main lineages cocirculate | Antigenic drift only; multiple variants |
| Clinical manifestations | May cause large pandemics with significant mortality in young persons | Severe disease generally confined to older adults or persons at high risk; pandemics not seen | Mild disease without seasonality |

* Influenza A viruses have also been isolated from mink, dogs, and cats.
Virology
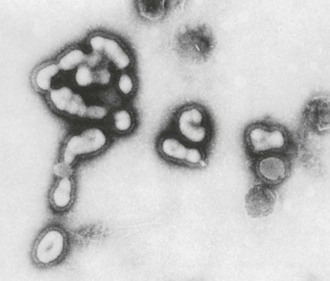
Influenza viruses are enveloped viruses that may exist in spherical or filamentous forms of 80 to 120 nm (Fig. 167-1), with surface projections consisting of HA and NA spikes. A schematic diagram of an influenza A virus is shown in Figure 167-2.
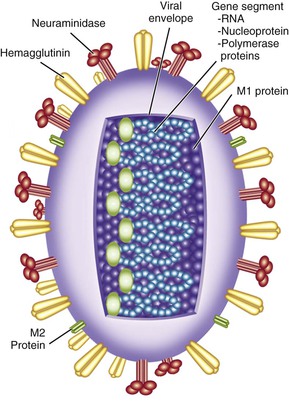
The HA is the viral attachment protein, and the receptor binding site is located in the globular head of the molecule. Each rod-shaped HA spike measures approximately 4 nm in diameter by 14 nm in length. The spikes can be removed from the intact virion by sodium dodecyl sulfate, by bromelain, or by chymotrypsin. Each spike is a trimer composed of three HA polypeptides, each with a molecular weight of 75,000 to 80,000 Da, resulting in a trimer with a molecular weight of approximately 224,640 Da. The HA is synthesized as a monomer (HA0), which is cleaved by host cell proteases into HA1 and HA2 components that remain linked together.
In birds, the ability of the HA to be cleaved by proteases plays an important role in pathogenesis. Proteases capable of cleaving the HA of avirulent viruses, such as tryptase Clara,11 are restricted in distribution to cells of the respiratory and gastrointestinal mucosa, thereby limiting replication to these areas. However, addition of several basic amino acids to the cleavage site12 renders the HA capable of being cleaved by ubiquitous cellular furin-like proteases13 and allows these viruses to escape the confines of the mucosa and replicate systemically in chickens.14 The potential role of HA cleavability in pathogenesis in humans is currently unknown.
The viral NA is an enzyme that catalyzes the removal of terminal sialic acids (N-acetyl neuraminic acid) from sialic acid–containing glycoproteins. The NA spike is shaped like a mushroom rather than a rod and has a molecular weight of 240,000 Da. The intact NA consists of a tetramer of NA polypeptides, each with a molecular weight of 58,000 Da. The enzyme active site is located in the mushroom-shaped head.
At least 16 highly divergent, antigenically distinct HAs have been described in influenza A viruses (H1 to H16), as well as at least nine distinct NAs (N1 to N9). A new influenza virus from bats has been tentatively assigned to H17.15 The NA of this virus may represent N10, although it does not actually have NA activity.16 A third integral membrane protein, the M2 protein, is also present in small amounts on the viral envelope.
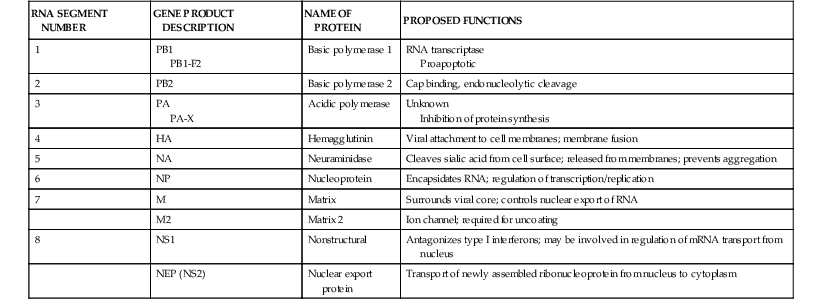
Interior to the envelope is the matrix, or M1, protein. This protein provides structure to the virion and is important for virus assembly. Within the influenza A virion are eight physically discrete nucleocapsid segments (Table 167-2), which code for 10 viral proteins, including HA and NA. Each nucleocapsid is composed of a single segment of genomic RNA and is intimately associated with the viral nucleoprotein (NP), with the three polymerase proteins PB1, PB2, and PA bound to one end. Two nonstructural viral proteins, NS1 and NS2 (also referred to as the nuclear export protein [NEP]), are also found within infected cells. Small amounts of NEP are present within virions. Influenza B virions also have eight gene segments that code for 11 viral proteins, whereas influenza C virions have seven gene segments that code for 9 viral proteins (see Table 167-1).
Although influenza B viruses have a similar structure to influenza A viruses, they do not exhibit the same type of antigenic and genetic variation in the HA and NA and therefore do not have subtypes. However, since 2001, two antigenically distinct lineages of influenza B viruses, called the “Victoria” lineage and the “Yamagata” lineage, have cocirculated in humans.17
Influenza viruses enter the cell by attachment of the viral HA to sialic acid–containing receptors on the cell membrane, followed by internalization of the virus into an acidic endosome. In the acidic environment of the endosome, the HA undergoes a conformational change that liberates a fusion peptide and results in fusion of the viral envelope with the endosomal membrane. At the same time, the third envelope protein, the M2 protein, acts as an ion channel allowing hydrogen ions to enter the virion from the endosome. This, in turn, allows the viral gene segments to leave the virion and enter the cytoplasm, a process known as uncoating.
Viral gene segments are transported to the nucleus, where the viral polymerase complex, composed of the proteins PB1, PB2, and PA, directs the synthesis of the plus-sense messenger RNA (mRNA) as well as synthesis of negative-sense copies that will serve as progeny genomic RNA. The polymerase proteins also play a role in disruption of host cell protein synthesis. Because replication takes place in the nucleus, some mRNA are spliced, giving rise in the case of influenza A viruses to the M2 protein from the M gene segment and the NS2, or NEP, from the NS gene segment. Alternative start codons also give rise to a number of additional proteins from the polymerase genes of influenza A viruses, including PB1-F218 and PA-X,19 which may play roles in pathogenesis.
Negative-sense daughter virion RNAs are encased in nucleoprotein, associated with one copy of the polymerase complex, and transported to the cytoplasm for assembly at the cell surface. Envelope proteins are glycosylated and transported to the cell surface. Virions bud from selected lipid rafts at the cell surface, acquiring an envelope derived from the cell membrane and decorated with HA, NA, and small amounts of M2 protein. Finally, the NA removes sialic acid from receptors on the cell surface or on the viral envelope, allowing the progeny viruses to leave the infected cell.
Because the genome of influenza virus is segmented, segments can be exchanged between viruses infecting the same cell, a process referred to as reassortment. Genetic reassortment plays an important role in the generation of pandemic influenza A viruses and has also been utilized for the construction of live-attenuated influenza vaccines (LAIVs).
Epidemiology
Disease Impact
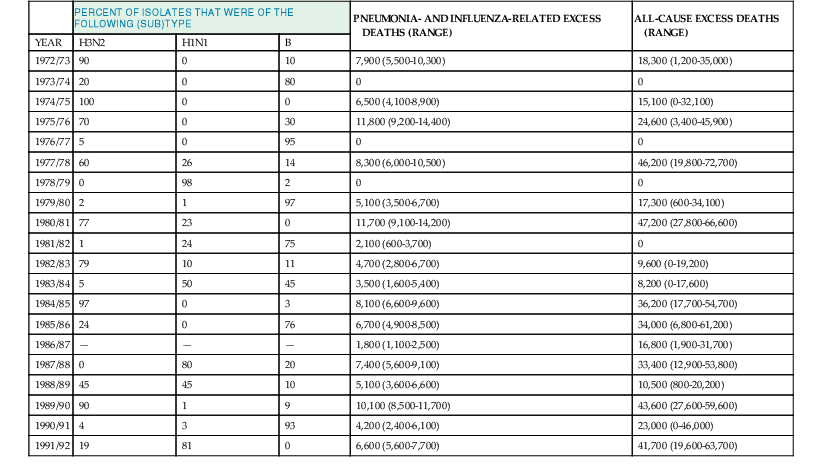
Influenza epidemics are regularly associated with excess morbidity and mortality, usually expressed in the form of excess rates of pneumonia- and influenza-associated hospitalizations and deaths during epidemics. To estimate the mortality burden of influenza, observed pneumonia- and influenza-related deaths during periods of influenza epidemic activity are compared with an expected seasonal baseline derived from a time-series regression model and the excess mortality attributable to influenza is calculated. A tabulation of levels of these excess pneumonia and influenza deaths attributable to influenza epidemics20 is shown in Table 167-3, as well as the estimated percentage of isolates, which were typed as influenza A/H3N2, A/H1N1, or B in each year. Generally, the level of excess mortality is highest in years when influenza A/H3N2 viruses predominate,20 but influenza B and, to a lesser extent, A/H1N1 viruses also can be associated with excess mortality. Because not all influenza-related deaths are manifested as pneumonia, the pneumonia and influenza mortality statistics probably underestimate the true impact of influenza on the population.21 Table 167-3 also lists the all-cause excess mortality, defined as deaths due to any cause, above a similarly derived baseline, that occur during periods of influenza epidemic activity. Although less precise than the pneumonia- and influenza-related deaths, all-cause mortality is probably a more accurate reflection of the total burden of influenza. Recent estimates suggest that as many as 51,000 deaths annually in the United States can be attributed to influenza.22
Mortality is only the most severe manifestation of influenza impact, and similar techniques can be used to estimate excess morbidity due to influenza epidemics.23 Data from the Tecumseh Community Health Study have been used to estimate that influenza is responsible for 13.8 to 16.0 million excess respiratory illnesses per year in the United States among individuals younger than 20 years of age and for 4.1 to 4.5 million excess illnesses in older individuals.23 Much of the impact of influenza is related to the malaise and consequent disability that it produces, even in young, healthy individuals. It has been estimated that a typical case of influenza, on average, is associated with 5 to 6 days of restricted activity, 3 to 4 days of bed disability, and about 3 days lost from work or school.24 Direct medical costs of illness account for only about 20% of the total expenses of a case of influenza, with a major proportion (30% to 50%) of the economic impact due to loss of productivity.25 In one study, influenza in schoolchildren resulted in 37 missed school days by children and 20 days of missed work by parents, per 100 children.26 Influenza is also associated with decreased job performance in working adults27 and reduced levels of independent functioning in older adults.28
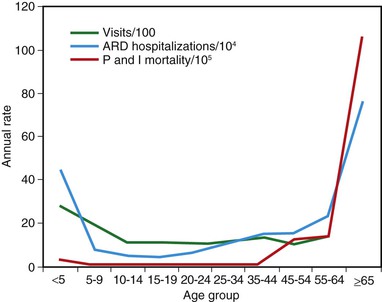
Influenza is usually associated with a U-shaped epidemic curve. Attack rates are generally highest in the young, whereas mortality is generally highest among older adults (Fig. 167-3).29 Excess morbidity and mortality are particularly high in those with certain high-risk medical conditions, including adults and children with cardiovascular and pulmonary conditions such as asthma, or those requiring regular medical care because of chronic metabolic disease, renal dysfunction, hemoglobinopathies, or immunodeficiency and in individuals with neurologic conditions that compromise handling respiratory secretions.30 A summary of these conditions is shown in Table 167-4. Influenza-related death rates in nursing home residents with comorbid conditions are as high as 2.8% per year.31 Influenza is of variable severity in individuals with human immunodeficiency virus (HIV) infection but can cause severe disease and increased rates of mortality.32,33
TABLE 167-4
Groups at Higher Risk for Influenza Complications
| Children and Adolescents at Higher Risk for Influenza Complications |
| Adults at Higher Risk for Influenza-Related Complications |

The increased risk for influenza during pregnancy was dramatically demonstrated during the 2009 pandemic.34 Previous studies had identified an increased risk for hospitalization associated with influenza epidemics during pregnancy, especially in the second and third trimester and in the immediate postpartum period.35 During the 2009 H1N1 pandemic, women in each stage of pregnancy, or in the immediate postpartum period, were significantly overrepresented among those admitted to hospitals and intensive care units.34,36 The mechanisms by which pregnancy enhances the risk for influenza are not clear but might include the increased cardiovascular demands of pregnancy as well as hormonally mediated changes to the innate and adaptive immune responses.37
Obesity also emerged as a risk factor for influenza morbidity and mortality during the 2009 pandemic that had not been recognized in previous seasonal epidemics or pandemics.38,39 Although compromise to respiratory mechanics as a direct result of extreme obesity undoubtedly plays a role, there is also evidence to support a detrimental role of adipose tissue in the inflammatory response that might also enhance the influenza disease process.
Influenza is recognized as an important health problem in young children. Rates of influenza-related hospitalizations are particularly high in healthy children younger than 2 years of age, where rates approach those of older children with high-risk conditions.40–42 In addition, a high rate of secondary complications, particularly otitis media and pneumonia, occur in children with influenza infection.43 Rates of outpatient clinic visits for laboratory-documented influenza have been observed at 50 to 95 per thousand person-years, and emergency department visit rates are 6 to 27 per thousand person-years in children younger than age 5 years.44 Although rare, influenza-related deaths occur each year in previously healthy children.30 Notably, many of these deaths occur in children who were not recognized to have high-risk conditions prior to their illness.
Epidemic Influenza
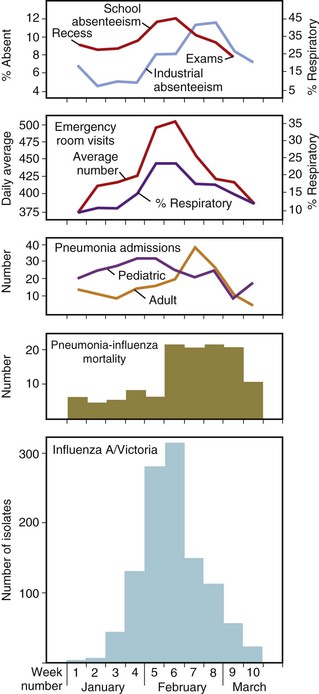
An epidemic is an outbreak of influenza confined to one location, such as a city, town, or country. In a given community, epidemics of influenza A virus infection have a characteristic pattern. A graphic description of a typical and well-characterized epidemic due to influenza A/H3N2 in 1976 is shown in Figure 167-4. The epidemic began abruptly, reached a sharp peak in 2 to 3 weeks, and lasted 5 to 6 weeks.45 The first indicators of influenza activity were reports of increased numbers of children with febrile respiratory illness, followed by the occurrence of influenza-like illnesses among adults. These reports were subsequently followed by increased hospital admissions for patients with pneumonia; exacerbation of chronic obstructive pulmonary disease, croup, and congestive heart failure; and, finally, increased school and industrial absenteeism. Although an increased number of deaths due to pneumonia is a highly specific indicator of influenza, it lags behind the other indications because of the time from the onset of illness to time of death and the delay involved in reporting deaths to public health officials. An increase in Internet searches for topics related to influenza has also been observed to be an early indicator of influenza activity in a community.46
During epidemics, attack rates in unvaccinated populations are estimated to be 10% to 20%, but rates as high as 40% to 50% have been reported.47 The factors that lead to termination of an outbreak in any given location are unclear, but often the outbreak ends before the theoretical supply of susceptible individuals is exhausted.
In temperate climates in either hemisphere, epidemics occur almost exclusively in the winter (generally November to April in the Northern Hemisphere and May to September in the Southern Hemisphere). Seasonal periodicity is also observed in tropical climates, with increased activity during periods of low absolute humidity, although influenza can occur throughout the year and seasonal fluctuations are not as marked.48 The reasons for these seasonal changes are not entirely clear but might be the result of more favorable environmental conditions for virus survival.49 Studies in a model of transmission of influenza in guinea pigs have also supported a role for conditions of cold temperature and dry humidity in facilitating transmission.50 Seasonality may also be associated with behavioral changes that may increase transmission, such as indoor crowding or school attendance.
Generally, a single strain of influenza virus will be the predominant cause of cases during an epidemic. However, this is not always the case, and, in some seasons, two different lineages or strains within a single subtype or two different influenza A subtypes (H1N1 and H3N2) or concomitant outbreaks of influenza A and B have occurred. In some years, the end of the influenza epidemic season is characterized by cases due to a new strain. These limited outbreaks, which have been referred to as a “herald wave,” sometimes predict the predominant strain in the next influenza season.51
Transmission
Influenza viruses are transmitted from person to person via the respiratory route. Three potential modes of transmission have been suggested.52 Coughing and sneezing could generate small-particle aerosols (<10 µm mass diameter) that can remain suspended in air for many hours and could transmit infection to individuals at a substantial difference. Larger particles or droplets will typically fall to the ground within 3 meters of the infected person and would be expected to infect individuals in direct contact. Finally, viral particles could land on surfaces, where influenza viruses remain infectious53,54 and could infect others through indirect contact. There is substantial evidence for all three modes of transmission in experimental studies and epidemiologic observations, but the relative roles of each mode of transmission are uncertain and remain controversial, with obvious implications for infection control practices and for potential interventions to mitigate pandemics.
Small-particle aerosols are generated by infected humans, and influenza genome can be detected in these small particles by polymerase chain reaction (PCR) techniques.55,56 It has not been proven that these aerosols contain significant amounts of infectious virus, but experimental studies in humans have shown that very small amounts (~five infectious particles) may be sufficient to infect humans by the aerosol route.57,58 Aerosol transmission has also been demonstrated in animal models in which infected and exposed ferrets or guinea pigs are separated by several meters, with transmission occurring in the direction of airflow.50,59
Airborne transmission has also been implicated in multiple observations of outbreaks where an airborne route of transmission appears to be the most plausible explanation for the characteristics of the outbreak. The most often cited such outbreak occurred in a commercial airliner that was delayed for approximately  hours with a poorly functioning ventilation system. The risk for transmission of influenza A from the infected person in the index case to other passengers was related to the amount of time passengers spent on the aircraft and not on their seating proximity to the infected person. Because most of the passengers did not have direct contact with the infected person, airborne transmission appears to be likely.60 In a well-investigated hospital outbreak, nosocomial cases occurred significantly less frequently in a hospital ward where the air was treated with ultraviolet light than in an otherwise similar ward without ultraviolet light treatment.61 In an outbreak in a long-term care facility, there appeared to be an association between the risk for nosocomial influenza and the air-handling systems in several wards.62
Additional observations consistent with airborne transmission were made during an early study of zanamivir prophylaxis of influenza in families. In this study,63 subjects who received short-term prophylaxis with inhaled zanamivir were protected compared with placebo recipients, but recipients of zanamivir administered by nasal spray were not. In addition, results of treatment with the combination of nasal and inhaled zanamivir were no better than those of inhaled zanamivir alone.
In most of these outbreaks there were alternative explanations for the observations that could at least partially explain the epidemic behavior without requiring aerosol transmission,64 thus the real role of aerosol transmission remains controversial. If aerosol transmission plays a dominant role in influenza, then health care workers would need to wear filtering facemasks and patients would require negative-pressure isolation to prevent nosocomial transmission of influenza. This has prompted several studies to evaluate the role of facemasks in infection prevention in hospitals. In one large, randomized trial, nursing staff who were randomly assigned to wear N-95 respirators had the same rate of influenza as staff assigned to wear simple surgical masks while caring for patients with influenza.65 This study suggests that airborne transmission does not play a major role at least in nosocomial influenza, although it has been pointed out that cases in the N-95 group could have been acquired outside the hospital and that compliance with these masks is frequently poor. In contrast, hand hygiene and simple surgical masks were reported to be modestly effective in the prevention of influenza transmission in households,66 suggesting that droplet spread was the predominant modality in this setting.
Pandemic Influenza
Pandemics are typically associated with the emergence of an antigenically variant influenza virus toward which the population has little or no prior immunity. The World Health Organization (WHO) has defined four levels of influenza pandemic activity (interpandemic, alert, pandemic, and transition) and currently defines pandemic influenza as the period of global spread of human influenza caused by a new influenza subtype.67
The epidemiologic behavior of pandemics differs in many ways from that of epidemic, seasonal influenza. In addition to higher attack rates overall with substantially greater disease impact, pandemics are typically associated with a different age distribution of cases, with greater impact in younger persons and relative sparing of the elderly. The reasons for this are unclear, although in some pandemics older segments of the population may have been exposed to antigenically related viruses in childhood, sometimes referred to as “antigenic recycling.” Pandemics also often occur outside the usual window of seasonality, possibly because their inherently greater transmissibility allows them to spread even under conditions that would not be favorable for transmission of seasonal influenza viruses. Many pandemics are characterized by multiple waves of activity during the pandemic period, such as the H1N1 pandemic, in which there was an initial wave of cases in the spring followed by a more severe wave of cases in the early fall in much of the United States. The intervals between pandemics are quite variable and unpredictable, but it is likely that pandemics of influenza will continue to occur in the future.
Stay updated, free articles. Join our Telegram channel

Full access? Get Clinical Tree


