Manjunath P. Pai, Mackenzie L. Cottrell, Angela D.M. Kashuba, Joseph S. Bertino Jr. Keywords antibiotic; anti-infective; antimicrobial; antiretroviral; antiviral; clearance; concentration-dependent killing; continuous infusion; cytochrome P-450; drug-drug interactions; extended infusion; front loading; high-dose extended-interval dosing; hollow fiber model; inhibitory quotient; pharmacodynamics; pharmacogenetics; pharmacokinetics; phase I metabolism; phase II metabolism; population pharmacokinetics; systems analysis; therapeutic drug monitoring; time-dependent killing; volume of distribution
Pharmacokinetics and Pharmacodynamics of Anti-infective Agents
Selection of the optimal individualized drug dose regimen for a given patient is the ultimate goal of pharmacokinetic and pharmacodynamic systems analyses within the broader domain of pharmacology.1 Pharmacology is the knowledge base of a compound concerning its history, source, physical and chemical properties, compounding, biochemical and physiologic effects, mechanisms of action and resistance, absorption, distribution, metabolism, excretion, and therapeutic and other uses.1 Although pharmacology is very important in determining how a drug is used and the resultant patient response, there are many nonpharmacologic factors that also determine efficacy (Fig. 19-1). A discussion of the conglomerate of factors affecting patient response is beyond the scope of this chapter so here the focus is on the pharmacologic aspects that help to determine success or failure of anti-infective therapy. This includes pharmacokinetics and pharmacodynamics as tools that are used to optimize antimicrobial dose selection.1,2
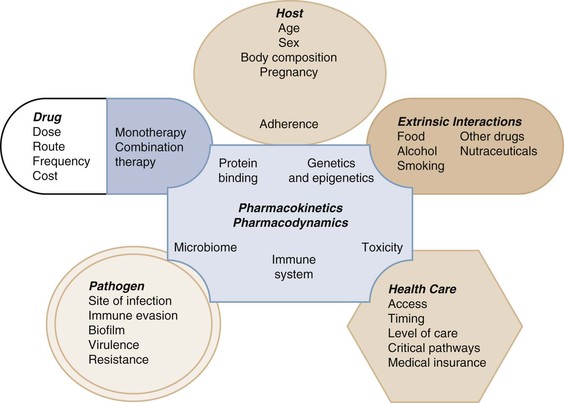
Pharmacokinetics (PK) describes the action of the body on the administered drug that includes absorption, distribution, metabolism, and excretion to define systemic exposure.2 Pharmacodynamics (PD) describes the biochemical and physiologic response of the drug and its mechanism of action (see Fig. 19-1).2 PK-PD analysis is integrated to define the exposure-response relationship to identify optimal dose regimens.1,2 Anti-infective PK-PD is unique in pharmacology in that this relationship includes the effects of the drug on the infective pathogen as well as the host.3,4 This chapter will not be a primer but a description of these elements with a focus on prediction of drug response in general. The numerous terms and corresponding abbreviations used to describe specific PK-PD parameters in this chapter are summarized in Table 19-1.
TABLE 19-1
Quick Reference Pharmacologic Abbreviations and Their Definitions
| TYPE OF TERM | ABBREVIATION | DEFINITION |
| Pharmacokinetics | ||
| Absorption | F | Bioavailability; absolute bioavailability |
| Ka | Absorption rate constant | |
| Distribution | Vd | Volume of distribution |
| Vd/F | Apparent volume of distribution | |
| Vss | Volume of distribution at steady state | |
| Vss/F | Apparent volume of distribution at steady state | |
| CLD | Distributional clearance | |
| CLD/F | Apparent distributional clearance | |
| Metabolism | Km | The drug concentration at which the rate that an enzyme system can metabolize a drug is half of Vm (Michaelis-Menten type metabolism [saturable metabolism]) |
| Vm | Maximal metabolic capacity (Michaelis-Menten type metabolism [saturable metabolism]) | |
| CYP | Cytochrome P-450 enzyme systems | |
| Elimination | CLr | Renal clearance |
| CLnr | Nonrenal clearance | |
| CLnr/F | Nonrenal oral clearance | |
| CLT | Total clearance | |
| CLT/F | Total oral clearance | |
| t1/2 | Half-life | |
| Pharmacodynamics | ||
| MIC90 | Minimal inhibitory concentration for 90% of isolates | |
| EC50 | Effective concentration for 50% of all isolates | |
| MPC | Mutant prevention concentration | |
| MSW | Mutant selection window | |
| IC50 | Inhibitory concentration for 50% of isolates | |
| Cmax/MIC | Peak antimicrobial serum concentration to MIC ratio (concentration-dependent killers) | |
| AUC/MIC | 24-hour area under the serum antimicrobial concentration-time curve to MIC ratio | |
| AUIC | 24-hour area under the inhibitory curve | |
| t1/2 | Half-life | |
| T > MIC | Time that serum antimicrobial concentrations are above the organism’s MIC (time-dependent killers) | |
| SBT | Serum bactericidal titer (concentration) | |
| IQ | Inhibitory quotient ratio of trough serum concentration to IC50 | |
| PAE | Postantibiotic effect | |
Pharmacokinetics
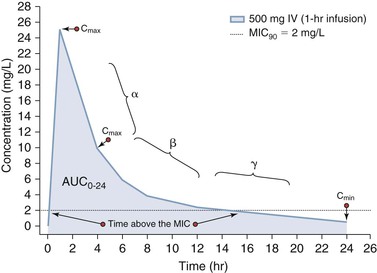
Pharmacokinetics is used to define the rates of entry and departure of a drug from an organism that are based on the concentration-time profile.1 Systemic antimicrobial concentrations are usually quantified using serum or plasma as a surrogate of tissue concentrations. In some instances, fluids such as epithelial lining fluid may be obtained in humans, but, in general, our understanding of tissue and body compartment drug penetration is limited in humans.5,6 If a drug is administered intravenously, then the rate of systemic entry is defined by the rate of drug infusion (R0). Likewise, if a drug is administered orally or by some other extravascular route, the rate of entry into systemic circulation is defined by the absorption rate constant (ka). In this second scenario, the extent of absorption may not be complete and so the ratio of the systemic exposure profile by oral (or extravascular) absorption to that of intravenous administration defines the bioavailability (F). The rate of drug transfer between systemic circulation to tissues and organs is dependent on numerous factors, including (1) molecular size and charge; (2) protein binding; (3) influx and efflux transporters; and (4) cardiac output. Most drugs undergo biotransformation through various metabolic processes to support elimination primarily via the kidneys and liver into the feces. As stated, the stepwise process of drug entry and departure is regulated by complex physiologic processes that are simplified and visually represented by the “concentration-time curve.” The shape of this concentration-time curve can be modified by altering the rates of drug entry, distribution, metabolic transformation, and elimination through intrinsic or extrinsic factors.7 As shown in Figure 19-2, administration of a 500-mg dose of an anti-infective agent by oral and intravenous routes can lead to distinctively different profiles. In the case of intravenous administration, the rate of infusion clearly can increase or decrease the time that a concentration is above a threshold value, such as the minimal inhibitory concentration for 90% of isolates (MIC90). More detailed explanations of these PK processes are provided as follows.
Absorption
Absorption describes the movement of drug from an extravascular space to the intravascular space.1 For anti-infective agents, the two most common modes of drug administration that require absorption are the oral and intramuscular routes of administration. The amount of drug that reaches the systemic circulation is expressed as a percentage of the total amount that could have been absorbed. This percentage is defined as the drug’s absolute or relative bioavailability. Absolute bioavailability means that the amount of drug absorbed by the extravascular route of administration has been compared with the intravenous route, whereas relative bioavailability means that two different extravascularly administered dosage forms have been compared.1
Oral absorption can be saturable or nonsaturable with factors such as degradation in the gut by acid or proteolysis gut metabolism and first-pass liver drug metabolism by enzymes, influx and efflux transporters, or concentration-dependent solubility determining the rate and extent of absorption. Other factors that can affect absorption and bioavailability are drug interactions with other compounds or food that may bind the drug and prevent it from being absorbed.8 Because for some anti-infective agents, response is linked to the peak concentration (Cmax) or the total exposure (area under the concentration-time curve [AUC]), factors that affect absorption can affect drug response.2 As shown in Figure 19-2, a more rapid rate of intravenous administration will lead to higher Cmax values. Alternatively, the response of microbes to some anti-infective agents is linked to maintenance of concentrations above a threshold concentration such as the MIC.3,4 In this setting, extending the rate of infusion (see Fig. 19-2) or use of a controlled-release oral formulation can be used to target steady concentrations above a threshold.
Distribution
The shape of the concentration-time curve is modeled most commonly using a proportionality constant known as the volume of distribution (Vd) and is termed the apparent volume of distribution (Vd/F) when the drug is administered extravascularly.9 The Vd is not a real or physiologic volume but rather a value that relates drug concentration in the system to the amount of drug present in that system. This system can be defined as a single compartment (Vd1) or as multiple compartments (Vd1, Vd2, … Vdn) in order to mathematically fit the shape of the concentration-time curve. Factors that alter the physiologic distribution of drug into tissue include lipid solubility, partition coefficient of the drug between different types of tissues, blood flow to tissues, pH, and binding to biologic material (e.g., plasma proteins, cellular components).1 However, actual measurement of concentrations in these tissue or interstitial fluids is necessary to confirm site-specific distribution and cannot be easily estimated by Vd.9
Drug transporters also play a role in either getting drugs to the site of infection (influx transporters) or preventing them from reaching the site of infection (efflux transporters).10 Transporter function can be influenced by genetic and environmental factors and thus vary from person to person. Many drugs bind to serum proteins, especially albumin or α1-acid glycoprotein. Similar to other classes of drugs, antimicrobial agents range from highly to poorly protein bound. Theoretically, protein binding is an important consideration for antimicrobial agents because only unbound drug is available to exert antimicrobial activity.11 Changes in the unbound fraction of drug may be caused by displacement from other drugs, changes in serum protein concentrations, or accumulation of endogenous substances, such as free fatty acids.2 Changes in the unbound fraction typically do not lead, however, to significant changes in free drug concentration due to various equilibrium processes. Although changes in protein binding may alter PK behavior of an antimicrobial agent, it is unlikely that substantial changes in PD would occur.12
Metabolism and Biotransformation
Drugs and other compounds are metabolized by a variety of processes. Although traditionally drug metabolism was believed to occur in the liver, other organs also have the ability to metabolize drugs.1 All drug-metabolizing enzymes (DMEs) are saturable, but there are few examples for anti-infective agents in which saturation of DMEs occurs; thus, increased exposures result in constant rates of metabolism. Drug metabolism is determined by genetics and environmental (external) factors.13 Like transporters, some DMEs show genetic polymorphism, meaning that at least 1% of the population exhibits different DME activity (either increased, decreased, or no activity) than the rest of the population. In some instances, even for enzymes for which genetic polymorphism has not been shown, a large range in the rate and extent of drug metabolism can be found.14 Environmental factors are many but include concurrent drugs, underlying diseases (both infectious and noninfectious), nutrients, herbal preparations and supplements, nutritional status, pregnancy, and sex (although for anti-infective agents sex differences have not been reported in general).
Drug metabolism reactions are classified as either phase I or phase II reactions.2,8 Phase I reactions can inactivate, activate, or convert an active substrate into another active substrate with activity that is higher, lower, or equal to that of the parent compound. Phase I reactions generally are under the control of the cytochrome P-450 (CYP) system. CYP enzymes are heme-containing proteins that are localized in the endoplasmic reticulum of a variety of cell types, most abundantly in the liver. CYP enzymes are controlled by a superfamily of genes that are classified into families according to their amino acid sequences. Each family is divided further into subfamilies. The term CYP3A4 designates a mammalian enzyme (CYP) family 3, subfamily A, gene 4. To date, most drugs that are metabolized by phase I enzymes have been shown to be metabolized by five primary CYP enzymes. In decreasing order of importance for drug metabolism, they are CYP3A, CYP2D6, CYP2C, CYP1A2, and CYP2E1. Although a complete discussion of the CYP system is beyond the scope of this chapter, many of the newer anti-infective agents, particularly antiretroviral agents, can induce, activate, or inhibit CYP enzymes and in many cases they are substrates for CYP enzymes and are affected by changes in CYP activity.
CYP enzymes are affected by many factors that stimulate or inhibit their ability to metabolize drugs. Genetic factors have been shown to result in a phenomenon called polymorphism. Simply put, polymorphism means that individuals vary in their genetically determined ability to metabolize CYP substrate. For some CYP enzymes, such as CYP2D6, distinct “poor,” “intermediate,” “extensive,” and “ultrarapid” metabolic patterns exist in a population; in a white population, 4% to 6% are poor metabolizers and the rest fall into the other metabolic groups, with the majority being extensive metabolizers. CYPs such as CYP2C9, CYP2C19, CYP2A6, and CYP2B6 also show genetic polymorphism. These CYPs are important in drug metabolism. For other CYPs, such as CYP3A, genetic polymorphism has been described; however, the significance of this continues to be confusing. These phenomena have important implications for anti-infective agents, for which efficacy against infecting organisms and toxicity to the host are determined by the PK of the agent and its resultant PD effect.
Clinically, drug, food, disease, and herbal effects on the CYP system may translate into inhibition, activation, or induction of metabolism. Inhibition of CYP activity occurs through reduction of enzyme production, inactivation, or competition for CYP substrate. Generally, persons with increased enzyme activity exhibit a greater inhibition of the CYP system with an inhibiting agent than do persons with less activity. Enzyme inhibition may result in increased PD effect, with the potential not only for greater efficacy but also for greater toxicity. This inhibitory process may be used in the clinical setting advantageously. Ritonavir can be used to decrease the activity of CYP3A isozymes in the gut, allowing greater absorption of other protease inhibitors such as tipranavir and darunavir and reducing the overall cost of therapy. Clinically, a combination of ritonavir and lopinavir has been marketed to take advantage of this beneficial drug interaction. Induction of CYP results in increased production of the drug-metabolizing enzyme and a resultant increase in the ability to metabolize specific compounds. An example is the induction by rifampin of CYP3A with a subsequent increase in the metabolism of protease inhibitors. Many inducers of CYP enzymes also induce phase II conjugation reactions and transporters. Activation increases drug-metabolizing enzyme activity, but to a much lesser extent (approximately 65% less) than enzyme induction.
Phase II reactions, which also show genetic polymorphism, involve conjugation of the parent compound with larger molecules, which increases the polarity of the parent molecule and permits excretion. Although phase II reactions generally lead to inactivation of the parent compound, occasionally conjugation increases the potency of the parent compound or results in the formation of another biologically active compound. When the conjugated compounds are secreted into the intestine, enzymatic cleavage may occur with release and reabsorption of the active parent compound, a phenomenon called enterohepatic recirculation.1 As mentioned, the liver is not the only place in the body where metabolism occurs. Metabolism and detoxification of foreign substances can occur in most other organ systems.
Elimination
The AUC over a specific time period is proportional to the dose administered (for drugs that follow linear PK) and inversely related to total drug clearance (CLt).7 The term CLt reflects the unit volume of a system that is cleared of drug per unit time (e.g., L/hr). The physiologic drug clearance process is driven by elimination of the biotransformed or unchanged drug. This elimination of drugs is further categorized as renal and nonrenal clearance. Renal clearance (CLr) describes the volume per unit time that the body eliminates a substance via the kidneys, through various methods, including glomerular filtration, tubular secretion (an energy-dependent process), and tubular reabsorption. Tubular secretion is a transporter-mediated process, and dose-dependent PK can be shown for substances that undergo tubular secretion as their primary route of elimination (e.g., piperacillin-tazobactam). Nonrenal clearance (CLnr or CLnr/F) is the term that describes the sum of clearance pathways that do not involve the kidneys.2 These mechanisms may involve the biliary tree (e.g., ceftriaxone) or the intestine (e.g., azithromycin). Furthermore, the composition and enzymatic activity of the intestinal microbiota affect whether deconjugation occurs, which affects rates of excretion versus reabsorption. Other, uncommon mechanisms can be used, such as elimination of alcohol through the skin and lungs (respiration) and ionization, DNA chelation, and inactivation of aminoglycosides by the sputum in cystic fibrosis patients with elimination through expectoration.15 Elimination through a dialysis procedure (hemodialysis or peritoneal dialysis) also can be construed as a form of nonrenal elimination.16 As expected, significant interindividual variability exists in the PK of drugs. The sources of interindividual variability are identified and quantified using a systems analysis approach referred to as population pharmacokinetic analysis.
Pharmacodynamics
Anti-infective pharmacodynamics is a science that is used to integrate PK information and in vitro measures of drug potency with effect.4 This effect can be measured in vitro and in vivo (animal models) as the rate and extent of microbial death/growth inhibition or emergence of resistance.17 Alternatively, this effect can be defined clinically by a measure of biologic response, such as survival, time to clinical response, probability of clinical response, and so on.7 As expected, PK-PD systems analysis currently represents a stepwise hierarchical process that integrates in vitro and in vivo data followed by clinical validation.18
Antimicrobial Potency
An anti-infective agent may inhibit growth and replication (-static) or cause bacterial cell death (-cidal). A factor that affects whether a drug is bacteriostatic or bactericidal is the concentration at the site of action.19 Antimicrobial agents may be bacteriostatic at low concentrations but bactericidal at high concentrations. These bacteriostatic and bactericidal concentrations have been used to quantitate the activity of an agent against an organism. Approaches to measure this activity have broadly included use of agar based-dilution and broth macrodilution and microdilution systems.20 Agar-based dilution systems lead to measurement of activity as a zone of inhibition. Broth dilution systems lead to measurement of an MIC that is based on a doubling-dilution (log2) scale (e.g., 0.5, 1, 2, 4 mg/L).20 The MIC for 90% of all surveyed isolates of a bacterial species (MIC90) and the inhibitory or effective concentration for 50% of all surveyed isolates of a strain of virus (IC50 or EC50) are conventionally used to describe drug activity against pathogens. The minimal bactericidal concentration (MBC) provides information on the lowest concentration at or above the MIC required to kill a microorganism. Although these in vitro parameters are helpful epidemiologically, they represent fixed values that do not reflect the dynamic in vivo process, such as (1) the time course of activity or the potential for persistent anti-infective effect after the concentration at the site has decreased below the MIC or MBC; (2) the interaction of the immune system with the drug; and (3) exposures necessary to prevent the development of resistance or organism mutation. Importantly, these parameters reflect specific drug-organism in vitro measurements that cannot reflect the combination drug use profile as empirical therapy and for documented polymicrobial infections.20
Although anti-infective agents can be used individually, in many instances they are used together. Synergism is defined as activity of two or more anti-infective agents given together that is greater than the sum of activity had the agents been given separately. Additivity (also known as indifference) is defined as activity of two or more agents together that equals the sum of activity of each agent. Antagonism is defined as activity of two or more anti-infective agents given together that is lower than the activity of the most active agent given separately. Combinations of agents are used to enhance efficacy and rate and extent of organism killing or to reduce the development of resistance but can have conflicting results.21
Pharmacodynamic Indices
PD combines PK parameters and microbiology parameters to describe drug effect in relationship to some measure of exposure. These PK measures of exposure include the maximal concentration (Cmax, “peak”), minimal concentration (Cmin, “trough”) or AUC integrated over a specified time period (AUC0-t) or infinity (AUC0-inf). Alternatively, the duration of time that the concentration exceeds a threshold value can be correlated to an efficacy- or safety-related event. In the case of anti-infective agents, three PK-PD indices based on serum or plasma concentrations have been associated with efficacy and include the Cmax/MIC, AUC/MIC, or T > MIC.19 As shown in Figure 19-3, measurement and classification of the relevant Cmax is not straightforward. The highest concentration in serum will be measured at the end of infusion; however, the concentration observed at the transition point between the distribution (α) and elimination (β) phases may represent the maximum expected tissue concentration for some drugs. Hence, Cmax is a simple PK term to state as a single point estimate but is difficult to actually measure and translate between serum and tissue compartments.22 In contrast, the integration of serum concentration over time is easier to translate between serum and other tissue compartments.7 Thus, the effect of many antimicrobial agents is often correlated to the AUC/MIC index because AUC (mg • hr/L) represents both concentration (mg/L) and time-dependent (h) components.23 Antimicrobial agents deemed to be concentration dependent with a good correlation to Cmax/MIC will also have some degree of correlation to AUC/MIC.23 The same phenomenon is true for antimicrobial agents deemed to manifest time-dependent PK-PD.23 For antimicrobial agents that are deemed to be time dependent (good correlation to T > MIC), a good correlation with AUC/MIC will also be observed if this agent has persistent sub-MIC effects.17 Unfortunately, for anti-infective agents, such as antiviral and antiretroviral agents that are activated intracellularly, serum and plasma PK are not reflective of the site of cellular and subcellular activity. These agents are also retained intracellularly for longer periods of time than that reflected by the intravascular concentration-time profile.
Methodology for Study of Pharmacodynamic Effects of Anti-infective Agents
In Vitro Models
The most accepted model used to study in vitro PK-PD effects of anti-infective agents is the “hollow fiber model” system.24 The system utilizes a cartridge that is composed of thousands of hollow porous fibers that are sealed at each end so that growth media that enter one end go through the inside of the fibers to the opposite end. Microorganisms are inoculated on the outside of the fibers and multiply in the space between the fibers known as the extracapillary space. In this system, anti-infective agents, nutrients, and metabolic waste can cross the fibers but the larger microorganisms cannot cross through the pores. As a result, the microorganisms can be exposed to predetermined dynamic or static concentrations of anti-infective agents under conditions that can simulate the expected PK in humans.25 The extracapillary compartment can be sampled via a port to quantify the microorganism load and drug concentrations. Although these models offer control over bacterial inoculum and drug concentration-time profiles that mimic clinical cases, they do not currently assess the effects of the immune system on organism killing or growth inhibition. They do assess the relationship of free drug concentrations to effect, assisting in the development of relationships of protein-bound drug in humans.
Animal Models
Animal models have used a variety of species, often with the animals rendered neutropenic before infection. Craig and colleagues26–28 showed that the presence of neutrophils may affect antibacterial activity with fluoroquinolones, penicillin, clindamycin, and doxycycline. Animal infectious disease models have been developed to mimic human infections. Animal models allow for frequent sampling of blood and tissue and allow a broad dosage range to be investigated along with a wide range of organism inocula, allowing investigators to study the effects of variation in a single parameter at a time. Problems with animal models include a lack of standardization of inocula size (often large inocula are required to produce infection). The faster rate of drug elimination in small mammals compared with humans often leads to the use of dosing regimens that may match human AUC values but may not replicate human concentration-time profiles. The use of immunocompetent animals has been applied to attempt to develop more realistic guidelines for PK-PD targets in infected patients, many of whom are not neutropenic.
Clinical Trials
Preclinical and early clinical (phase I and II) PK-PD relationships are often being applied to justify dose selection for the two phase III clinical trials that are necessary to gain regulatory approval to market a drug.18 This dose selection often includes testing of a single fixed dosage (e.g., 500 mg IV once daily) or weight-based (e.g., 6 mg/kg IV once daily) dosage regimen. After completion of the initial phase III trial, PK-PD analyses may validate or contradict the pre–phase III study assumptions. Unfortunately, the high expense of phase III trials limits significant modification of the study design to rectify and retest assumptions about dose selection.18 Hence, most human trials29–38,39,40 that have defined PK-PD relationships have been based on the retrospective review of post-marketed drugs or post-hoc subgroup analyses of prospectively collected data.41–43 Little if any prospective data have been generated with either dosage adjustment during therapy or comparison of different dosing regimens to attain different exposures during treatment (concentration-response trials).44 These trials have used three measures of assessment to relate to antimicrobial PK-PD: (1) clinical outcome (cure/fail or improved); (2) eradication of bacteria from the site of infection or reduction in virus concentration (viral load) in blood or other sites, or both; and (3) improvement in surrogate markers of infection, such as temperature or leukocyte count. Many trials have not reported free drug PD indices. Because free drug is active drug, correction for protein binding is important unless the binding is very low. Few human trials have focused on relationships of drug exposure to toxicity or on the development of resistance. It is important to appreciate that the validation of a PK-PD relationship to effect through these analyses implies that an opportunity exists to individualize the dosage regimen and to not rely on a “one size fits all” dosage regimen.7 Unfortunately, the lack of availability of an assay and technical knowhow on measurement and interpretation of systemic concentrations delays the ability of clinicians to apply these principles in practice. Despite these limitations, well-designed “proof of concept” studies are emerging in the literature in support of these principles.45
Concentration-Dependent Killing Agents
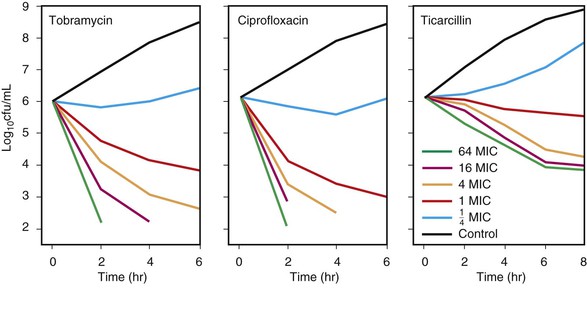
Concentration-dependent killing agents (e.g., fluoroquinolones, aminoglycosides, macrolides, azalides, ketolides, metronidazole, daptomycin, and oritavancin) exert their positive effect on bacteria when their concentrations are well above the MIC of the organism.17 When the ratio of the concentration at the site of infection to the MIC is increased further, greater killing occurs. This concept is illustrated in Figure 19-4 for tobramycin and ciprofloxacin against Pseudomonas aeruginosa.46 In addition, some of these agents exhibit postantibiotic effect (PAE) (discussed later). Growth inhibition continues for a varying period after the concentration at the site of the bacteria has decreased below the MIC for the antimicrobial agent. In vivo, the Cmax/MIC ratio has been shown to be the clinical correlate used as the PD predictor for outcome of concentration-dependent killing agents. In clinical trials, the AUC/MIC ratio also has been correlated with improved outcome.33–43 This finding is not surprising because Cmax and AUC increase in proportion to the administered dose and are by consequence correlated.17 For drugs such as fluoroquinolones, different goals for AUC/MIC ratios are required for gram-positive pathogens compared with gram-negative pathogens.47–49
Time-Dependent Killing Agents
Time-dependent killing agents kill gram-negative bacteria when the drug concentration at the site of the bacterial infection is higher than the MIC of the organism; this is shown for ticarcillin against P. aeruginosa in Figure 19-4. Generally, when the concentration at the bacterial site is more than four times higher than the MIC, the additional killing that occurs is modest.
The amount of time that the concentration needs to be above the MIC has been the subject of some debate.19 A report using animal studies with Streptococcus pneumoniae in which treatment was performed with penicillins or cephalosporins showed that when T > MIC was 20% or less of the dosing interval, mortality was 100%. In contrast, a mortality rate of 0% to 10% occurred when serum concentrations were above the MIC for longer than 40% to 50% of the dosing interval.19,50 Time-dependent killing agents include the penicillins, cephalosporins, aztreonam, vancomycin (for which AUC/MIC is predictive), carbapenems, macrolides, linezolid, tigecycline, doxycycline, and clindamycin.17
In terms of prevention of bacterial resistance, only in vitro data using the hollow fiber model exist relating the Cmax/MIC ratio to resistance. The study of Blaser and colleagues25 examined the Cmax/MIC ratio for enoxacin and netilmicin against various gram-negative organisms. Regrowth of organisms occurred in all cultures when enoxacin or netilmicin attained ratios lower than 8. On redosing of these antibiotics after bacterial regrowth, no killing was seen because of the development of resistance. A similar study by Marchbanks and associates51 using ciprofloxacin noted the development of resistant P. aeruginosa when the organism was exposed to a Cmax/MIC ratio of 6 compared with no resistance when the Cmax/MIC ratio was 12, even though both regimens showed adequate rates of bacterial killing. These in vitro data suggest that Cmax/MIC ratios may be influential in determining the development of bacterial resistance for aminoglycosides and quinolones. A disadvantage of these trials, however, is that they do not account for the role of the immune system in “cleaning up” small numbers of resistant bacteria before they can become pathogenic. Additionally, in vitro studies use only “free” drug and, thus, extrapolation to human infections may be difficult.
Stay updated, free articles. Join our Telegram channel

Full access? Get Clinical Tree


