Key points
- •
Incidence and prevalence of GEP-NET is increasing.
- •
Recently approved systemic targeted therapeutic agents and local therapies have rekindled interest in NET management.
- •
Multidisciplinary centers employing a myriad of tumor therapies including strategies of image-guided techniques are poised to play a significant role in the management of these complex patients.
Introduction
The neuroendocrine system exists in two phenotypes, either as (1) discreet organoid aggregates (pituitary, adrenal, parathyroid) or as (2) disseminated, nonuniform distribution of cells, This latter group has been assigned the term diffuse neuroendocrine system (DNES; e.g., enterochromaffin cells in the gut mucosa, Merkel cells in the dermis). Collectively, the neuroendocrine system forms the largest group of hormone-producing cells in the body.
Neuroendocrine neoplasms/tumors (NET) once considered “rare” have been steadily increasing in incidence and prevalence over the past 3 decades. In fact, over the last 32 years (1973–2005), the incidence has increased 520% translating to an annual increase of 5.8%. , In 2011, it is estimated that approximately 18,000 cases and 8200 deaths will occur from NET in the United States alone (not just GEP-NET). Analysis of the SEER database encompassing the period 2003–2007 reveals that NET incidence and prevalence was 5.76/100,000 and 35/100,000, respectively, in 2004, These increases may represent a reflection of the increasing awareness and diagnostic capabilities over the same time period.
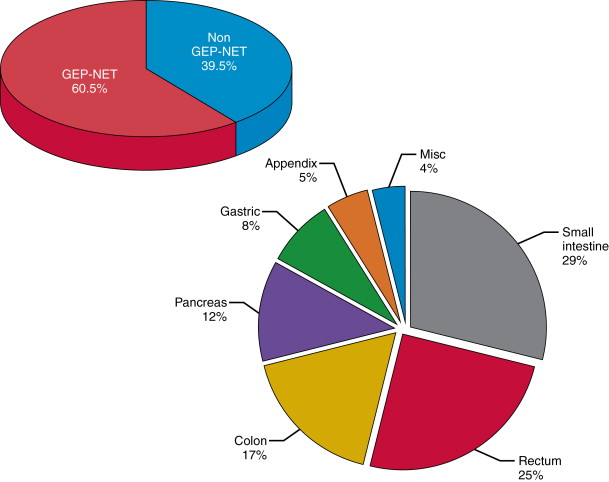
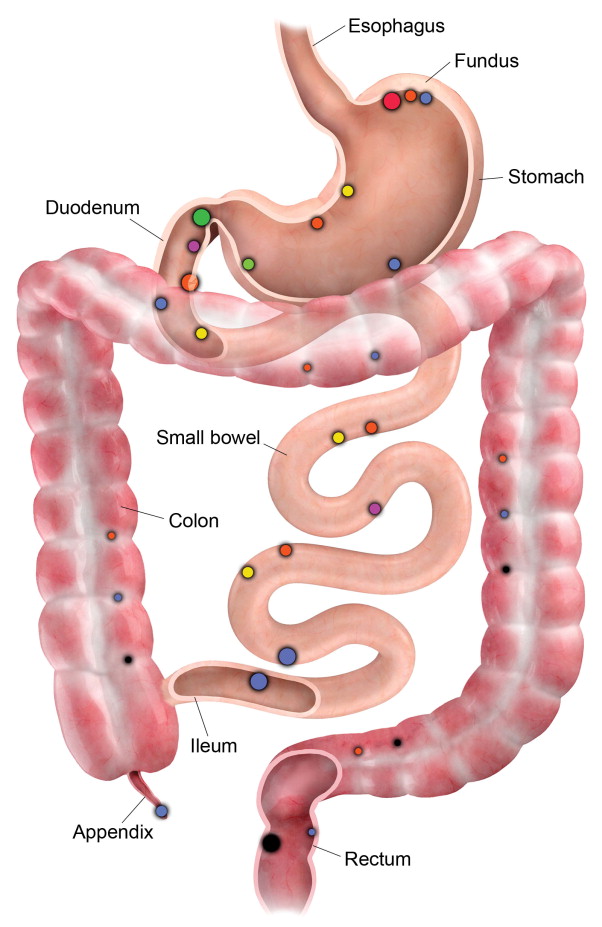
DNES NETs occur most frequently in the lung and gastro-entero-pancreatic (GEP) regions. NETs currently represent 2% of all cancers and GEP-NETs represent the second most prevalent gastrointestinal neoplasm after colorectal cancer. GEP-NETs are most common in the small intestine (30.8%), followed by rectum (26.3%), colon (17.6%), pancreas (12.1%), stomach (8.9%), and appendix (5.7%) ( Figure 15-1 ).
When compared to GE-NETs, pancreatic NETs (P-NETs) possess different patterns of underlying genetic defects that lead to malignant transformation. For GE-NETs, the cell of origin is believed to be the enterochromaffin cell, whereas for P-NETs it appears to be pluripotent cells in the pancreatic duct epithelium. This fundamental difference combined with differing natural histories, management, response to therapy(s), clinical course, and worse prognosis than GE-NETs leads many investigators to consider P-NETs as a distinct tumor entity. P-NETs account for less than 2% of all pancreatic cancers, with 50%–90% of these tumors being nonfunctional, meaning they are not associated with any hormone-related clinical syndrome, the so-called nonsyndromic. The prevalence of these occult NETs is corroborated by the higher incidence of P-NET at autopsy studies ranging from 0.8% to 10%. , The incidence of P-NET from the SEER database was 0.22/100,000.
The clinical manifestations of this relatively uncommon disease are protean and nonspecific, thereby leading to alternative diagnoses and the average lag between first symptoms and diagnosis of NET of about 7 years. It is therefore understandable that 60%–80% have metastases at presentation, with the liver being the most common distant metastatic site. An important consequence of metastases, the “carcinoid syndrome” (diarrhea, abdominal pain, sweating, flushing, bronchospasm, tachycardia, and fibrotic heart disease), develops in 7%–10% with GE-NET and 35%–50% of those with hepatic metastases ( Table 15-1 ). Pancreatic neuroendocrine tumors can also be associated with clinical syndromes associated with hormone release ( Table 15-2 ). There has been a gradual increase of the incidence or reporting of stomach and rectal NETs and a decrease in that of appendicular NETs. , The increasing burden of disease coupled with new therapies have increased the awareness of this disease and rekindled interest in exploring the benefits of intervention in GEP-NETs.
| Tumor | Average Size cm | Typical Phenotype “Sporadic” Type Distribution | Clinical Caveats | |
|---|---|---|---|---|
| α | Glucagonoma | 3–7 | Solitary Large/Tail | Uncommon. 60% Metachronous metastases. 5 yr Survival 50–60%. 8–13% Syndrome of “4D’s” |
| β | Insulinoma | 0.5-2 | Solitary 85% / Uniform | Commonest PNET. 4–7% Associated with MEN-1. 90% Benign, 5 yr Survival 97% Whipple’s Triad Pre-resection localization mandatory. |
| XXgw:math1XXdZZgw:math1ZZ | Somatostatinoma | Large | Solitary Large / Head | Rare; <5%. 70–92% Metachronous metastases. 5 yr Survival 60–75%. Non-specific Syndrome |
| G | Gastrinoma | 2 | Solitary / Head | 2 nd most common PNET. 50% Metachronous metastases. Zollinger-Ellison Syndrome . 90% in “Gastrinoma Triangle” . Enucleation Rx |
| VIP | VIPoma | Large | Solitary Large / Tail | Rare; 3–8%. 5% Associated with MEN-1. Verner-Morrison Syndrome |
| Location | Dominant Location | Syndrome | Clinical Caveats |
|---|---|---|---|
| Stomach | Fundus | No | 80% Type 1-ECL cell origin. F>>M. Associated Chronic atrophic gastritis. Multifocal polyps <1cm. Benign. |
| Fundus | Zollinger Ellison | 6% Type 2 – ECL cell origin. Associated with MEN-1. | |
| Antrum | No | 29% Type 3 – Poorly differentiated. Metachronous Gastric AdenoCA 5-10%. M>F, 5th decade, Metachronous metastases. | |
| Duodenum & Proximal Jejunum | Proximal Duodenum | Zollinger Ellison | G Cell origin. 70% of all Gastrinomas occur in duodenum; 90% occur in 1st & 2nd portion A 50% of Duodenal Gastrinoma are associated with ZES A 20–30% of these are associated with MEN-1. |
| Ampullary Periampullary | Somatostatinoma | D cell origin. 14–43% associated with NF1 | |
| Periampullary | No | Triphasic lineage. Gangliocytic Paraganglioma. Rare | |
| Distal Jejunum & Ileum | Ileocecal valve region | Seritonoma | EC cell origin. Multicentric NET 30%. Metachronous Colorectal Cancer 39%. Mesenteric fibrosis A Bowel or Venous Obstruction Carcinoid syndrome if 1) Liver metastases 2) Porto-systemic venous drainage |
| Appendix | Tip >> Base | Seritonoma | EC cell origin. Goblet cell type more aggressive. |
| Colorectal | Rectum>Ascending > Cecum> Sigmoid | Rare | L Cell origin. Higher incidence Synch/Metachronous Non-NET CA. Rectal NET 80%<0.6cm median. Rectum 50%, Ascending 22%, Cecum 11% , Sigmoid 10.5%. |
Definition
Neuroendocrine tumors consist of a heterogeneous group of cells that have both phenotypical and biochemical characteristics of neural and endocrine cells and the potential for malignancy. These bicameral cells must satisfy three criteria to qualify as being of neuroendocrine origin: (1) absence of axons, (2) production of neurotransmitter/neuromodulator hormones, and (3) membrane-bound vesicles from which these hormones are released by a process of regulated exocytosis in response to external stimuli. The substances that can be considered to arise from neural tissue are chromogranins A, B, and C; neuron-specific enolase; and neural cell adhesion molecule CD56 , and biogenic amines.
Background
The recognition that single or clusters of hormone-producing chromium-staining cells were present in the intestine was described in 1868 by Heidenhain and later confirmed by Kulchitsky, The first case of intestinal NET was recorded by Langhans and also in an autopsy in two patients by Lubarsch. Ransom described a patient with ileal cancers with extensive metastases who experienced diarrhea and dyspnea after eating possibly was the first description of the carcinoid syndrome. The eponym of “karkinoide tumoren,” or “carcinoid,” was coined by Oberndorfer in 1907 after recognizing this as a discrete disease entity. Nicholls described the first pancreatic islet cell tumor in 1902. In the early 20th century, special silver stains were used by Masson and Gossett , to demonstrate the argentaffin and argyrophilic properties of these tumors that appeared to have a neural origin. They suggested that the cell of origin was the enterochromaffin cell, previously described by Kulchitshy in 1897, from the crypts of Leiberkuhn. , The concept that the DNES was composed of these argentaffin-positive and argyrophilic-clear cells was introduced by Feyrter in 1938. Many of these cells have the capacity for the uptake and decarboxylation of precursors of biogenic amines and were referred to as “APUD” (amine precursor uptake and decarboxylation) and were initially hypothesized to arise from the neural crest; this theory was subsequently disproved. In 1953, Lembeck described the production of serotonin in carcinoid tumors and in 1955 Page demonstrated the association of increased urinary 5-hydroxyindoleacetic acid (5-HIAA) in carcinoid syndrome. The malignant carcinoid syndrome was described originally by Cassidy in 1934, and one of the first detailed descriptions of the carcinoid syndrome was described in a patient who was dying from a clinical syndrome that included flushing, diarrhea, edema, wheezing, and right-sided heart failure. Pathology demonstrated the presence of fibrotic subendocardial plaques In 1953, enterochromaffin cell secretion of serotonin was confirmed.
Carcinoid syndrome
Carcinoid heart disease occurs in up to 50%–60% of patients with the carcinoid syndrome. This system complex represents the clinical manifestation of serotonin, and tachykinin release that occurs in 20% of G1/2 NETs of the jejunum and ileum. Specific signs and symptoms in descending order of frequency are dry flushing with or without palpitations (70%), diarrhea (50%), intermittent abdominal pain (40%), lacrimation, and rhinorrhea. Wheezing and pellagra are uncommon. More recent reports have suggested that the incidence of carcinoid heart disease has declined, perhaps because of the introduction of somatostatin analogs and other antitumor therapies designed to reduce the tumor load and the production of vasoactive products.
Carcinoid crisis
This GE-NET–associated entity has been characterized as profound flushing, bronchospasm, tachycardia, and rapidly fluctuating blood pressure, These paroxysms are usually precipitated by anaesthesia induction, handling of tumor, embolization, or radiofrequency ablation (RFA). To counterbalance these events, short-acting octreotide is used as a constant infusion of 50 µg/hour initiated 12 hours before and given 24–48 after intervention. Short-acting 100–500 µg octreotide administered intravenously (IV) is followed by continuous infusion. These events can occur in nonsyndromic patients also; therefore, prophylactic octreotide is recommended in these patients as well.
Classification
The biologic complexity, functional diversity, low incidence, and nonuniform distribution of these cells have resulted in NET being recategorized on multiple occasions as new information has become available over the last 3 decades. Early attempts were made based on their histologic, biochemical, and clinical characteristics that paralleled their embryologic origin into foregut, midgut, and hindgut “carcinoid tumors.” Those approaches failed to provide prognostic and therefore therapy guidance. To better predict biologic behavior, the WHO introduced a classification for GE-NET in 2000 and in 2004 for PNEN that allowed for prognostic stratification and adjusted treatment , along with a standardized diagnostic procedure ; this has been validated for P-NET and foregut NET. The American Joint Committee on Cancer (AJCC)/International Union Against Cancer (UICC) tumor–node–metastasis (TNM) classification differs from the European Neuroendocrine Tumor Society (ENETS) system. , In the second half of 2010, a revised version of the WHO classification appeared for GEP-NETs. From a prognostic standpoint, the division between functional and nonfunctional tumors has no clinical significance. Nonfunctioning tumors typically present as larger masses detected by the appearance of an abdominal mass, pain, weight loss, or obstructive jaundice.
Hereditary syndromes
Four autosomal dominant disorders are known to be associated with GEP-NETs ( Table 15-3 ). Collectively, they account for less than 1% of all GEP-NETS. Their importance lies in the fact that they usually manifest at ages 2 decades earlier compared to the sporadic variety. Patients often have multiple synchronous G1/2 foci and have a family history. Nearly all patients harbor occult NETs at autopsy. The multifocality poses contradictions while attempting to resect the disease and as such many are considered unresectable at diagnosis. Medical management and family screening are paramount in theses cases.
| Hereditary Syndrome | Tumor | Percent Association | Incidence Million per year |
|---|---|---|---|
| MEN-1 , 140 , 141 | Insulinoma Gastrinoma Glucagonoma VIPoma Somatostatinoma “Non-Syndromic” | 5 25–40 10 5 45 20 | 1-2 1-2 0.1 0.1 <0.1 1-2 |
| VHL | “Non-Syndromic” Islet or Ductal | 10–17% | – |
| NF-1 | Insulinoma | <10% | – |
| Tuberous Sclerosis | Somatostatinoma | <1% | – |
Grade and stage
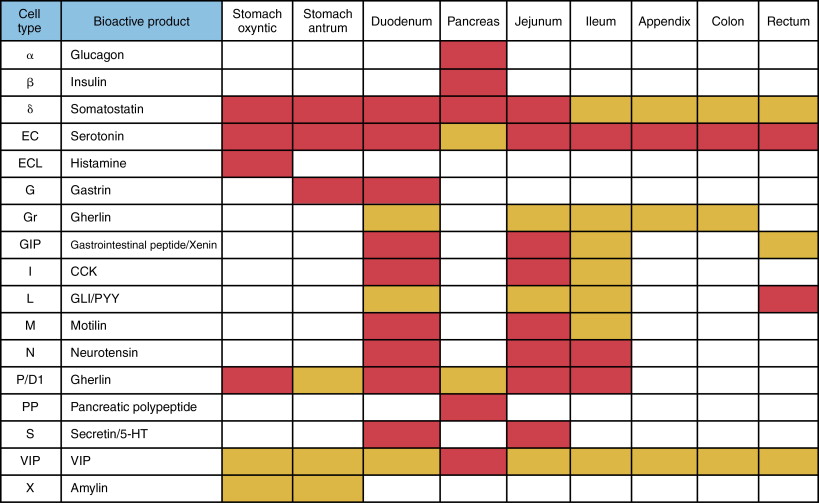
Determining the cellular characteristics of NET is central to determining an appropriate therapeutic approach. There are about 17 different types of neuroendocrine cells of the DNES residing in the GEP system. Each cell secretes a dominant chemical ( Figure 15-2 ). GEP-NETs are distributed asymmetrically and are clustered at the gastric fundus, proximal duodenum, papilla of Vater, terminal ileum, tip of appendix, lower rectum ( Figure 15-3 ).
Tumors should be classified according to the recent WHO 2010 classification, which has been based on the recently validated concept that all NETs have malignant potential. Grading is based on morphologic criteria seen on light microscopy with conventional staining (mitoses and necrosis) and proliferative activity performed via immunohistochemistry (Ki-67) ( Table 15-4 ).
| Differentiation | Grade | Mitotic count | Ki-67 Index | ENETS/WHO |
|---|---|---|---|---|
| Well | Low (G1) Intermediate (G2) | < 2 / 10 HPF 2–20 / 10 HPF | < 3% 3%–20% | NET Grade 1 NET Grade 2 |
| Poor | High (G3) | > 20 / 10 HPF | > 20% | NET Grade 3 |
Staging is in accordance with AJCC/UICC TNM 7th edition and ENETS criteria for stomach, pancreas, and appendix ( Table 15-5 ). NETs may have mixed adenocarcinoma elements. The rate of proliferation can be quantified by counting the number of mitoses per field and the percentage of cells that stain positive with Ki-67 antibody, which is the cardinal feature of tumor grading and has 5-year survival prognostication. , Difficulty sometimes arises in distinguishing benign from malignant behavior, and the presence of adjacent organ invasion, distant metastases, and lymph node involvement often are used to determine malignancy.
| Pancreas NET | Stage 0 | Tis N0 M0 | TX T0 Tis | Primary Tumor can not be assessed No evidence of primary tumor Carcinoma in-situ |
| Stage IA | T1 N0 M0 | T1 | Limited to pancreas, ≤ 2cm greatest dimension | |
| Stage IB | T2 N0 M0 | |||
| Stage IIA | T3 N0 M0 | T2 | Limited to pancreas, > 2cm greatest dimension | |
| T1 N1 M0 | ||||
| Stage IIB | T2 N1 M0 | |||
| T3 N1 M0 | ||||
| Stage III | T4 Any N M0 | T3 | Extends beyond pancreas, without involvement of celiac axis or superior mesenteric artery | |
| Stage IV | Any T Any N M1 | T4 | Involves celiac axis or the superior mesenteric artery |
| GE NET | Stage 0 | Tis* N0 M0 | TX | Primary Tumor cannot be assessed | ||||
| T0 | No evidence of primary tumor | |||||||
| Tis | Stomach – Carcinoma in-situ/dysplasia (<0.5mm), intra-mucosal | |||||||
| Stage I | T1 N0 M0 | Stomach | Small Intestine | Colon | Ampullary | |||
| T1 | ≤ 1cm | ≤ 1cm | A < 1cm | B 1-2cm | ≤ 1cm | |||
| And Lamina propria Or submucosa invasion | ||||||||
| Stage IIA | T2 N0 M0 | T2 | > 1cm | > 1cm | > 2cm | > 1cm | ||
| Or Muscularis propria invasion | ||||||||
| Stage IIB | T3 N0 M0 | |||||||
| Stomach | Jejunum or Ileum | Duodenum | Colon | Invasion of Pancreas, non peritonealized tissues or Retro-peritoneum | ||||
| Stage IIIA | T4 N0 M0 | Subserosal Invasion | ||||||
| T3 | N/A | And No penetration of overlying serosa or Non-peritoneal invasion | And Invasion of Pancreas, Non-peritonealized tissues or Retro-peritoneum | Or into non-peritonealized pericolic or perirectal tissues | ||||
| Stage IIIB | AnyT N1 M0 | |||||||
| Stage IV | Any T Any N M1 | T4 | Visceral peritoneum or other organs invasion | |||||
| Appendix NET | Stage I | T1 N0 M0 | TX T0 T1A T1B | Primary Tumor can not be assessed No evidence of primary tumor ≤ 1cm greatest dimension ≥ 1cm but < 2cm in greatest dimension |
| Stage II | T2, T3 N0 M0 T4 N0 M0 | T2 | ≥ 2cm but < 4cm Or extends to cecum | |
| Stage IIIA | AnyT N1 M0 | T3 | > 4cm Or extends to ileum | |
| Stage IV | Any T Any N M1 | T4 | Invades adjacent organs or structures |
Biochemistry
Different granules store individual peptide hormones; however, several peptides of amines may colocalize in the same granule. These secretory products allow for both serologic diagnosis, prognosis, and follow-up. The absence of a marker does not indicate absence of tumor.
Chromogranin A (CgA) is a water-soluble acidic glycoprotein stored in the secretory granules of neuroendocrine cells and can be used as a tumor marker regardless of hormone-related symptoms. CgA is sensitive but nonspecific and can be elevated in some other cancers. CgA levels have been found to correlate with tumor burden and may be used to monitor treatment. A CgA level reduction of >80% is predictive of symptom relief and disease control following surgery. CgA may not be elevated in insulinoma, and measurement of C peptide or proinsulin is helpful in this instance. Fasting serial blood glucose analysis is the gold standard diagnostic tool. CgA and gastrin are elevated in gastrinoma and an EGD with biopsy is usually needed to differentiate gastrinoma from atrophic gastritis. Rectal tumors do not secrete CgA.
Pancreatic polypeptide is found in high concentrations in 50%–80% of P-NETs and >30% of GE-NETs. Measurement of serotonin in plasma has been problematic, and the breakdown product 5-HIAA has been used, that is, as a 24-hour collection of urinary 5-HIAA; overnight 5-HIAA may be as sensitive. False-positive results may be encountered with the ingestion of tryptophan-containing foods.
Imaging
Endoscopy is the investigation of choice for suspected gastric, duodenal, and colorectal NETs. Endoscopic ultrasonography (EUS) can assess the depth of invasion and guide biopsy. , Computed tomography (CT) is most useful when suspicion for small bowel NET exists. , CT may not detect the primary disease, but it is useful for assessment of mesenteric disease, lymphadenopathy, and liver disease; CT enteroclysis is more sensitive for detection of bowel lesions of 85% and 97%, respectively. Capsule endoscopy is usually reserved when other techniques have failed because it is often unable to determine the location of the pathology.
Functional P-NETs are usually picked up earlier than nonfunctional ones. Resection may be curative, so accurate localization is important using a combination of imaging techniques. Multidetector CT may detect 94% of all insulomas and when combined with EUS this approaches 100%. Magnetic resonance imaging (MRI) is equivalent to CT for pancreatic lesions. EUS is very useful for demonstrating multiplicity in multiple endocrine neoplasia type 1 (MEN-1) and von Hippel-Lindau syndrome (VHL) and in deciding changes to disease management, for example, enucleation versus pancreaticoduodenectomy. Intraoperative ultrasonography is a useful adjunct to intraoperative palpation of the gland and assessment of the liver. Intraarterial calcium stimulation with hepatic venous sampling may be useful for localizing occult gastrinomas and insulinomas.
Seventy percent to 90% of GEP-NETs express somatostatin receptors (SSTR) with dominant 2 and 5 subtypes. Somatostatin receptor scintigraphy (SRS) based on utilization of indium 111 diethylene triamine-penta-acetic acid (DTPA)-D-Phe-octreotide ( In pentetreotide; Octreoscan Mallinckrodt Medical BV, Petten, Netherlands) is superior to standard imaging modalities in the detection of primary tumors and their metastases, with a median detection rate of 89%. SRS is indicated when the primary lesion has not been detected by other cross-sectional imaging methods or to assist with staging. It is also indicated when contemplating therapeutic SRS or somatostatin analogue therapy. In a study designed to understand the relative contribution when MRI, CT, and SRS SPECT-CT are done sequentially compared to the gold standard of surgery or liver biopsy. MRI detected 190 liver metastases missed by SRS and 69 missed by spiral CT. Therefore, MRI is the single most useful method in assessing hepatic metastatic tumor burden from NETs.
Therapy
General principles of therapy are to attempt curative intent resection whenever possible, but given the natural history of the disease, therapy is mostly palliative ( Figure 15-4 ). Maintaining quality of life in these circumstances becomes paramount and optimal management requires a multidisciplinary approach. In general, when the tumor size is less than 2 cm (exception appendix <1 cm), the disease is considered to have a high chance of cure after resection because the likelihood of metastases is low. However, about 46%–93% of patients with NET will have hepatic metastases at the time of diagnosis and more than half of them will have 50% of their liver replaced. Therefore, in GEP-NET resection is only possible in 10% of patients. In this circumstance, the 5-year survival is 0%–20% , compared to the typical postresection 5-year survival of 60%–80% , Noncurative, resection should be undertaken only if the debulking is more than 90%. In fact, the Cochrane database concluded that resection was the mainstay of survival-prolonging treatment. For GE-NETs, no proven systemic adjuvant therapy has been identified. However, some believe cytoreduction should be performed whenever possible even if complete resection may not be achievable. , Survival may also be influenced by the presence of high disease burden or hormone-related symptoms , , as disease recurrence occurs in the majority. , Some authors also suggest that the addition of long-acting somatostatin can prolong symptom-free survival.
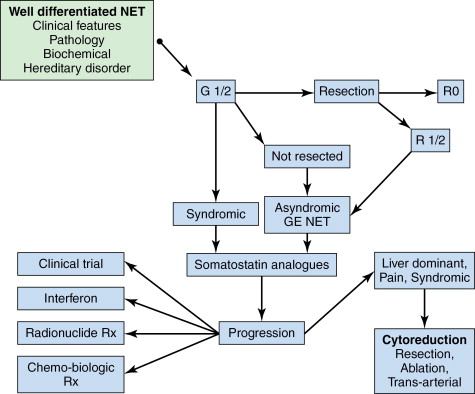
If midgut GE-NET is localized, resection is indicated. It is important to inspect the gut because 30% may be multicentric. According to ENETS consensus guidelines, resection should still be considered reasonable to prevent the development of intestinal obstruction or desmoplastic reaction or compression of the mesenteric vein. Studies have shown survival benefit with radical resection of mesenteric metastases in the presence of liver metastases and palliation of symptoms after removal of mesenteric tumor burden. In some studies of symptomatic liver metastases, a survival benefit may be noted if >80% of the primary tumor and hepatic metastases can be resected. , However, the majority of patients will develop recurrent disease. Liver transplantation is still considered experimental.
Systemic therapy
G1/2 midgut NETs should receive somatostatin analogues (SSA) even in the absence of symptoms. SSAs are the only proven hormonal management at present. SSTRs are found in 75%–95% of NETs and are less common in G3 NETs and somatostatinomas. SSAs bind principally to subtypes 2 and 5. Biochemical effects have been noted in 30%–70% of patients and symptomatic control in the 60%–80%. The standard therapeutic dose is octreotide LAR 10–30 mg every 4 weeks or lanreotide (Somatuline Autogel) 60–120 mg every 4 weeks. Patients often develop tachyphylaxis to octreotide, and in that circumstance pasireotide has shown to be an effective salvage option. In a phase 3 randomized trial of octreotide LAR versus placebo (PROMID trial) for midgut NETs, the progression-free survival favored the treatment arm (14.3 months vs., 6 months for placebo). SSAs have also shown effectiveness for P-NET. When clinical or radiologic progression occurs, midgut NET should receive radionuclide therapy (if functional imaging positive) or interferon alpha or liver-directed therapy if liver dominant. G1/2 P-NET should receive chemotherapy as first-line choice. , Streptozotocin combinations should be used for G1/2 P-NET when there is rapid clinical or radiologic progression. Streptomycin has a better response than doxorubicin. Sunitinib maleate is an oral tyrosine kinase that inhibits downstream from key drivers of angiogenesis, including vascular endothelial growth factor (VEGF) 2/3, platelet-derived growth factor (PDGF), and c-kit. In the registration phase 3 clinical trial in well-differentiated progressive P-NET, the improvement in progression-free survival was significantly improved at 11.4 m versus 5.5 m. Objective response rate was 9.3%.
Genetic abnormalities in the mTOR pathway are critical to the development of NETs. In a phase 3 study evaluating the mTOR inhibitor everolimus in G1/2 P-NETs, the response rate was noted to be 9.6% with a significant improvement in progression-free survival of 11.0 versus 4.6 months. Both these agents are now US Food and Drug Administration approved for use in this setting. A brief summary of recent management-altering trials is presented in Table 15-6 .

