INTRODUCTION
SUMMARY
The survival of red cells in the circulation can be measured in a variety of ways: (1) by labeling with radioactive isotopes, particularly chromium-51 (51Cr), and assessing the disappearance of the radioactive tag from the circulation over time; (2) by labeling the erythrocytes with biotin or a fluorescent dye and measuring this marker over time; (3) by determining the disappearance of transfused antigen-matched allogeneic erythrocytes using immunologic markers; and (4) by measuring the excretion of carbon monoxide, a product of heme catabolism.
Such studies show that normal human red cells have a finite life span averaging 120 days, with very little random destruction. The mitochondrial and ribosomal removal highlighting maturation of the reticulocyte is accompanied by increasing cell density, but after a few days of intravascular life span there is little further increase in density or other changes in the physical property of the red cells. Thus, cell density is not a good marker for aged red cells. This has made the senescent changes in the red cell that mark it for destruction difficult to study. Candidates for such changes include changes in membrane band 3 and exposure of phosphatidylserine on the membrane, which may be of major importance.
Acronyms and Abbreviations:
ADP, adenosine diphosphate; AMP, adenosine monophosphate; BNIP3L, an hypoxic regulated gene that facilitates mitochondrial autophagy; C3, third component of complement; 14C, radioactive carbon; CD44, cell differentiation antigen; CO, carbon monoxide; 50Cr, chromium-50; 51Cr, chromium-51; DFP, diisopropylfluorophosphate; 55Fe or 59Fe, radioactive iron; G6PD, glucose-6-phosphate dehydrogenase; HO, heme oxygenase; Ig, immunoglobulin; 111In, indium-111; 15N, nitrogen; PK, pyruvate kinase; 99mTc, technetium-99m.
RED CELL LIFE SPAN
Normal human red blood cells have a life span of approximately 120 days, after which they are engulfed by macrophages. This is an extremely efficient process as macrophages phagocytose approximately 5 million erythrocytes every second without a significant release of hemoglobin into the circulation. The precise molecular mechanism by which macrophages recognize senescent red blood cells for phagocytosis remains largely unknown. As red blood cells age, several physiologic changes occur that may serve as signals for recognition by macrophages.1,2 These include a decrease in the activity of enzymes,3 a progressive decrease of ATP content,4 a loss of lipid asymmetry with exposure of phosphatidylserine,5 an accumulation of lipid peroxidation products,6 a desialylation of membrane glycoprotein,7 an exposure of cryptic senescent antigens,8 aggregation of band 3 protein (Chap. 46),9 a decrease in deformability as the result of increased oxidative stress,10 and an increase in cell surface-bound immunoglobulins and complement components (Chap. 54).11,12 All of these changes have been investigated as signals for recognition by the macrophages.
The original method for the measurement of the red cell life span consisted in the transfusion of cells that were compatible but identifiable immunologically—the Ashby technique; type O red cells were infused into individuals with type A or B cells. The differential agglutination technique used anti-A or anti-B antiserum to measure the life span of type O red cells that were transfused to type A or type B recipients and the recipients’ own cells were removed using anti-A or anti-B serum.13 During World War II and shortly after, this method was used extensively, but in recent years, because of the hazards associated with the administration of allogeneic erythrocytes, it has been completely replaced by techniques based on labeling of autologous blood. Furthermore, this method could not be applied to autologous red cells.
In 1946, Shemin and Rittenberg demonstrated that the incorporation of nitrogen (15N)-labeled glycine into heme could be used to measure the life span of the red cells.14 Since then a number of other isotopic methods have been developed. These can be divided into three groups: (1) those that label a cohort of cells, (2) those that label cells randomly, and (3) those that use indirect measurements such as the rate of production of red cells or the rate of heme breakdown. The first two methodologic approaches yield information about the nature of the shortening of the red cell life span, age-dependent or random. The methodology yields only mean life span.
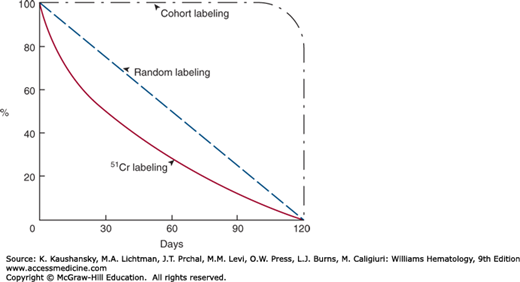
Cohort methods depend on the biosynthetic incorporation of the label into the developing red cells. In these methods, a group of cells of approximately the same age is labeled. The labels used are glycine-containing labeled 15N,14 radioactive carbon (14C),15 or radioactive iron (either 55Fe or 59Fe).16,17,18 The main disadvantage of cohort labeling is the need for prolonged periods of sampling, especially if the life span is only moderately reduced (Fig. 33–1). In addition, radioiron from destroyed red cells may be reused, making it difficult to interpret results. Furthermore, the increasing restrictions on use of radiochemicals has drastically decreased availability of these two previously widely used nuclear medicine tests.
A simple double-labeling technique that allows nonradioactive cohort labeling was described using two distinct labeling steps separated by a defined time interval. Cells are subsequently evaluated by the relative proportions of these labels. The initial labeling step uses biotin that binds to all circulating cells (the red blood cells accounting for most of the label) the second administered labeling substance at later time digoxigenin then distinguishes erythrocyte subpopulation of known age.19
The random-label methods are the Ashby differential agglutination technique,13 which uses an immunologic marker, and or the use of various red cell labels such as chromium-50 (50Cr), chromium-51 (51Cr), or chromium-53 (53Cr),20,21,22 diisopropylfluorophosphate (DFP) labeled with phosphorus-32 (32P),23 14C,24 or 14C cyanate,25 a lipophilic dye,26,27 or biotin.28,29
By far the most commonly used radioactive isotope for the measurement of the red cell life span is 51Cr. As the chromate ion penetrates the red cell membrane it binds to the β and γ chains of globin. Unfortunately, these bonds are not covalent and there is a continuous elution of the isotope, varying from 0.5 to 2.9 percent per day.30 DFP, on the other hand, is irreversibly bound to red cell cholinesterase. There is some elution of unbound DFP during the first 2 to 3 days of study, but after that, DFP disappearance closely matches red cell destruction.23,31 Nevertheless, because sample preparation is somewhat complicated, this label is not commonly used.
The life span is estimated by measuring the survival of randomly labeled red cells. Immediately following transfusion, the labeled red cells equilibrate with unlabeled red blood cells (RBCs). This takes normally approximately 5 minutes,32 but may be longer in patients with splenomegaly. Following equilibration, the cells that have been damaged by the labeling process will be removed from the circulation during the next 24 hours. RBCs that survive this period will usually have their expected long-term survival.33
To accurately calculate red cell life span using a random label method requires steady-state conditions or that correction can be made for concurrent blood loss or blood transfusion. Fortunately, it is usually possible to gain an accurate estimate of red cell half-life by sampling three times a week for 1 to 2 weeks.
In the normal human the red cell, life span is finite with an average of approximately 120 days, with very little random destruction, that is, loss irrespective of cell age (0.06 to 0.4 percent per day). In some mammalian species the amount of random destruction is much greater.34 The survival curve of randomly labeled human red cells should consequently be nearly linear from day 0 to day 120, with a half-life of 60 days. When 51Cr is used as the label, approximately 1 percent of label elutes per day and the survival curve becomes exponential with a half-life of approximately 30 days (see Fig. 33–1). For clinical use, the red cell life span is usually expressed as chromium half-life (T1/2) and compared to the normal value for the method of 30 days.
Because merely expressing the red cell life span measured by chromium as chromium T1/2 will not give information as to the character of destruction, senescence versus random, it has been recommended that in addition a correction factor for chromium elution be used and the data recorded using linear coordinates.35 If the data lie on a straight line, the destruction is by senescence and the life span can be calculated as twice the half-life. If the data indicate exponential disappearance and it is necessary to use a semilogarithmic paper in order to depict the data on a straight line, the destruction is random and the life span is 1.44 times the half-life. One objection to this method is that the degree of chromium elution is not a constant but varies from day to day and is influenced by various disease states.30 Furthermore, the best fit of data is rarely linear or exponential, but somewhere between. Although computer-assisted methods can resolve ambiguities, the inherent biologic and technical variations in measuring red cell life span are such that it is better to rely on chromium T1/2 with intuitive adjustments based on clinical findings.
A nonradioactive label has also been developed to label the RBCs in humans by covalent attachment of biotin to red cell membrane proteins and enumerating the survival by flow cytometry.36 Biotin labeling estimates RBC survival comparable to that obtained with a concurrent 51Cr label for both normal volunteers and patients with sickle-cell disease. In addition to being a nonradioactive probe, biotin labeling has other advantages. The transfused cells can be isolated from the patients on avidin substrates for further characterization. Biotin labeling has been used to demonstrate that sickle cells without fetal hemoglobin have a shorter in vivo survival compared to those with fetal hemoglobin,37 and has been also instrumental in showing a role for phosphatidylserine exposure in the clearance of sickle cells.38
There are two approaches to the calculation of the red cell life span by indirect methods: from a measurement of the rate of production of red cells using radioactive iron and from a measurement of the rate of breakdown of heme to bilirubin,39 that is, the release of carbon monoxide from catabolized heme.40 Both of these compounds are derived almost exclusively from catabolized hemoglobin and measurements of their rate of production have provided useful information about the red cell life span. There are too many variables that affect the serum bilirubin level to make it a reliable, quantitative measurement of red cell destruction. The measurement of carbon monoxide (CO) production was formerly very tedious, requiring elaborate rebreathing apparatus. With the development of newer technologies,41,42 measuring CO levels has become more practical. An advantage of the measurement of blood CO as an indication of the rate of red cell destruction is that it gives the rate of destruction at a single point in time. An instrument by CoSense (Capnia Inc., Palo Alto, CA) obtained FDA 510(k) clearance in December 2013 and provides a substitute for the previous Natus end-tidal breath analyzer (Natus Medical, San Carlos, CA) that had not been available for about a decade. CoSense is compact and portable, and uses a sterile one-time-use single nasal cannula for quantifying end-tidal breath for CO quantification and also samples ambient CO, which is subtracted from the value in exhaled breath and is suitable for use in neonates. This device also counts the breath rate, analyzes CO in individual breaths, and provides CO measurements in parts per million in a matter of minutes.
IN SITU LOCALIZATION OF RED CELL PRODUCTION AND DESTRUCTION
As part of routine erythrokinetic studies both radioactive iron and radioactive chromium may be used to localize red cell production and red cell destruction. This is accomplished by positioning probes for external counting over the sacrum, liver, spleen, and heart and measuring the distribution of radioactivity in the body.43
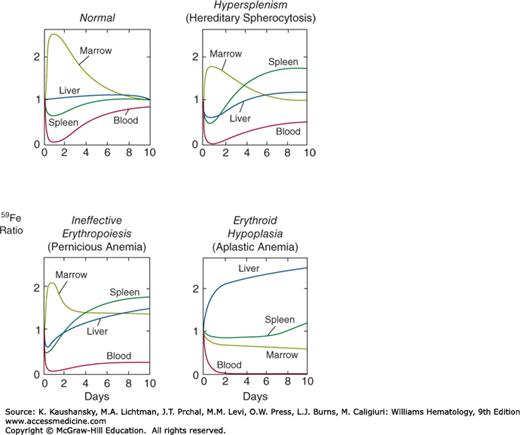
In a normal subject, 59Fe injected intravenously is cleared rapidly from the plasma, and within 24 hours approximately 85 percent of the radioactivity can be accounted for in the marrow. The liver and the spleen divide the remaining 15 percent. Over the next 10 days the marrow radioactivity decreases gradually as a result of the release into circulating blood of red cells labeled with radioactive hemoglobin. Patterns showing different uptake and distribution of the radioactive iron have been found for various hematologic disorders.44 In hypersplenism, the trapping and destruction of iron-labeled cells in the spleen increases splenic radioactivity rapidly, and in patients with erythroid hypoplasia the distribution of radioactive iron between liver and marrow is reversed (Fig. 33–2).
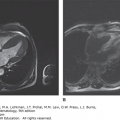
Figure 33–2.
Tissue distribution of 59Fe in normal subjects, hypersplenic patients, and anemic patients with ineffective and effective erythropoiesis. The radioactivity is expressed on the ordinate as a ratio relative to the radioactivity measured in the same organ 15 minutes after the intravenous administration of the isotope. (Redrawn with permission from Hillman RS and Finch CA: Erythropoiesis: Normal and abnormal. Semin Hematol (4):327-336, 1967.)
More effective methods demonstrating in situ erythropoiesis involve imaging the macrophages in the marrow, liver, and spleen with a technetium-99m (99mTc) sulfur colloid or indium-111 (111In).45 Although these isotopes label primarily the monocyte-macrophage system, their uptake is similar to that of 59Fe and they can be used as surrogate markers to estimate the distribution of erythroid tissue.
Surface counting for 51Cr-labeled red cells provides a characteristic organ distribution of radioactivity and has been used to demonstrate the degree of red cell sequestration and destruction in an enlarged spleen (see Fig. 33–2).46 This approach has been used to predict the results of elective splenectomy, but the utility of this method has been challenged.47 The in situ localization of red cell sequestration or destruction can also be determined by following the tissue distribution of 59Fe-labeled red cells, especially if the red cell life span is very short.
Labeling a cohort of human erythrocytes with 59Fe and centrifuging the cells in a density gradient demonstrates that reticulocytes and young red cells are less dense than mature red cells.48,49 However, at the end of the life span of the labeled cohort, radioactivity is fairly evenly distributed throughout red cells of all densities, with only a slight tendency of the radioactivity to be concentrated in the more dense cells. Unfortunately, many studies of the properties of senescent cells in the past have been based upon the characteristics of the most dense fraction of erythrocytes, using various fractionating techniques. In fact, the most dense fraction of red cells is only slightly enriched with old erythrocytes.50,51 A combination of density separation and elutriation seemed to provide results superior to density separation alone using hemoglobin A1C content as a marker, but the degree of enrichment with older cells has not been documented using actual old red cells as separated by biotinylation or by the mouse hypertransfusion technique.52
There are two animal models and one human disease model that provide cells that are truly aged. In mice, in vivo aged cells have been produced by serially transfusing mice, maintaining polycythemia to suppress virtually all erythropoiesis.53 In other species, particularly the rabbit, red cells have been labeled with traces of biotin, which allows them to be recovered from the circulation.54
Related posts:
Stay updated, free articles. Join our Telegram channel

Full access? Get Clinical Tree


