INTRODUCTION
SUMMARY
Determining a patient’s blood cell counts and examining the appearance of cells on a blood film is central to the diagnosis of blood cell diseases and can give important information about numerous other degenerative, inflammatory, and neoplastic diseases that are reflected in quantitative or qualitative changes of blood cells. The quantity and quality of blood cells reflects the aggregate function of the major blood forming tissue, the marrow, and is thus an essential component of diagnosis and followup of primary hematological disorders. The decision to perform a marrow examination, and the types of special studies required, follow from a careful analysis of blood cells. Currently available automated blood cell analyzers continue to evolve and are the mainstay of blood cell counting, providing an increasing array of novel quantitative parameters, and flagging of abnormal samples that need manual microscopic review. The blood provides a unique example of a tissue that can be readily analyzed with a degree of quantitative detail unavailable in any other organ system.
The blood is examined so as to answer these questions: Is the marrow producing appropriate numbers of mature cells in the major hematopoietic lineages? Is the development of each hematopoietic lineage qualitatively normal? Are there abnormal (e.g., leukemia or lymphoma) cells in the blood? Quantitative measures available from automated cell counters are reliable and provide a rapid and cost-effective way to screen for primary or secondary disturbances of hematopoiesis. Light microscopic observation of the blood film is essential to confirm certain quantitative results and to investigate qualitatively abnormal differentiation of the hematopoietic lineages. Based on examination of the blood, the physician is directed toward a more focused assessment of marrow function or to systemic disorders that secondarily involve the hematopoietic system.
The complete blood count is a necessary part of the diagnostic evaluation in a broad variety of clinical conditions. Similarly, the leukocyte differential count and examination of the blood film, in spite of limitations as a screening test for occult disease, is important in initial consideration of the differential diagnosis in most ill patients. Although quantitative and qualitative (morphologic) examination of the cells of the blood are considered separately in this chapter, the distinction between these two is not absolute, and measures once considered “qualitative” become quantitative as technology advances.
Acronyms and Abbreviations:
CHr, reticulocyte-specific hemoglobin content; EDTA, ethylenediaminetetraacetic acid; fl, femtoliter; FRC, fragmented red cell counts; Hct, hematocrit; HYPO%, percentages of red cells falling below a cutoff for hemoglobin concentration; %HypoHe, percentages of red cells falling below a cutoff for hemoglobin content; Ig, immunoglobulin; MCH, mean cell hemoglobin; MCHC, mean cell hemoglobin concentration; MCV, mean cell volume; MPV, mean platelet volume; NHANES, National Health and Nutrition Examination Survey; NK, natural killer; PDW, platelet volume distribution width; RBC, red blood cell; RDW, red cell distribution width; RET-He, reticulocyte-specific hemoglobin content.
QUANTITATIVE MEASURES OF CELLS IN THE BLOOD
Automated blood cell analysis is the cornerstone of the modern hematology laboratory, allowing rapid, cost-effective, and accurate analysis of the cells of the blood, including new parameters with diagnostic utility. The morphologic and functional complexity of blood cells requires direct microscopic examination of a stained blood film by a trained observer. However, it is possible to use automated techniques to analyze and report on the majority of samples, using defined criteria (“flags”) to select those that need further microscopic review. Automated hematology analyzers typically incorporate multiple proprietary software flags based on acceptability criteria related to pattern recognition in the multiparameter displays or comparison of different detection modes for the same cell type. These are frequently updated in software or when new models are introduced to improve sensitivity and specificity. In this way, instruments identify samples that contain cells or abnormalities the instrument cannot definitively identify, so that a skilled morphologist can visually evaluate that specimen. Some of these flags can be adjusted or suppressed by the user to achieve an appropriate balance that minimizes both false positives and false negatives. The optimum balance is dependent on the patient population examined. Guidelines for manual smear review based on comparative data have been published, based on instruments then in common use.1 Protocols for evaluating and adjusting flagging criteria within an individual laboratory have been described.2 Manual review may consist of a scan of the blood film, a more detailed blood film examination including leukocyte differential count, or a physician’s review, based on laboratory defined criteria.3 The proportion of samples requiring manual blood film review differs among instruments and the type of patient population tested. Studies show a 10 to 30 percent manual review rate,4,5,6 with a false negative rate (i.e., abnormal samples that were not flagged for review) varying from approximately 3 percent1 to 10–14 percent.4 Most of the false negatives with current instrumentation are related to red cell and platelet morphology with relatively limited diagnostic significance.4 Continued improvement in methodology and increased sophistication of data analysis will result in further reduction of unnecessary manual smear reviews. Depending on workload and space considerations, laboratories may choose to link automated hematology analyzers with automated blood film preparation and automated image analyzers to facilitate manual morphologic review of cells by traditional light microscopy or online review of digitized images.7 These instruments can provide a provisional differential count with good accuracy,8 although typically final classification of problematic cells is performed by a technologist or physician.
The characteristics of automated hematology analyzer systems have been reviewed.9 A detailed description of individual instruments is beyond the scope of this chapter, but the general principles employed by state-of-the-art instrumentation are summarized below. The major analytical challenges are the frequency of the different cell types, which vary over many orders of magnitude, from red cells (millions per μL) to basophils (dozens per μL), and the complexity of the structure of normal and abnormal blood cells. Over the past several decades, instruments have become increasingly sophisticated with the use of multiple parameters to produce more precise results in the great majority of patient samples. In a typical automated hematology analyzer, the blood sample is aspirated and separated into different fluidic streams. The streams are mixed with various buffers that accomplish specific purposes in the analysis, for instance, using differential lysis to distinguish subsets of leukocytes, reagents to measure hemoglobin or detect myeloperoxidase containing leukocytes, and various fluorescent dyes. Measurements of each fluidic stream are made in flow as the sample passes through a series of detectors in what are essentially modified flow cytometers (Chap. 3). Commonly used principles include light scatter at various angles, electrical impedance and conductivity, and fluorescence or light absorption of cells stained in flow. Light scatter yields information about cell size (using scatter at low-incident angles), nuclear lobulation, and cytoplasmic granularity (using high-angle light scatter) and refractive index, with polarization of the scattered light as an additional parameter. If red cells are converted to spherocytes by the buffer solution to eliminate the variability of cell shape, light scatter at different angles can provide information about hemoglobin content, as well as size of individual red cells. Cell size is also estimated by measuring change in electrical resistance, which is proportional to cell size as cells enter a narrow orifice through which a direct current is maintained, the original Coulter principle, named for Wallace Coulter who developed the electronic particle counter.10 Radiofrequency capacitance measurement yields additional intracellular structural information that complements the direct current measurement. Differential lysis with detergents of varying strength or pH is used to separate certain leukocyte types, such as basophils and immature granulocytic cells, from the major normal blood cell types. In addition, nucleic-acid-binding fluorescent dyes incorporated into the lysis buffer measure total RNA plus DNA in the cells and are used in some analyzers to help differentiate leukocyte types. Fluorescence measurements after staining with RNA binding dyes are commonly used to detect and subclassify reticulocytes and platelets. Light absorption is the principle used for hemoglobin measurement and in some instruments for identifying peroxidase-positive granulocytes. Instruments rely on a combination of techniques for accuracy and precision11 (Fig. 2–1). Complex algorithms are invoked to determine whether the distribution of variables for a specific result or for the specimen as a whole fit sufficiently within an expected variable space so that the results can be reported with high confidence, or whether the specimen should be “flagged” for further analysis or manual blood film review (Fig. 2–2). There is significant overlap in methodology between automated hematology analyzers and flow cytometers (flow cytometers are discussed in Chap. 3). The latter are distinguished by extensive use of fluorochrome tagged antibodies to identify cell subtypes. These instruments have replaced laborious manual work, but also demand increasing interpretation skills on the part of laboratory technologists. Automated blood analyzers have been adapted to accurately count the smaller numbers of blood cells typically found in body fluids,12 but accurate differential counts13 and detection of blast cells in fluids of patients14 remains a challenge.
Figure 2–1.
Schematic of multiparameter cell discrimination in an automated hematology analyzer. The Sysmex XE-2100 is used as an example, in which leukocytes are discriminated by (A) DNA/RNA fluorescence using a polymethine dye versus high-angle (side) light scatter in lysed blood; (B) side scatter versus low-angle (forward) light scatter after acidic lysis in a separate aliquot that preserves basophil structure; and (C) direct current (DC) impedance versus radio frequency (RF) capacitance of cells subjected to a lysis reagent that relatively preserves immature cells with lower membrane lipid content. Nucleated red blood cells (NRBC) are distinguished (D) in a lysed sample stained with nucleic acid dye where leukocyte nuclei have detectably higher DNA/RNA content than red cell nuclei. Atyp Lymph, atypical lymphocytes; Baso, basophils; Blasts, blast cells; Diff Channel, differential count channel; Eos, eosinophils; HPC, hematopoietic progenitor cells; Imm Gran, immature granulocytes; Lymph, lymphocytes; Mono, monocytes; Neut + Baso, neutrophils + basophils; Plt Clumps, platelet clumps; WBC, white blood cells.
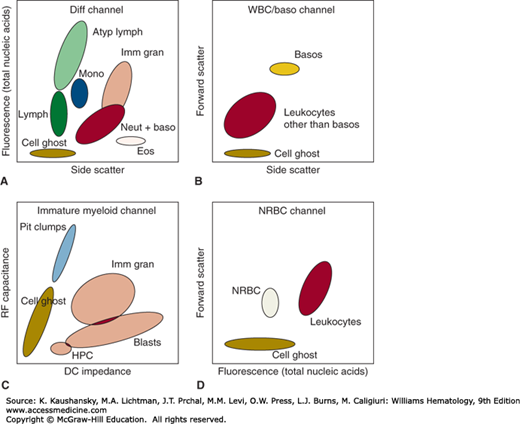
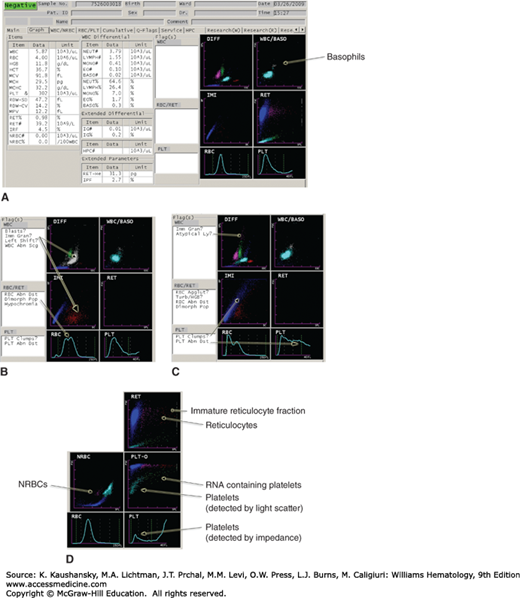
Figure 2–2.
Examples of how samples containing various abnormal findings are flagged for manual review. A. Normal sample showing how the major variables and results are displayed. B. Immature granulocytes appearing on the DIFF (leukocyte differential count) and IMI (immature myeloid) histograms, as well as a dimorphic red cell population. C. Multiple flags, including cells in the area of atypical lymphocytes, and platelet clumps with abnormal platelet volume distribution. D. Appearance of nucleated red blood cells (NRBCs), reticulocytes, and reticulated platelets on a different set of parameters. This figure is not intended as a comprehensive illustration of the technical details, but serves to demonstrate that differential lysing reactions coupled with multiparameter light-scatter, impedance, capacitance, and fluorescence measurements are used to analyze blood cells in current high-throughput instruments.
Point of care “bedside” testing is far more challenging in hematology than for typical clinical chemistry analytes for many of the reasons described above. Instruments have been described for bedside measurement of hemoglobin, total leukocytes, three-part leukocyte differential count, malaria parasitemia, and CD4+ T-cell count, mainly targeting clinical settings with limited access to standard laboratory testing. More work remains to be done to demonstrate the reliability and clinical impact of such testing strategies.15
Some red cell parameters (for instance, mean cell volume [MCV], red cell number, hemoglobin concentration, red cell distribution width [RDW]) are directly measured, while others (for instance, hematocrit, mean cell hemoglobin [MCH], mean cell hemoglobin concentration [MCHC]) are derived from these primary measurements.
In electronic instruments, the hematocrit (Hct; fractional volume of blood occupied by erythrocytes) is calculated from the product of direct measurements of the erythrocyte count and the MCV: (Hct [μL/100 μL] = RBC [× 10−6/μL] × MCV [fl]/10). Falsely elevated MCV and decreased red cell counts can be observed when red cell autoantibodies are present and retain binding capability at room temperature (cold agglutinins and some cases of autoimmune hemolytic anemia). This causes red cells to clump and affects the accuracy of both the red blood cell (RBC) count and MCV, as well as the resultant hematocrit.
The hematocrit may also be determined by subjecting the blood to sufficient centrifugal force to pack the cells while minimizing trapped extracellular fluid. This approach was traditionally done in capillary tubes filled with blood and centrifuged at very high speed in a small tabletop centrifuge, and the technique was referred to as the “microhematocrit” or informally as a “spun crit.” Before standardized methods for hemoglobin quantification were available, the hematocrit was the simplest and most accurate method for determining the fractional volume of red cells in blood and by inference the hemoglobin. However, this is a manual procedure not well adapted to routine processing in a high-volume clinical laboratory, and is affected by varying amounts of plasma trapped between red cells in the packed cell volume,16 typically about 2 to 3 percent of the packed volume.17 The hematocrit from polycythemic samples or blood containing abnormal erythrocytes (sickle cells, thalassemic red cells, iron-deficient red cells, spherocytes, macrocytes) is increased because of enhanced plasma trapping associated with increased red cell rigidity.17 Therefore, although automated hematocrit values are adjusted to be equivalent to spun hematocrit for normal samples, in abnormal samples, the spun hematocrit may be spuriously elevated (up to 6 percent in microcytosis).18 The hemoglobin determination now is preferred to the hematocrit, because it is measured directly and is the best indicator of the oxygen-carrying capacity of the blood.
Hemoglobin is intensely colored, and this property has been used in methods for estimating its concentration in blood. Erythrocytes contain a mixture of hemoglobin, oxyhemoglobin, carboxyhemoglobin, methemoglobin, and minor amounts of other forms of hemoglobin. To determine hemoglobin concentration in the blood, red cells are lysed and hemoglobin variants are converted to the stable compound cyanmethemoglobin for quantification by absorption at 540 nm. All forms of hemoglobin are readily converted to cyanmethemoglobin except sulfhemoglobin, which is rarely present in significant amounts. In automated blood cell counters, hemoglobin is usually measured by a modified cyanmethemoglobin or an alternate lauryl sulphate method. In practice, the major interference with this measurement is chylomicronemia, but newer instruments identify and minimize this interference. Noninvasive transcutaneous monitoring of total hemoglobin concentration, as well as methemoglobin and carboxyhemoglobin, using multiwavelength pulse oximetry has become available.19 Although these instruments offer the opportunity to track hemoglobin concentration trends in patients subject to blood loss and fluid shifts,20 it is not yet clear that they have sufficient precision to guide transfusion decisions.21,22 Such hemoglobin measurements may be unreliable under conditions of peripheral circulatory hypoperfusion.
The hemoglobin level varies with age (Table 2–1). Chapter 7 discusses changes in hemoglobin in the neonatal period. After the first week or two of extrauterine life, the hemoglobin falls from levels of approximately 17 g/dL to levels of approximately 12 g/dL by 2 months of age. Thereafter, the levels remain relatively constant throughout the first year of life. Any child with a hemoglobin level below 11 g/dL should be considered anemic.23 Chapter 8 discusses changes in hemoglobin concentration with pregnancy and Chap. 9 discusses changes in hemoglobin levels in older persons.
| Age | Leukocytes Total (× 103/μL) | Neutrophils | Eosinophils | Basophils | Lymphocytes | Monocytes | Hemoglobin g/dL Blood | ||
|---|---|---|---|---|---|---|---|---|---|
| Total | Band | Segmented | |||||||
| 12 mo | 11.4(6.0–17.5) | 3.5(1.5–8.5) 31 | 0.35(0–1.0) 3.1 | 3.2(1.0–8.5) 28 | 0.30(0.05–0.70) 2.6 | 0.05(0–0.20) 0.4 | 7.0(4.0–10.5) 61 | 0.55(0.05–1.1) 4.8 | 12.6(11.1–14.1) |
| 4 yr | 9.1(5.5–15.5) | 3.8(1.5–8.5) 42 | 0.27(0–1.0) 3.0 | 3.5(1.5–7.5) 39 | 0.25(0.02–0.65) | 0.05(0–0.2) | 4.5(2.0–8.0) | 0.45(0–0.8) | 12.7(11.2–14.3) |
| 2.8 | 0.6 | 50 | 5.0 | ||||||
| 6 yr | 8.5(5.0–14.5) | 4.3(1.5–8.0) 51 | 0.25(0–1.0) 3.0 | 4.0(1.5–7.0) 48 | 0.23(0–0.65) 2.7 | 0.05(0–0.2) 0.6 | 3.5(1.5–7.0) 42 | 0.40(0–0.8) 4.7 | 13.0(11.4–14.5) |
| 10 yr | 8.1(4.5–13.5) | 4.4(1.8–8.0) 54 | 0.24(0–1.0) 3.0 | 4.2(1.8–7.0) 51 | 0.20(0–0.60) 2.4 | 0.04(0–0.2) 0.5 | 3.1(1.5–6.5) 38 | 0.35(0–0.8) 4.3 | 13.4(11.8–15.0) |
| 21 yr | 7.4(4.5–11.0) | 4.4(1.8–7.7) 59 | 0.22(0–0.7) 3.0 | 4.2(1.8–7.0) 56 | 0.20(0–0.45) 2.7 | 0.04(0–0.2) 0.5 | 2.5(1.0–4.8) 34 | 0.30(0–0.8) 4.0 | M: 15.5(13.5–17.5) F: 13.8(12.0–15.6) |
The size and hemoglobin content of erythrocytes (red cell indices), based on population averages, have traditionally been used to assist in the differential diagnosis of anemia.24 A variety of newer indices based on size and hemoglobinization characteristics of red cell subpopulations are discussed in the section “Novel Red Cell and Reticulocyte Indices”.
Automated blood counters measure the MCV directly by either electrical impedance or light scatter measurements of individual red cells. The MCV has been used to guide the diagnostic workup in patients with anemia; for example, testing patients with microcytic anemia for iron deficiency or thalassemia, and those with macrocytic anemia for folate or vitamin B12 deficiency. This approach has practical value, but also limitations25; for instance, MCV may be normal in some older patients with pernicious anemia,26 or in advanced pernicious anemia with severe red cell fragmentation,27 while one-third of older patients have an elevated MCV without an evident cause.28 Mathematical manipulations of various red cell indices take advantage of the trend toward relatively more severe microcytosis than hypochromia in thalassemia trait versus iron-deficiency anemia to assist in the differential diagnosis of these disorders,29 particularly in high-prevalence populations where laboratory resources are limited,30 but their usefulness has been questioned.31
The MCH, the amount of hemoglobin per red cell, increases or decreases in parallel with the red cell volume (i.e., MCV) and generally provides similar diagnostic information, although because this parameter is affected by both hypochromia and microcytosis, it is as least sensitive as the MCV in detecting iron-deficiency states.32 Another advantage of the MCH is the consistency across different analyzer types, as it is derived from two of the most accurately measured parameters: hemoglobin and red cell count.33 The MCHC is not used much diagnostically, and is primarily useful for quality control purposes, such as detecting sample turbidity. These red cell indices are average quantities and, therefore, may not detect abnormalities in blood with mixed-cell populations. In situations such as sideroblastic anemia, recently transfused patients, patients with severe pernicious anemia with red cell fragmentation, and folate plus iron deficiency, both large and small red cells are present, diminishing the value of the MCV.
The RDW is an estimate of the variance in volume within the population of red cells, expressed as 1 SD of red cell volume measurements divided by the MCV. Instrument manufacturers calculate RDW using different algorithms, so that reference ranges vary according to analyzer model. The RDW can be used in the laboratory as a flag to select those samples that should have manual review of blood films for red cell morphology. More significantly, a large literature has now developed around the evidence that the RDW is a biomarker predicting morbidity and mortality in a broad variety of clinical settings,34 such as angina/myocardial infarction,35 heart failure, trauma, pneumonia, sepsis, intensive care treatment, renal and liver disease, and in the general population.36 Most of these studies are retrospective, observational, or cohort-based studies, often using databases of routinely collected data gathered for other purposes, but prospectively designed studies have arrived at similar conclusions.37,38 The RDW retains its association with poor clinical outcomes whether or not anemia is present,39 and it adds predictive power to more established predictive risk models.40 RDW may be a surrogate for systemic inflammation41 and/or oxidative stress, but the predictive value of RDW is independent of other inflammatory markers,40 suggesting that this biomarker is tracking other mechanistic processes as well. Identification of physiologic mechanisms linking RDW to adverse clinical outcomes will be important in using this predictive biomarker to inform therapeutic decisions.34
The reticulocyte is a newly released anucleate red cell that enters the blood with residual detectable amounts of RNA (Chaps. 31 and 32). The number of reticulocytes in a volume of blood permits an estimate of marrow erythrocyte production and is thus useful in evaluating the pathogenesis of anemia by distinguishing inadequate production from accelerated destruction (Chap. 32). The manual method for enumerating reticulocytes by placing a sample of blood in a tube containing new methylene blue and preparing a blood film to enumerate the proportion of cells that show blue beaded precipitates (residual ribosomes) has largely been replaced by automated methods, which are incorporated into high-volume hematology analyzers.42 Reticulocytes are identified by direct fluorescence measurement after staining with RNA-binding dyes or light scatter measurements to detect staining if nonfluorescent RNA-binding dyes are used. Various proprietary combinations of light scatter and other parameters are used to minimize interferences such as nucleated red cells, nuclear remnants (Howell-Jolly bodies), malaria parasites, or platelet clumps.
Automated reticulocyte counts are typically reported in absolute numbers (reticulocytes per μL or per L of blood), obviating the need to correct for a reduced red cell count (anemia), if present. However, one may still consider the effect of elevated erythropoietin levels secondary to severe anemia, which results in premature release of reticulocytes persisting in the circulation for more than the usual 1 day, correspondingly inflating estimates of daily marrow reticulocyte production based on the reticulocyte count (Chap. 32). The correlation between manual and automated methods of reticulocyte enumeration is good, but reference ranges differ slightly among the methods, given the different dyes and conditions used and the continuous nature of the variables separating reticulocytes from mature red cells.
Many hematology analyzers now report some quantitative measure of reticulocyte RNA content. Increase in the immature (highest RNA content) reticulocyte fraction is an early sign of marrow recovery from cytotoxic therapy43 or treatment for nutritional anemias, usually preceding the rise in total reticulocyte count. A limitation at present is that the methods lack standardization and reference ranges for these parameters are instrument dependent.44
Current high-end automated cell counters measure unique properties of mature red cells and reticulocytes on a cell-by-cell basis, not just as population averages. The result is a plethora of new indices that are in many cases specific to an instrument manufacturer, presenting new diagnostic opportunities but also a confusing nomenclature and a potential lack of comparability. Some examples of parameters that have been studied include %HypoHe, %MicroR, RET-He (available on Sysmex instruments), CHr, HYPO% (Siemens), RSf, LHD% (Beckman-Coulter), and FRC (fragmented red cells; Sysmex and Siemens).
New formulas for distinguishing causes of microcytosis based on several novel red cell indices function about as well45 or somewhat better46 than traditional formulas for differentiating iron deficiency from thalassemia trait. More sophisticated mathematical modeling of individual cell-based volume and hemoglobin content data available in current analyzers has been used in a systems biology approach to demonstrate latent iron deficiency and to distinguish causes of microcytosis.47,48 The ability of new automated analyzers to measure parameters specifically in reticulocytes on a cell-by-cell basis also opens up the possibility of reticulocyte-specific indices. The theoretical advantage is that acute changes in red cell function would be detected more rapidly and reliably in the reticulocyte fraction as opposed to the total red cell population.
Estimates of reticulocyte-specific hemoglobin content (CHr and RET-He, which are comparable) by light-scatter measurements of reticulocytes are closely related to adequacy of iron availability to erythroid precursors during the preceding 24 to 48 hours, and have been described as diagnostically useful in detecting functional iron deficiency in complex clinical settings, such as chronic inflammation49 and chronic renal disease.50 The increase in serum ferritin as an acute phase reactant combined with the physiologic variation of serum iron and iron-binding capacity limits the value of conventional parameters in these settings. The CHr may be a better predictor of depleted marrow iron stores than traditional serum iron parameters in nonmacrocytic patients,51 and is a more sensitive predictor of iron deficiency than hemoglobin for screening infants52 and adolescents for iron deficiency. Estimates of percentages of red cells falling below a cutoff for hemoglobin concentration (HYPO%) or hemoglobin content (%HypoHe) may provide greater sensitivity than the corresponding mean values averaged over all red cells, for instance with respect to iron deficiency in renal disease.53 Four of the newer parameters (HYPO%, %HypoHe, CHr, RetHe) similarly outperformed transferrin saturation and ferritin in hemodialysis patients54 for diagnosis of iron deficiency. However, both the CHr and RET-He are less effective than the MCH in screening elderly patients for iron-deficiency anemia.55 The RSf (square root of MCV times MRV [mean reticulocyte volume]) and LHD% (a mathematical transformation of the MCHC) have similar diagnostic utility as RET-He.56 Fragmented red cell (FRC) counts by automated analyzers, based on better methods of separating small red cells from platelets, appear to lack specificity and their clinical role is not yet defined.
These parameters have the advantage of ready access in the context of an automated blood count, but the availability of differently derived and calculated parameters from various instrument makers is a challenge to remember and compare across laboratories.
Related posts:

Stay updated, free articles. Join our Telegram channel

Full access? Get Clinical Tree


