- The prevalence of type 2 diabetes is increasing worldwide.
- Approximately 285 million people worldwide have diabetes in 2010, making it one of the most common non-communicable diseases globally.
- The largest increase is observed in regions with rapidly developing economies and urbanization.
- The aging population, with an increase in the proportion of people aged over 65 years in most countries, has contributed significantly to this increase in prevalence.
- The age of onset of diabetes is also decreasing in many countries, giving rise to an increasing proportion of young people of working age being affected by the disease.
- Several risk factors are known to be associated with increased risk of type 2 diabetes. Many of these risk factors are associated with a westernized lifestyle and increase with urbanization.
- Areas with a high ratio of impaired glucose tolerance: diabetes are at an earlier stage of the diabetes epidemic, and thus may be a particular target for preventive strategies.
- The region with the highest diabetes prevalence rate at present is in the Eastern Mediterranean and Middle East Region.
- The largest increase in diabetes prevalence is predicted to occur in India and China.
- Diabetes is associated with approximately twofold increased mortality in most populations, with the excess risk decreasing with increasing age.
- The increase in diabetes prevalence, particularly among young adults, along with the increased morbidity and mortality associated with microvascular and macrovascular complications, is likely to lead to an escalation of health care costs and loss of economic growth.
Introduction
Type 2 diabetes mellitus (T2DM) is one of the most common forms of chronic disease globally and few societies or ethnic groups are spared. It accounts for about 85% of cases of diabetes in Caucasians and virtually all in certain non-Caucasian ethnic groups. In 2010, it was estimated that 285 million people worldwide have diabetes, of whom 80% live in less developed countries and areas [1]. Among those aged 20–79 years, about 6.6% have diabetes globally [1]. The highest number of people with diabetes is in the Western Pacific Region, with 76 million, and the region with the highest prevalence rate, at 11.7%, is North America and the Carribean [1].
The number of people with diabetes is expected to reach 438 million by 2030, an increase of 54% compared to predicted figures for 2010 [1]. The largest increases will be in countries with rapidly growing economies, such as India and China. With the increasing consumption of high-energy food, increasing adoption of sedentary lifestyles and urbanization, increasing numbers of individuals develop T2DM, and the age of diagnosis is decreasing. Individuals exposed to longer periods of hyperglycemia will undoubtedly have increased risks of developing vascular complications related to diabetes. The potential health care costs and burden of diabetes in these regions will have a significant impact on the economic growth of these regions, as discussed further in Chapter 5.
The epidemiology and prevalence of diabetes is partly determined by the diagnostic criteria used to diagnose diabetes, and these have been modified on a number of occasions. The diagnostic criteria for diabetes and impaired glucose tolerance (IGT) is based on epidemiologic evidence relating microvascular complications to specific degrees of hyperglycemia, and the fasting glucose cut-off has been modified as new data emerge. These changes have major implications on the interpretations of current and future epidemiologic studies on diabetes. In 1999, the diagnostic threshold of fasting glucose was lowered from 7.8 to 7.0 mmol/L. A fasting glucose between 6.0 and <7 mmol/L was previously considered to be pre-diabetic and the term “impaired fasting glucose” (IFG) was used. Subsequent lowering of the “normal” fasting glucose level to 5.6 mmol/L further increases the number of patients with “pre-diabetes.” IGT, however, is a state of intermediate hyperglycemia that is only identified by oral glucose tolerance testing (OGTT), with a post-load glucose level of 7.8–11.1 mmol/L. It is estimated that about 344 million or 7.9% in the 20–79 age group have IGT in 2010 [1]. Abnormal glucose tolerance is frequently associated with visceral obesity, hypertension and dyslipidemia, a collection of cardiovascular risk factors known as metabolic syndrome. While these subjects are at high risk of developing diabetes and coronary artery disease, interventions with increased physical activity, reduced fat and energy intake can substantially reduce these risks by 40–60%.
Risk factors for type 2 diabetes
Several risk factors are known to be associated with increased risk of T2DM. These include increasing age, obesity (especially central obesity), dietary excess, dietary factors such as increased intake of animal fats, carbonated drinks, sedentary lifestyle, a positive family history, history of gestational diabetes, polycystic ovary syndrome, severe mental illness, presence of hypertension, hyperlipidemia or cardiometabolic risk factors (Figure 4.1) (see Chapters 11, 12 and 14). The clustering of some of these risk factors – hypertension, elevated blood glucose, elevated triglyceride, low high-density lipoprotein (HDL) cholesterol, and abdominal obesity – is termed the metabolic syndrome. Many of these risk factors are associated with a westernized lifestyle and increase with urbanization and mechanization. The recognition of the role of these factors in the pathogenesis of T2DM has led to recommendations for selective screening for T2DM in subjects with these risk factors [2].
Figure 4.1 Risk factors in the development of type 2 diabetes. HDL, high density lipoprotein cholesterol; PCOS, polycystic ovarian syndrome; TG, triglycerides.
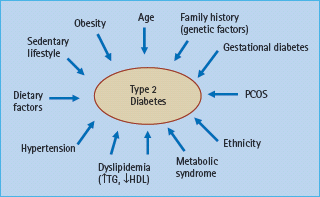
Obesity accounts for 80–85% of the overall risk of developing T2DM, and underlies the current global spread of the disease [3]. The risk of T2DM increases as body mass index (BMI) increases above 24kg/m2, although the risk appears to be present in association with lower BMI cut-offs in Asians [4,5]. While central obesity is a particularly strong factor, it can impart further risk regardless of the overall level of general obesity. This obesity-related risk is particularly marked in certain ethnic populations such as Native Americans, African-Americans, South Asians, Chinese (and other Asian populations) and Pacific Islanders [6–9], and may be related to increased visceral adiposity. Obesity, particularly central adiposity, is associated with insulin resistance, as well as β-cell dysfunction, partly through increased free fatty acids and lipotoxicity (see Chapter 14). Obesity is also associated with other metabolic abnormalities such as dyslipidemia and hypertension. Presence of the metabolic syndrome, according to the different definitions, is associated with two- to five-fold increased risk of developing diabetes in most populations [10]. Epidemiologic studies have suggested that early life events such as low birth weight and fetal malnutrition may also be associated with increased risk of diabetes and cardiovascular disease later in life [11].
Recent emerging risk factors
Decreased sleep
In addition to changes in diet and level of physical activity, it is recently recognized that short sleep duration, another facet of our modern lifestyle, may also be an important contributing factor to the increasing prevalence of T2DM. Early seminal work has highlighted the detrimental effects of sleep deprivation on glucose tolerance and insulin sensitivity [12]. Subsequent cross-sectional studies have suggested an association between short sleep duration and diabetes [13] and obesity [14]. In a prospective study of more than 70 000 women in the Nurses Health Study, short sleep duration was associated with approximately 57% increase in the risk of diabetes diagnosis over the 10-year study period [15]. Similar data were obtained from the first National Health and Nutrition Examination Survey (NHANES I), which noted that subjects who have sleep durations of 5 hours or less had a 47% increase in the incidence of diabetes over a 10-year period [16]. The exact mechanism whereby sleep restriction increases diabetes risk is not clear, although it may be related to activation of the sympathetic nervous system, decrease in cerebral glucose utilization, changes in the hypothalamic-pituitary-adrenal axis as well as other neuroendocrine dysregulation [16].
Drug-induced metabolic changes
There is increasing recognition that some commonly used medications may be associated with adverse metabolic effects and increased risk of diabetes (see Chapter 16) [17]. High dose thiazide diuretics are known to worsen insulin resistance and beta-blockers can impair insulin secretion. More recently, the use of antipsychotic agents, particularly second generation (atypical) antipsychotics, have been linked with hyperglycemia and diabetes [18]. The increasing use of highly active antiretroviral therapy (HAART) has dramatically reduced the mortality of patients with HIV infection; however, protease inhibitors and, to a lesser extent, nucleoside reverse transcriptase inhibitors, have been found to be associated with insulin resistance, deranged glucose and lipid metabolism and an increased risk for T2DM. The increasing use of such agents will likely have a significant impact on the epidemiology of diabetes in areas where HIV/AIDS is endemic such as Africa (see Chapter 50) [19].
Environmental pollutants
While most studies on the increasing burden of diabetes with westernized lifestyle have focused on changes in dietary patterns and the increasingly sedentary lifestyles, recent studies suggest environmental pollutants may represent a previously unrecognized link between urbanization and diabetes [20,21]. For example, there is strong cross-sectional association between serum concentrations of chlorinated persistent organic pollutants with diabetes [22], as well as components of the metabolic syndrome [23]. More recently, brominated flame-retardants have emerged as another class of organic pollutants that are associated with diabetes [24]. It is believed that these environmental toxins may accumulate in adipose tissue and act as endocrine disruptors, leading to dysregulation of glucose and lipid metabolism.
Low birth weight and fetal malnutrition
There is now increasing evidence to support a relationship between intra-uterine environment, fetal malnutrition and the risk of diabetes and cardiovascular disease later in life [11,25]. Maternal undernutrition, low infant birth weight, along with rapid postnatal growth, has been found to be associated with increased risk of diabetes in the offspring. This “mismatch” of a metabolic phenotype programmed during intra-uterine development and the nutritionally rich postnatal environment may be most important in regions that are undergoing rapid economic development. In addition, offspring of obese women or women with diabetes have an increased risk of diabetes and cardiometabolic abnormalities [26,27]. With increasing numbers of women with young-onset diabetes, this is likely to exacerbate further the epidemic of diabetes by setting up a vicious cycle of “diabetes begetting diabetes” [1,11,28].
Despite the increasing recognition of these novel risk factors, the main risk factors associated with diabetes remain the traditional ones of increasing age, adiposity, physical inactivity, dietary factors, positive family history and presence of other cardiometabolic risk factors, as outlined in Figure 4.1.
Methodologic issues in the epidemiology of type 2 diabetes
In comparing epidemiologic data in T2DM, one must be aware of the importance of the study methodology. Survey methods must be robust, to allow comparison and standardization. A large, truly random sample of a community, with a good response rate, is best; workplace samples may demonstrate “healthy worker” effects, while selective samples (e.g. volunteers, or subjects with another disease) are the least useful because of inbuilt recruitment bias. The age distribution of sample populations is crucial in studying T2DM, whose prevalence rises with age; study populations must be age-stratified and any comparisons age-adjusted, either within the data set, or standardized against a reference population. Finally, ascertainment methods are important – for example, whether subjects undergo an OGTT, with or without preliminary blood glucose screening.
Studies conducted in different regions of the world have highlighted an increase in the prevalence of T2DM. While few would argue that this translates into increasing burden associated with diabetes, it is important to recognize the factors that have contributed to this increased prevalence. Several factors directly affect the prevalence of diabetes, and may partly account for the increasing prevalence (Figure 4.2):
Figure 4.2 Diabetes epidemiologic model. Factors directly affecting the prevalence of diabetes included in the present analysis. Adapted from Colagiuri et al. [29] with permission from Springer Science and Business Media.
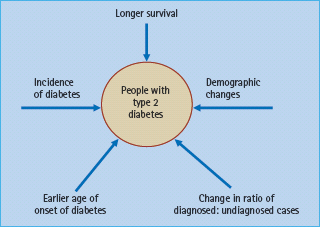
The different factors may have different contributions depending on the population being studied, although most if not all are of some importance in most populations.
Effects of changes in the definition of diabetes
While it has long been established that diabetes is a condition associated with elevated levels of glucose in the bloodstream, there was no widespread accepted definition of the syndrome until the 1980s, when the World Health Organization (WHO) Expert Committee on diabetes mellitus defined the diabetic state as a state of chronic hyperglycemia that may result from many environmental and genetic factors, often acting together [30]. The precise degree of hyperglycemia that defines diabetes has evolved with time, and relies on epidemiologic studies regarding the distribution of glucose levels within various populations.
There are several consequences of the changes in the definition of diabetes with time on the epidemiology of the condition. First, with the American Diabetes Association (ADA) and WHO classification of 1999, the threshold of fasting glucose diagnostic of diabetes was lowered from 7.8 to 7.0 mmol/L, thereby increasing the number of individuals in any given population that fulfills a diagnosis of diabetes. Furthermore, it is important to appreciate that in any epidemiologic survey, whether the diagnosis was based on elevated fasting glucose or post-load values during an OGTT. While the lower fasting glucose values was chosen to resemble more closely the diagnostic significance of the 2-hour post-load concentration, numerous studies have demonstrated that the fasting glucose criteria and post-load criteria identify slightly different subjects in most populations [31–33], and the use of fasting glucose alone will reduce the overall prevalence of diabetes compared with that identified by 2-hour post-load glucose criteria [34]. Furthermore, there is an increasing number of epidemiologic studies that utilize measurement of HbA1c as an indicator of dysglycemia [35]. Although HbA1c is not at present considered a suitable diagnostic test for diabetes or intermediate hyperglycemia, this is under active discussion [36].
The WHO recommendations for the diagnostic criteria for diabetes and intermediate hyperglycemia is summarized in Table 4.1 (see Chapter 2). While the lower threshold for diagnosing IFG in the recommendation by the ADA will result in a larger number of subjects diagnosed to have intermediate hyperglycemia than the WHO recommendation, increased diagnostic activity (e.g. through use of the OGTT) will lead to an increasing ratio of diagnosed : undiagnosed diabetes, and may impact on the prevalence rate reported in epidemiology studies.
Table 4.1 Comparison of the 2006 WHO recommendations for the diagnostic criteria for diabetes and intermediate hyperglycemia.
| WHO (2006) | ADA (2003) | |
| Diabetes | ||
| Fasting plasma glucose | ≥7.0 mmol/L (126 mg/dL) | ≥7.0 mmol/L (126 mg/dL) |
| or | ||
| 2-h plasma glucose* or random plasma glucose | ≥11.1 mmol/L (200 mg/dL) | |
| Impaired glucose tolerance | ||
| Fasting plasma glucose | <7.0 mmol/L (126 mg/dL) | |
| and | ||
| 2-h plasma glucose* | ≥7.8 and <11.1 mmol/L (140 mg/dL and 200 mg/dL) | |
| Impaired fasting glucose | ||
| Fasting plasma glucose | 6.1–6.9 mmol/L (110–125 mg/dL) | |
| and (if measured) | ||
| 2-h plasma glucose* | <7.8 mmol/L (140 mg/dL) |
* Venous plasma glucose 2-h after ingestion of 75g oral glucose load.
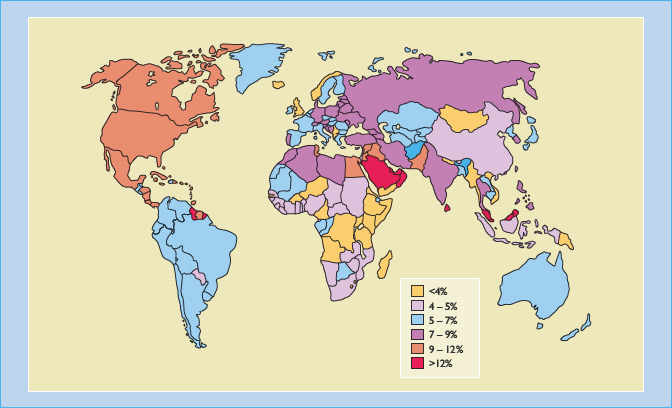
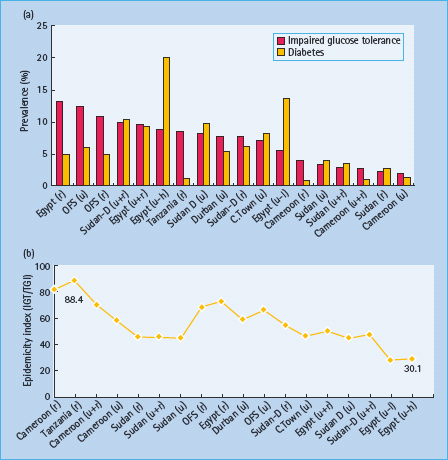
In a comprehensive report on the global prevalence of diabetes [37], it was noted that the most important demographic change to diabetes prevalence across the world was the increase in proportion of people over 65 years of age. Another major factor that has impacted on the prevalence of diabetes is the increasing age-specific prevalence of diabetes, especially in the younger age groups [37]. This suggests an earlier age of onset of diabetes, which may be of particular importance in low and middle income countries. It is also worthwhile noting the tendency for the prevalence rates of IGT to decline as that of diabetes rises, perhaps suggesting that areas with a high ratio of IGT : diabetes are at an earlier stage of the diabetes epidemic and thus may be a particular target for preventative strategies. Changes and variations in the ratio of IGT:diabetes prevalence – the so-called “epidemicity index,” may provide a useful marker for the scale of the epidemic in that particular region, as illustrated in Figure 4.3 [38].
Figure 4.3 Global prevalence estimates of diabetes (20–79 years), 2010. Adapted from International Diabetes Federation [1].
Regional and ethnic patterns of type 2 diabetes worldwide
This section considers the geographic distribution and secular changes in the prevalence of T2DM and intermediate hyperglycemia in the major regions of the world. Whenever possible, the most comprehensive and up-to-date source of data is the Diabetes Atlas produced by the International Diabetes Federation [1]. In addition, a review by Wild et al. [37] utilized age- and sex-specific estimates for diabetes prevalence from available epidemiologic surveys to extrapolate prevalence in related countries using a combination of criteria including geographic proximity, ethnic and socioeconomic similarities.
Current estimates of the total number of people with diabetes in each region of the world and in those countries with the highest overall numbers are shown in Figure 4.4. A list of countries with the highest prevalence and projected prevalence is listed in Table 4.2, and a list of countries with the most number of people with diabetes in Table 4.3.
Table 4.2 Prevalence of diabetes (20–79 age group) in 2010 and 2030. Data from International Diabetes Federation, 2009 [1].
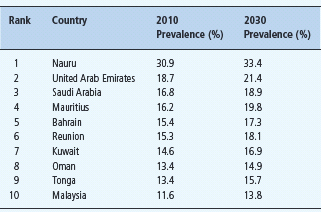
Table 4.3 Estimated numbers of people with diabetes in 2010 and 2030 in the 20–79 year age group. Data from International Diabetes Federation, 2009 [1].
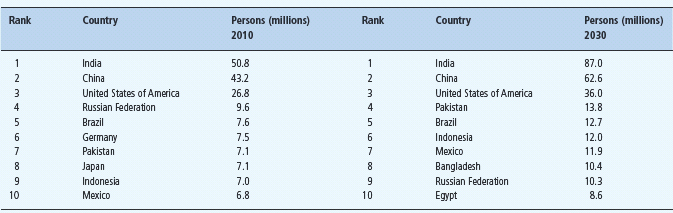
Figure 4.4 Relationship between impaired glucose tolerance (IGT) prevalence and diabetes prevalence and the relationship to the Epidemicity Index. h, high socioeconomic status; l, low socioeconomic status; r, rural; u, urban; Sudan-D, Dangla tribe; OFS, South Africa Free State. Adapted from Dowse et al. [38].
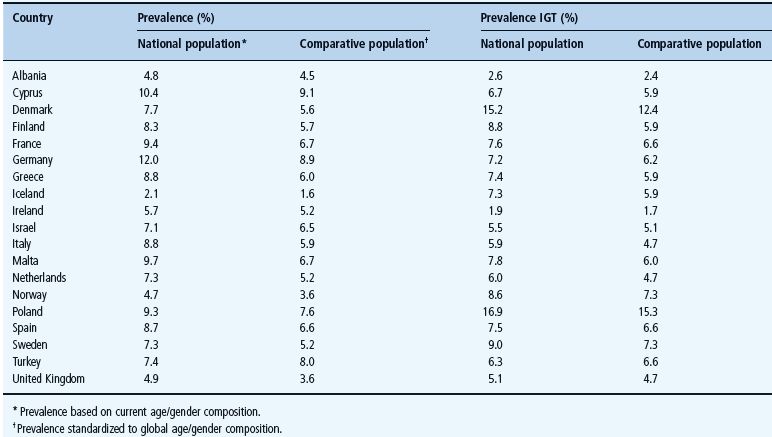
* Prevalence based on current age/gender composition.
1 Prevalence standardized to global age/gender composition.
Africa
T2DM in the African continent provides contrasting pictures between regions that are more urbanized and the more rural areas. While poverty and malnutrition is still a major problem affecting sub-Saharan Africa, a region where diabetes is comparatively rare, urbanized areas such as North Africa are reporting increasing prevalence rates [39]. It has been estimated that, overall, 3.8% of the adult population in the African region in 2010 are currently affected by diabetes, which is projected to increase to 4.7% by 2030 [1]. Other important epidemiologic issues in the region include a low incidence of type 1 diabetes (T1DM), which is complicated by the occurrence of atypical “ketosis-prone” diabetes, an atypical presentation of diabetes characterized by an initial clinical presentation of apparent T1DM with severe hyper-glycemia and ketosis, and subsequent long-term remission with a clinical course more compatible with T2DM [40]. In addition, there is also a form of early onset diabetes termed malnutrition-related diabetes mellitus (MRDM) that is associated with past or present malnutrition and sometimes accompanied by pancreatic calcification [19]. Although infective diseases such as HIV infection and tuberculosis are currently the main causes of mortality in sub-Saharan Africa, the increasing prevalence of diabetes and other non-communicable diseases is likely eventually to overtake infections as major causes of mortality. In sub-Saharan Africa, only a small proportion of the population at present reaches ages at which T2DM becomes a major health problem. While greater access to HAART has lead to markedly reduced mortality, the improvement in life expectancy, coupled with the adverse metabolic effects of HAART, are likely to contribute to further increases in the prevalence of T2DM within the region [19,41].
North Africa
Prevalence rates are relatively high (4.2–9.3%) in Sudan and Tunisia as well as Egypt. The Egyptian study, of adults aged over 20 years, also showed an IGT prevalence rate of 10% [42]. Interesting urban–rural differences were also demonstrated; in Cairo city, diabetes was more common (prevalence 14–20%, depending upon socioeconomic status), while the IGT prevalence was lower (6–9%). The converse applied in a rural setting, with a diabetes prevalence of only 5% but a higher IGT prevalence of 13%. This may reflect the diabetes epidemic being at an earlier stage in rural populations (Figure 4.4). In the recent Tunisian National Nutrition Survey, prevalence of diabetes was 9.9%, giving age-adjusted prevalence of 8.5%, with marked urban–rural differences [43].
Sub-Saharan Africa
There is a paucity of prevalence data from sub-Saharan Africa, with most of the prevalence data derived from studies in Ghana, Cameron, Nigeria, Tanzania and South Africa [39]. In a recent systematic review of prevalence data from Ghanaians and Nigerians, diabetes was rare at 0.2% in urban Ghana in 1963 and 1.65% in urban Nigeria in 1985. The prevalence of diabetes had risen to 6.8% in Nigeria in 2000 (for adults aged ≥40 years) and 6.3% in Ghana in 1998 (for adults aged ≥25 years) [44,45]. In Cameroon (West Africa), adults aged 24–74 years had an overall diabetes prevalence of 1.1%, with an IGT rate of 2.7%. Prevalence rates in the capital of Cameroon (Yaounde) were 1.3% for diabetes and 1.8% for IGT, compared with rural prevalences of 0.8% for diabetes and 3.9% for IGT [46]. Undiagnosed cases accounted for the majority of cases in these studies, again reflecting a region at the early stages of a looming diabetes epidemic.
In South Africa, both diabetes and IGT are more common in both urban and rural communities. In Cape Town, age-adjusted prevalences were 8% for diabetes and 7% for IGT [47]. A recent study conducted in a rural South African community based on a 75-g OGTT and the 1998 WHO criteria reported an overall age-adjusted prevalence of diabetes of 3.9%, IGT 4.8% and IFG 1.5%. Notably, 85% of the cases with diabetes were uncovered by the survey [48].
In addition to exposure to urban environment, other factors that determine the risk of T2DM in African populations include positive family history, ethnic origin, central adiposity and physical inactivity [39]. Possible ethnic differences have been examined in several studies. In both Tanzania and South Africa, migrant Asians have higher diabetes prevalence rates than indigenous Africans [49] but this could reflect lifestyle differences. In Tanzania the difference was particularly marked (1.1% in Africans vs 9.1% in Asians), which again emphasizes the low prevalence in urban East Africans.
The emerging epidemic of T2DM is further compounded by the various problems hampering the delivery of effective diabetes care within this region. This has resulted in poor glycemic control among most patients, as well as a high frequency of chronic microvascular complications. Better access to health care and treatment, improvement in infrastructure to support services and health care information systems as well as primary prevention measures are urgently needed in order to reduce the burden of acute and chronic complications of diabetes in the region [19,39,41].
The Americas
North America (USA and Canada)
Diabetes and its complications are common and a significant cause of morbidity in North America. The NHANES study reported a crude prevalence of total diabetes in 1999–2002 as 9.3%, consisting of 6.5% diagnosed and 2.8% undiagnosed [50]. This was significantly increased compared with a crude prevalence of total diabetes in 1988–1994 of 5.1%, mainly because of an increase in diagnosed diabetes. There was marked variation in prevalence in different ethnic groups, with age- and sex-standardized prevalence of diagnosed diabetes approximately twice as high in non-Latino African-Americans (11%) and Mexican-Americans (10.4%) compared with White people of Northern European ancestry (5.2%). The prevalence of diabetes among the elderly of these minority groups was particularly high, exceeding 30% [50].
The high prevalence rates in US Latino people and African-Americans is well documented. In 1991, the age-adjusted prevalence of diabetes was 6% in White people, 9% in Cubans, 10% in African-Americans, 13% in Mexican-Americans and 13% in Puerto Ricans [51]. Rates have risen in all groups, but these differences appear to persist. Between 1987 and 1996, the 7- to 8-year incidence of T2DM approximately tripled in both Mexican-Americans and White people of Northern European ancestry, although the absolute rate was twice as high in the Mexican-Americans [52]. T2DM is also significantly more common among older Puerto Ricans (38%) and Dominicans (35%) than among White people of Northern European ancestry (23%) [53]. Economic disadvantage may explain much of the excess prevalence of T2DM among African-American women [54].
Other populations in the USA that are particularly at risk of T2DM are the Native American Indian communities, notably the Pima Indians, of whom 50% have diabetes [55]. Reports have highlighted the developing epidemic of T2DM in Native American Indian youth [56]. Among 15- to 19-year-olds, diabetes now affects 5.1% of Pima Indians (a sixfold increase in prevalence over the last 20 years) and 0.2% for Canadian Cree and Ojibway Indians. The overall prevalence among all US Native American Indians of this age is 0.5%. This epidemic of T2DM in young Native American Indians is supported by secular trends in the incidence rate of T2DM over the past 40 years in Pima Indians, which showed a more than fivefold increase in incidence rates among Pima Indians aged 5–14 years [57].
A similar situation was seen in Canada, where aboriginal peoples living in Canada had more than twofold increase in prevalence compared with the non-aboriginal population [58]. Other minority groups are also not spared. Among native Hawaiians (Polynesians), the crude (i.e. not age-adjusted) prevalence rates of T2DM and IGT were reported in 1998 to be 20% and 16%, respectively. The age-adjusted rate for T2DM was four times higher than among the US NHANES II study population [59]. In 1991, second-generation Japanese-Americans had prevalence rates of 16% (diabetes) and 40% (IGT) [60], and incidence rates remain high at 17.2 per 1000 person-years [61]. This is believed to be a result of the increase in visceral adiposity in a population predisposed to impaired β-cell function [62]. Other Asian populations living in the USA that are particularly prone to diabetes include Chinese-Americans, in whom linguistic barriers may be a particularly relevant barrier to diabetes education and effective care delivery [63].
It has been estimated that the number of Americans with diagnosed diabetes will rise from 11 million in 2000 (overall prevalence, 4.0%) to 29 million in 2050 (prevalence 7.2%). The fastest growth is expected to be among African-Americans. The projected increase of 18 million is accounted for by approximately similar contributions from changes in demographic composition, population growth and secular rises in prevalence rates [64]. In 2010, it is estimated that 26.8 million people in the USA have diabetes, of which 5.7 million is undiagnosed. The direct and indirect medical costs attributed to diabetes in the USA in 2007 was $174 million [65].
An increasing number of younger people will be affected. In the SEARCH for Diabetes in Youth Study, a multi-ethnic population-based study, the incidence of diabetes was 24.3 per 100 000 person-years. The incidence rates of T2DM was highest among Native American Indians and African-American adolescents, with incidence rates of 17–49.4 per 100 000 person-years, compared with 5.6 per 100 000 person-years in White people of Northern European ancestry [66].
Central and South America
Data from these regions are scarce. In the Mapuche native people from rural Chile, the prevalence of T2DM estimated in 2001 was 3% in men and 5% in women [67]. This represents a substantial rise above the very low prevalence (<1%) reported in 1985 [68]. Diabetes is clearly much more common in urban communities, for example 14% in Mexico City in 1994 [69], compared with 5–10% prevalence nationwide [70]. Surveys in Brazil and Colombia in the early 1990s indicated age-adjusted prevalence rates of approximately 7% [71,72]. A high prevalence of abdominal obesity was noted in these populations, affecting more than 80% of women [70].
Caribbean
Studies from Jamaica exemplify the secular trend in the West Indies. Rates in the 1960s (underestimated because of the screening procedure used [73]) were low but rose in the 1970s to 4% in those aged 44 and 8–10% in those aged 45–64 years [74,75], and to an overall rate of 7.4% in 1996 [76]. The most recent report, which dates from 1999, indicates prevalence rates of 16% in women and 10% in men (13% overall). As elsewhere, this exceeds the rate of rise among European-origin populations and parallels the spread of obesity [77].
Europe
This region contains a diverse mix of countries that have marked differences in affluence, and includes some of the most developed countries in the world. Nevertheless, updated nationwide survey data are only available in some of the countries. In the recent Diabetes Atlas, less than half of the 54 European countries and territories in the European region had recently published data on national prevalence of diabetes, which ranged from 2.1% in Iceland to 12% in Germany (Table 4.4).
Table 4.4 National estimates of diabetes and IGT prevalence in Europe in 2010. Data from International Diabetes Federation, 2009 [1].
UK
T2DM imposes particular burdens in inner cities with multiethnic populations, as those originating from the Indian subcontinent have a high prevalence of the disease. In typical studies [78,79], the age-adjusted prevalence rates were 3% and 5% in Caucasian males and females, respectively, compared with 12% and 11% in their Asian counterparts in the UK. Asians also show a higher prevalence of IGT, a male preponderance, a younger age at diagnosis and a lower proportion of undiagnosed diabetes [79].
Poverty and social deprivation apparently contribute to the increasing prevalence of T2DM among inner-city residents. This was manifest in all ethnic groups in inner-city Manchester, including a surprisingly high age-standardized prevalence rate of 20% among White people) [80]. Social deprivation, obesity, physical inactivity and smoking tend to co-segregate, which may explain this phenomenon. The importance of dietary factors was highlighted by two recent studies, which demonstrated association between high dietary energy density or unhealthy dietary patterns characterized by high intake of soft drinks, sugar-sweetened beverages, burgers, sausages and snacks with incident T2DM [81,82]. In the Ely study, a population-based longitudinal study, the 10-year cumulative incidence of diabetes was 7.3 per 1000 person-years [83].
Scandinavia
In Scandinavia, the more homogenous population may indicate more accurately the true prevalence of T2DM among white Caucasians. A survey in Northern Sweden revealed a prevalence of diabetes of 8.1% [84]. Similar data were obtained in a recent study in Finland, with age-standardized prevalence of diabetes in 45- to 64-year-olds being 10.2% for men and 7.4% for women [85]. Lower prevalence data were noted for Iceland [86].
In the early 1990s, T2DM was rare in Northern Finland but the prevalence of IGT was 29% in men and 27% in women [87], comparable with that in a homogeneous white Caucasian female Swedish population aged 55–57 years (28%) [88]. In Denmark, around 15% of the population have IGT [89]. The high prevalence of IGT in Finland prompted the Finnish Diabetes Prevention Study [90], which examined whether lifestyle changes could prevent the development of T2DM. Strikingly, nutritional advice and increased physical activity were shown to reduce the risk of developing diabetes by 58% in subjects with IGT, and the effect was sustained over subsequent follow-up [90]. A more recent study in three regions in Finland noted prevalence of IGT of 10.5% in men and 9.2% in women, which was substantially lower then the previous reported figures from Northern Finland. It is unclear whether this difference is a result of regional differences or changes in the diabetes : IGT ratio [85].
Using a register of patients with diabetes, it was calculated that the incidence rate of diabetes in Denmark was 1.8 per 100 000 at age 40 years and 10 per 100 000 at age 70. The incidence rate increased 5% per year before 2004 but then stabilized. The lifetime risk of diabetes was estimated at 30% [91]. A recent study in Finland noted an alarming increase in the incidence of T2DM among young adults, with age-adjusted incidence of T2DM among 15- to 39-year-olds being 11.8 per 100 000/year. The incidence rate increased by 7.9% per year. Interestingly, despite having the highest incidence of childhood T1DM in the world, the incidence of T2DM among young adults in Finland is approaching that of T1DM among the 15–39 year age group (age-adjusted incidence of T1DM 15.9 per 100 000/year) [92].
Continental Europe
A population-based survey in Verona, Italy, revealed an overall prevalence of T2DM of 2.5% which increased significantly after the age of 35 years [93]. In northern Italy, the age-adjusted prevalence of T2DM was 9% in males and 8% in females over the age of 44 years [94]. In a study that compared the prevalence of diabetes in Casale Monferrato in northwest Italy in 1988 and 2000, it was noted that the age- and sex-adjusted prevalence of diabetes had increased from 2.13% in 1988 to 3.1% in 2000, with higher age-specific prevalence rates of diabetes in every age group in the later survey, including a twofold increase in the risk for those aged ≥ 80 years [95].
In France, the MONICA study estimated the adjusted prevalence of T2DM to be 7% in men and 5% in women aged 35–65 years, and the adjusted prevalence of IFG as 12% in men and 5% in women [96]. The prevalence of diabetes increases to 19% in males and 9% in females aged over 60 years [97].
In the Netherlands, T2DM affects 8% of elderly Caucasians [98]; 65% of those with IFG and post-load glucose levels went on to develop diabetes within 6 years [99]. In a prospective population-based study between 1998 and 2000, age- and sex-adjusted prevalence of diagnosed diabetes was 2.2% at baseline and 2.9% after 2 years of follow-up, with elderly patients aged 70 or over accounting for 50% of the T2DM population [100].
In Greece, the prevalence of diabetes increased from 2.4% in 1974 to 3.1% in 1990 [101], and aging and obesity were associated with both T2DM and IGT [102,103]. Prevalence of T2DM was 7.6% in men and 5.9% in women in a survey conducted in 2001–2002 [104]. In a follow-up study of those free of cardiovascular disease at baseline, the incidence rate of diabetes within a 5-year period was 5.5% [105]. In Turkey, the overall prevalence rates of T2DM and IGT were 6% and 9%, respectively. Low levels of occupational activity, family history and obesity were all associated risk factors [106,107]. Adherence to a Mediterranean diet may also have protective effects against diabetes [108].
Prevalence data from Eastern Europe are comparatively sparse. The age-adjusted prevalence of T2DM for men and women in Fergana, Uzbekistan, is estimated to be 8% in both urban men and women, with IGT affecting 5% of men and 6% of women. Lower prevalence rates for both T2DM and IGT are reported for semi-rural inhabitants [109]. A survey in the rural area in the Sirdaria province of Uzbekistan confirmed similar age-adjusted prevalence rates of diabetes for men (10%) and women (7.5%); however, prevalence rates of IGT in Sirdaria women (14%) and in men (11%) were higher than for semi-urban or urban inhabitants in Fergana [110]. In Russia, the estimated prevalences were 6% in males and 7% in females for diabetes, and 6% and 13%, respectively, for IGT; clustering of hyperlipidemia, obesity, hypertension and low 10-year survival were observed among subjects with diabetes [111]. A survey conducted in Moscow reported low incidence of reported diagnosis of diabetes (2%) [112], which was supported by another study based on self-reported doctor diagnosis [113]. In addition to underdiagnosis, undertreatment and infrequent insulin use are also likely to contribute to the burden of morbidity [113]. Much of the estimated prevalence data in other Eastern European countries have been extrapolated from data from Poland, where prevalence of T2DM increased from 3.7% to 10.8% between 1986 and 2000, with a similar increase in prevalence of IGT from 2.9% to 14.5% during this period [114].
Asia
India
India is the second most populous country in the world, but currently has the highest number of people with diabetes, with an estimated 40.9 million affected in 2007, a figure that is set to rise to 69.9 million by 2025 [115]. Sequential surveys from India indicate that the prevalence of diabetes has risen steadily since the 1970s [116–119], although methodologic differences hamper comparisons between these studies.
The National Urban Diabetes Survey, carried out in six cities in 2001, found age-standardized prevalence rates of 12% for diabetes (with a slight male preponderance) and 14% for IGT; subjects under 40 years of age had a prevalence of 5% (diabetes) and 13% (IGT) [119]. Diabetes was positively and independently associated with increasing age, BMI and waist : hip ratio, and also with a family history of diabetes, a higher monthly income and physical inactivity. IGT showed associations with age, BMI and family history of diabetes. Subsequent studies showed increasing prevalence, with prevalence rates of 14.3% reported in the Chennai Urban Rural Epidemiology Study (CURES-17) [120], and 18.6% in the city of Chennai in the most recent study [121]. In addition to the increasing prevalence of diabetes, there appears to be a decreasing prevalence of IGT (120). Another secular trend is the shift towards younger onset of diabetes, especially in urban areas, where up to 36% of those with diabetes are aged 44 years or less [120,121].
Urban–rural differences in the prevalence of diabetes have been consistently reported by different studies in India. A study from Chennai noted a progressive increase in prevalence rate with increasing urbanization; 2.4% in rural areas, 5.9% in semi-urban areas and up to 11.6% in urban areas [118,122]. Likewise, the most recent data revealed a prevalence of 18.6% in the city of Chennai compared with 16.4% in a town and 9.2% in peri-urban villages [121]. In a study carried out in 77 centers in India (40 urban and 37 rural), the standardized prevalence rate for diabetes in the total Indian, urban and rural, populations was 4.3, 5.9 and 2.7%, respectively. While the prevalence rates of diabetes and IGT are significantly higher in urban compared with rural areas, it appears that the rural–urban gradient is becoming increasingly attenuated [123].
The Chennai Population Study (CUPS) has recently revealed alarming rates of incident diabetes, which occurred at a rate of 20.2 cases per 1000 person-years [124]. Identification of high-risk subjects and increasing the awareness of the population is much needed. A risk score specific for Indian population, the Indian Diabetes Risk Score has been developed. It utilizes four clinical variables (age, family history, regular exercise and waist circumference) and a score of >21 is able to identify subjects with diabetes with a sensitivity and specificity of close to 60% [125]. This will help identify high-risk subjects for early intervention, because lifestyle modification has been shown to be effective in reducing progression from IGT to diabetes in the Indian population [126]. Recently, the pilot phase of a National Program on Diabetes, Cardiovascular Diseases and Stroke (NPCDS) has been launched in seven states in January 2008. It is hoped that this will help coordinate the multisectoral effort that is urgently needed in order to address the epidemic of obesity and diabetes in India [127].
Pakistan, Bangladesh and Sri Lanka
The situation in these countries largely mirrors that in India. Diabetes is particularly common (16% of men, 12% of women) in the rural Sindh Province in Northern Pakistan [128]. A more recent study from Pakistan indicates similar prevalence rates of 10–11% in urban and rural males and urban women, although lower rates were seen in rural females (5%); however, IGT rates in females were twice those in males [129]. Combining data from the four provinces of Pakistan, the prevalence of diabetes in the urban areas was 6.0% and 3.5% in women, with a total of 22% of the urban population estimated to have some degree of glucose intolerance [130]. Using data from the National Diabetes Survey, the WHO has estimated a marked increase in T2DM in Pakistan from 4.3 million in 1995 to 14.5 million in 2025 [37]. In rural Bangladesh, diabetes prevalence is 2.1% compared with an IGT prevalence of 13% despite the mean BMI being only 20.4 kg/m2 [131].
In addition to urbanization, the main factor for the high prevalence of diabetes and metabolic abnormalities among Asians is the tendency to central obesity and insulin resistance [5,118,132–134]. Despite being born smaller, with lower birth weight, Indian babies have more body fat, which persists into adulthood, thus putting them at increased risk of cardiometabolic complications [135]. Interestingly, a recent study showed maternal nutrition, and in particular, low maternal vitamin B12 and high folate might be associated with increased adiposity and risk of T2DM in the offspring [136], suggesting that in addition to increased intake of fat and calorie-rich foodstuffs, other dietary factors may also have a contributory role.
Mauritius
The high prevalences of diabetes and cardiovascular disease on the island of Mauritius, in the India Ocean, have been intensively studied. Here, diabetes is common in an urbanized setting, across several ethnic groups (Asian Indian, Chinese and Creole); prevalence rates are 10–13% among the different ethnic groups, rising to 20–30% in those aged 45–74 years [137]. A repeat survey in 1998 revealed a rise in prevalence of T2DM to 17.9%. In both studies, the highest prevalence was seen in the Asian Indians [137,138].
The Middle East
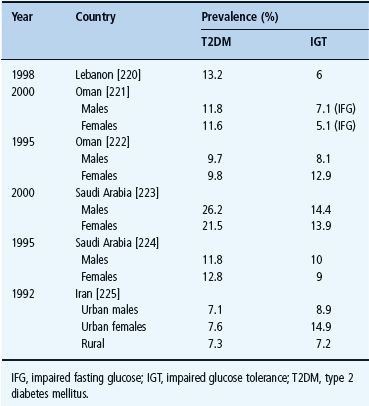
Marked socioeconomic changes in many countries in the region, especially among the affluent oil-producing countries, has led to dramatic changes in lifestyle with changes in nutritional intake, decreased physical activity, increased obesity and smoking. This, coupled with increasing urbanization and improved life expectancy, has led to a marked increase in the prevalence of diabetes and IGT (Table 4.5). Compared with European patients, immigrants from the Middle East were noted to have an earlier onset of disease, more rapid decline in islet β-cell function, and have a stronger family history [139]. In terms of prevalence rate, the United Arab Emirates, Saudi Arabia, Bahrain, Kuwait, Oman and Egypt all feature among the top 10 countries with the highest prevalence rate of diabetes [115], highlighting this region as one that requires concerted public health action in order to reduce the potential impact of diabetes [140].
Table 4.5 Prevalences of diabetes in selected countries from the Middle East.
Related posts:

Stay updated, free articles. Join our Telegram channel

Full access? Get Clinical Tree


