- Diabetic nephropathy is characterized by gradually increasing urine albumin excretion (UAE) over many years, accompanied by slowly rising blood pressure (BP); the decline in glomerular filtration rate (GFR) occurs late.
- Individuals with nephropathy are at greatly increased risk of other microvascular and macrovascular complications of diabetes.
- The risk of cardiovascular disease increases as UAE increases and as GFR decreases.
- Approximately 30–50% of Caucasian people with diabetes will develop microalbuminuria; the prevalence is higher in non-Caucasians.
- One-third of people with diabetes will progress to proteinuria and be at high risk of end-stage renal disease (ESRD).
- Factors most closely associated with progression of nephropathy are poor glucose and BP control, and baseline UAE.
- Screening for diabetic nephropathy should be performed annually, by measuring urine albumin: creatinine ratio and estimated GFR (eGFR).
- Good blood glucose and BP control are key to prevention of nephropathy.
- If UAE is raised, an inhibitor of the renin angiotensin system should be commenced and titrated up to the maximum tolerated dose.
- Maintaining BP <125/75mmHg will reduce the rate of decline of GFR from 10–12 to 3–5mL/min/1.73m2.
- Reducing dietary protein intake to 0.7—1.0g/kg body weight per day may slow the deterioration in renal function.
- Aggressive management of other cardiovascular risk factors and prescription of aspirin reduces the incidence of cardiovascular events and of progression to nephropathy by around 60%.
- Renal failure from diabetes is the most common single cause of entry to renal replacement programs worldwide; the majority of patients have type 2 diabetes plus major co-morbidities.
- Patients with ESRD and significant co-morbidities should be offered dialysis. Fitter patients benefit from kidney or kidney–pancreas transplantation, but need full cardiovascular assessment and treatment before transplantation if necessary.
Introduction
Diabetic nephropathy remains an important common complication of diabetes. End-stage renal disease (ESRD) is devastating to the individual and of enormous financial and social consequences to society. In 2006, the proportion of individuals with diabetes beginning renal replacement therapy (RRT) was 20–44% in most countries reporting to the US Renal Disease Registry [1]. The number of people with diabetes requiring RRT in the USA increased 50% between 1996 and 2006. The increasing numbers are accounted for primarily by individuals with type 2 diabetes mellitus (T2DM), often with severe co-morbidities [2]. A European report covering 1998–2002 demonstrated a 9.9% per year increase in the numbers of Europid patients with T2DM beginning RRT, with no change in non-Europid populations [3]. ESRD caused by T2DM currently is uncommon before age 45 years, although the annual increase in patients with diabetes beginning RRT may be greatest in this age group [4]. The numbers of patients with type 1 diabetes mellitus (T1DM) entering RRT has not changed dramatically over the same time [2,3].
Definitions
Classic diabetic nephropathy is a chronic condition developing over many years, characterized by gradually increasing urinary albumin excretion (UAE) and blood pressure (BP). Declining glomerular filtration rate (GFR) is a relatively late event. As nephropathy progresses, the risk of other chronic complications of diabetes increases, so that if other complications of diabetes are absent, an alternative cause of the renal disease should be considered. In particular, the risk of cardiovascular disease (CVD) increases dramatically as renal disease progresses.
Kidney disease is staged on the basis of both the level of UAE and GFR. In diabetic nephropathy, UAE increases gradually from normal, through microalbuminuria to proteinuria. Consensus definitions of normal UAE, microalbuminuria and proteinuria are given in Table 37.1.
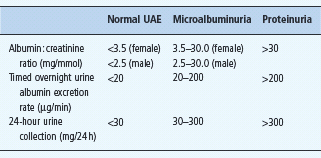
Serum creatinine is a relatively poor reflection of GFR, but more precise direct measures of GFR are inappropriate in routine clinical practice. Calculation of an “estimated” GFR (eGFR) is now recommended, using the four variable Modification of Diet in Renal Disease study equations [5]. The agreed staging of chronic kidney disease (CKD) on the basis of the eGFR and UAE is shown in Table 37.2.
Table 37.2 Staging of chronic kidney disease on the basis of estimated glomerular filtration rate (eGFR) and urine albumin excretion (UAE).
| Stage | eGFR description | UAE |
| Normal | GFR >90 mL/min/1.73 m2 | Normal |
| 1 | GFR >90 mL/min/1.73 m2 with other evidence of kidney disease* | Normal / micro /proteinuria |
| 2 | Mild impairment; GFR 60–90 mL/min/1.73 m2 with other evidence of kidney disease* | Normal / micro /proteinuria |
| 3a | Moderate impairment; GFR 45–59 mL/min/1.73 m2 | Normal / micro /proteinuria |
| 3b | Moderate impairment; GFR 30–44 mL/min/1.73 m2 | Normal / micro /proteinuria |
| 4 | Severe impairment; GFR 15–29 mL/min/1.73 m2 | Normal / micro /proteinuria |
| 5 | Established renal failure; GFR <15 mL/min/1.73 m2 or on dialysis | Normal / micro /proteinuria |
*Other evidence of kidney disease may be: microalbuminuria, persistent proteinuria, persistent hematuria after exclusion of all other causes, structural abnormalities of the kidney demonstrated on ultrasound, or biopsy-proven glomerular nephritis.
Natural history
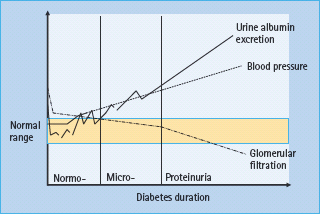
The development of diabetic nephropathy generally takes at least 20 years. Gradually increasing UAE is the hallmark (Figure 37.1).
Figure 37.1 Development of diabetic nephropathy. Micro-, microalbuminuria; Normo-, normal urine albumin excretion.
Type 1 diabetes
During the acute presentation of T1DM, UAE and GFR may both be increased above normal. With insulin therapy, UAE returns to normal in most if not all individuals. GFR also returns to normal in the majority, but remains above normal in 25–40%. The implications of this have long been debated. A recent meta-analysis of 10 cohort studies concluded that individuals with persistently elevated GFR were at increased risk of progression to diabetic nephropathy [6].
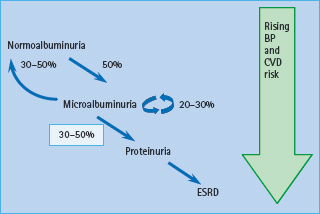
In those patients who will never develop nephropathy, UAE remains normal, except during periods of particularly poor glucose control, or during acute intercurrent illness, when a transient increase in UAE may occur. In those who will develop diabetic nephropathy, UAE increases gradually, with microalbuminuria usually appearing within 5–15 years of diabetes. Untreated, the mean increase in UAE is 20% per year. Patients may go through a phase of “transient microalbuminuria” as they approach the cut-off, when sequential samples may vary from normal to microalbuminuria, but eventually they become persistently microalbuminuric. In patients with normal UAE, approximately 1.5–2.5% per year develop microalbuminuria [7,8]. and 50% develop persistent microalbuminuria at some point in their life [9–11]. One recent study reported an estimated cumulative incidence of microalbuminuria of 25.4% after 40 years of diabetes, suggesting that the incidence of microalbuminuria may be falling [12]. Approximately one-third of patients with T1DM microalbuminuria will progress gradually over a further 5–15 years to proteinuria, one-third will remain microalbuminuric and one-third will revert to normal UAE (Figure 37.2) [13–15]. In the short term, reversion from microalbuminuria to normal UAE may be even more common, one study reporting regression in 58% of patients over 6 years [16]. Short-duration microalbuminuria, and lower HbA1c, systolic BP, total cholesterol and triglycerides were all independently associated with regression. The eventual outcome in those who regress, or who do not initially progress, remains unclear; however, they probably remain at increased risk of nephropathy compared to individuals who have never had microalbuminuria.
Figure 37.2 Progression of albuminuria in type 1 diabetes mellitus (T1DM). Approximately 50% of individuals with T1DM will develop microalbuminuria at some time. Of these, around one-third will regress to normal urinary albumin excretion (UAE), at least temporarily, one-third will remain microalbuminuric and one-third will progress to proteinuria. Once proteinuria is present, progression to end-stage renal disease (ESRD) is usually inevitable. BP, blood pressure; CVD, cardiovascular disease. Reproduced from Marshall SM, Flyvbjerg A. Prevention and early detection of vascular complications of diabetes. Br Med J 2006; 333:475–480, with permission.
Older data suggest that the cumulative incidence of proteinuria is around 40%, but in several Scandinavian studies, the cumulative incidence has fallen in individuals diagnosed after 1970 to around 10–14% after 20–25 years’ duration [17,18]. In the Pittsburgh cohort, the incidence has remained relatively steady at 32% after 25 years [19]. Almost all patients with T1DM with proteinuria eventually progress to ESRD, if untreated in a mean time of 9 years. GFR is generally relatively stable in microalbuminuria but begins to fall when proteinuria develops, with a mean annual rate of decline in GFR of 10–12mL/min/1.73 m2 in a patient without good BP control. Low eGFR occurs very rarely without preceding microalbuminuria in patients with T1DM [20].
Several countries report a declining incidence of ESRD in T1DM. In Sweden, at a maximum duration of diabetes of 27 years (mean 21 years), only 33 of 12 032 cases with childhood-onset diabetes had developed ESRD, all with diabetes duration >15 years [21]. With diabetes duration >15 years, the cumulative incidence of ESRD was 0.7%. Data from the Pittsburgh Epidemiology of Diabetes Complications Study also suggests a declining incidence, but after 30 years’ duration, the cumulative incidence remained higher at 18% in those diagnosed 1965–1969 [19]. Analyses of data combined from several individual registries confirms that between 1991 and 2000, the numbers of people with T1DM entering RRT has either remained static [2] or even decreased slightly [3]. at a time when the incidence of T1DM is rising. Survival once ESRD has developed may also have improved [22,23].
Thus, the incidence of all stages of diabetic nephropathy may be declining, at least in some centers. Whether this represents true prevention, or perhaps more likely delay in progression, remains to be seen.
Type 2 diabetes
Classic diabetic nephropathy
The natural history of nephropathy in T2DM is not unlike that of T1DM, with some notable exceptions. At diagnosis, UAE may be raised but with good glycemic control generally returns to normal; however, in 10–48% microalbuminuria persists [24,25]. Those with persistently raised UAE probably have had diabetes for some time before diagnosis, and have established kidney changes. The reported prevalence of hyperfiltration at diagnosis of T2DM varies between studies, reflecting diabetes undiagnosed for some time and the presence of co-morbidities including preexisting hypertension.
Longitudinal studies in the Pima Indians show that GFR is generally increased in subjects with impaired glucose tolerance (IGT) who later progress to frank diabetes [26]. In one study, 16% of newly diagnosed patients had hyperfiltration [27]. After 6 months. treatment, GFR fell significantly only in those with GFR initially >120 mL/min [28]. GFR remains stable with the onset of microalbuminuria, only beginning to decline when proteinuria develops [26,29]. No relationship of hyperfiltration at diagnosis to subsequent nephropathy has been found.
In cross-sectional studies in established diabetes, the prevalence of microalbuminuria is 10–42%, depending on population selection [30–36]. Higher prevalences are reported in UK Asians [31], Pima Indians [35], African-Americans [37] and in Maori and Pacific Islanders [33] than Europid patients. The relationship of microalbuminuria to duration of T2DM is not as strong as in T1DM. Many longitudinal studies suggest that the rate of progression from normal UAE to microalbuminuria is 3–4% per annum which is at least as high as, if not higher than, in T1DM [35,38–41].
In Caucasian populations, approximately 7% of microalbuminuric patients with T2DM develop proteinuria per year [42–44]. In an older study, after 20 years’ duration of T2DM, the cumulative incidence of proteinuria was 27%, similar to that in T1DM [45]. In the Pima Indians, more than 50% develop proteinuria within 20 years [26]. In contrast to the decline in the cumulative incidence of proteinuria in T1DM, the incidence has doubled in Pima Indians in the last 40 years [46], despite improvements in glucose and BP control and probably as a consequence of increasing survival and therefore duration of diabetes [47].
Once proteinuria develops, the untreated rate of decline of GFR is similar to that in T1DM at 10–12 mL/min/1.73 m2 [45,48], although it may be greater in non-Europid subjects [49]. Rates for acceptance on to RRT are higher in African-Caribbean and Indo-Asian than Europid people with diabetes [50–52]. In the Pima Indians, the age- and sex-adjusted incidence of ESRD has declined since 1990, suggesting slowing of progression [47].
Overall, the course of nephropathy in Europid T2DM is similar to that in T1DM, the differences probably relating to delayed diagnosis, older age and more CVD of the subjects with T2DM. In the ethnic minorities, the prevalence of nephropathy is higher, and progression to ESRD may be faster.
Non-classic diabetic nephropathy
One-third of Europid patients with T2DM with raised UAE do not have classic histologic changes of diabetic glomerulosclerosis; arterial hyalinization is the most common abnormality. Conversely, some patients with T2DM with a progressive decline in GFR have normal albumin excretion or only low levels of microalbuminuria which do not progress. In the UK Prospective Diabetes Study (UKPDS), 51% of those who developed renal impairment did not have preceding albuminuria [53]. Identification of patients with non-diabetic changes on the basis of clinical features, including the absence of diabetic retinopathy [54,55], is difficult. The underlying disease process probably reflects a combination of diabetes, hypertension and atherosclerotic vascular disease, or a specific obesity-related glomerulopathy [56].
Risk factors for diabetic nephropathy
Diabetes duration is one of the strongest risk factors for nephropathy, along with glycemic control, BP and blood lipid levels (Figure 37.3) [12]. “White coat” hypertension, reflecting higher 24-hour BP, doubles the risk of proteinuria [57] and, in young people, microalbuminuria is associated with higher nocturnal diastolic BP and loss of diastolic dipping [58]. Although blood lipids contribute to the development and progression of nephropathy, the lipid phenotype alters as nephropathy progresses [59,60]. Current smoking also predicts the development of albuminuria [61].
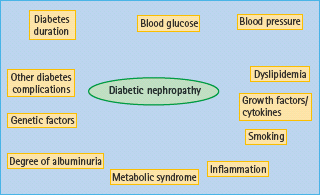
Both patients with T1DM and T2DM with nephropathy are more likely to have the metabolic syndrome [62–65].
The degree of albuminuria is also an independent predictor at each stage of nephropathy; thus, the higher the UAE within the normal range, the higher the risk of developing microalbuminuria [66]. Likewise, the higher the level of microalbuminuria, the higher the risk of developing proteinuria. Baseline albuminuria was the strongest predictor of ESRD in the Reduction of Endpoints in NIDDM with the Angiotensin II Antagonist Losartan (RENAAL) study [67].
Several lines of evidence suggest a genetic susceptibility to diabetic nephropathy in T1DM, as only 40% of patients are at risk. If one sibling with diabetes has nephropathy, the risk to a second sibling is increased four- to eightfold compared to siblings where neither has nephropathy [68]. The clustering of conventional cardiovascular risk factors and CVD in patients with diabetes and nephropathy also occurs in their parents [69]. This suggests that the genetic susceptibility to nephropathy also influences the development of CVD. Multiple genes are likely to be involved and different loci may influence UAE and GFR separately [70]. Many candidate genes suggested in small studies have not been confirmed in adequately powered cohorts.
Other possible risk factors for nephropathy include pre-eclampsia, but not pregnancy-induced hypertension [71], inflammatory markers [72], cytokines and growth factors [73] and periodontitis [74]. High levels of mannose-binding lectin (MBL) predict progression from normoalbuminuria to micro- and/or macro-albuminuria in T1DM and T2DM [75,76]. In patients with T1DM, higher baseline levels of the bone-related peptide osteoprotegerin (OPG) [77] predicted higher risk of progression to ESRD. Patients with T2DM and non-alcoholic fatty liver disease are more likely to have CKD [78].
Association of diabetic nephropathy with other complications of diabetes
The prognosis for diabetic patients with any degree of diabetic nephropathy is much poorer than for individuals without nephropathy. The risk of CVD and of other microvascular complications is greatly increased. Indeed, diabetic nephropathy may be a vascular disease [79].
Cardiovascular disease
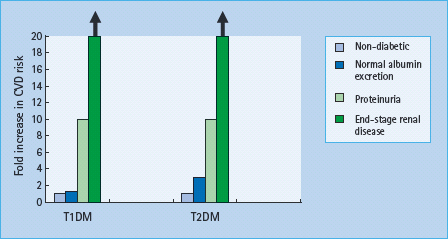
In T1DM, the relative risk of CVD is 1.2-fold in microalbuminuric [80,81] and 10-fold higher in proteinuric than normoalbu-minuric patients (Figure 37.4) [82,83]. The cumulative incidence of CVD by the age of 40 years is 43% in patients with T1DM with diabetic nephropathy, compared to 7% in patients without diabetic nephropathy, with a 10-fold increased risk of coronary heart disease and stroke. In ESRD the risk is even higher.
In T2DM, with microalbuminuria, the risk is increased two- to fourfold [84] and with proteinuria ninefold [85]. Once serum creatinine is outwith the normal range, cardiovascular risk increases exponentially [86,87]. Survival with ESRD is very limited: 20–25% of individuals with T2DM die in the first year of dialysis, and almost all are dead within 4–5 years.
Figure 37.4 Increasing cardiovascular risk with the development of nephropathy in type 1 diabetes mellitus (T1DM) and type 2 diabetes mellitus (T2DM). Compared with normoalbuminuric individuals with T1DM, cardiovascular disease (CVD) risk is increased 1.2-fold in microalbuminuria, 10-fold in proteinuria and at least 20-fold in patients with T1DM with declining glomerular filtration rate (GFR). In T2DM, the risk is increased 2–4 fold in microalbuminuria, 10-fold in proteinuria and at least 20-fold in those with declining GFR.
In both T1DM and T2DM, all-cause and cardiovascular mortality increases as eGFR decreases [88]. UAE and declining GFR may have independent effects [89–91].
Hypertension
Hypertension is an invariable accompaniment of persistent proteinuria and ESRD. The excess prevalence of hypertension in T1DM is confined to patients with nephropathy, individuals with normal UAE having a prevalence of hypertension similar to the non-diabetic population [92]. This suggests that hypertension is an integral part of diabetic nephropathy, perhaps arising from the same underlying mechanisms. In support of this, BP rises very early in the development of nephropathy. Accordingly, patients with UAE in the high normal range, who are at increased risk of progression to microalbuminuria, have a higher BP than those with lower UAE [7,93]. Changes in BP are very subtle at this stage and may only be documented on 24-hour BP monitoring, perhaps as reduced dipping in nocturnal diastolic BP [94].
In most cross-sectional studies, patients with T1DM with microalbuminuria have higher BP than those with normal UAE, although the levels may not meet a formal definition of hypertension. Once proteinuria is present, untreated BP is >140/90mmHg in over 80% of patients, and in ESRD hypertension is almost universal.
In T2DM, because hypertension is common, the link between hypertension and renal disease is less striking; however, almost all patients with microalbuminuria or more severe renal disease have hypertension, and the more severe the renal disease, the higher the BP.
Other microvascular complications
Patients with nephropathy are also much more likely to have other microvascular complications. Indeed, the absence of other microvascular disease should make one question the diagnosis of diabetic nephropathy as the cause for the renal disease. Significant retinopathy is almost invariably present in patients with T1DM with microalbuminuria or more severe renal disease. In patients with T2DM, the relationship is less clear-cut. Those with classic nephropathy and progressively increasing UAE usually have significant retinopathy. In those with non-classic disease, with non-progressive low levels of microalbuminuria, retinopathy may be absent.
Peripheral neuropathy is also more common in patients with diabetes and renal disease, associating with both albuminuria and declining GFR [95]. Autonomic neuropathy, perhaps relating to loss of nocturnal BP dipping, occurs frequently [96,97].
Testing for kidney disease in diabetes
Screening
Early identification of CKD in people with diabetes allows intensification of therapy to slow the progression of the kidney disease and to manage the increased risk of other complications, particularly CVD. All guidelines suggest systematic screening, generally as part of the “annual review.” Both UAE and GFR should be measured, as the combination improves prediction of ESRD [98]. Screening should be undertaken when the person is free of acute illness and in stable glucose control, because many acute illnesses and acute hyperglycemia increase UAE temporarily.
As UAE may increase in the upright posture and with exercise, measurements are best made in an early morning urine sample; however, a spot urine sample can be used if there is no alternative. Timed overnight or 24-hour urine collections are only required for research purposes. A plan for screening is shown in Figure 37.5. Urine albumin is stable at room temperature; the patient can collect two or three early morning urine samples on consecutive days and return them all at the same time. Because of the high day-to-day variation in UAE, at least two out of three measurements should be abnormal before a diagnosis of microalbuminuria or proteinuria is made.
Figure 37.5 A suggested plan for annual screening for kidney disease in diabetes. eGFR, estimated glomerular filtration rate. Adapted from Marshall SM, Flyvbjerg A. Prevention and early detection of vascular complications of diabetes. Br Med J 2006; 333:475–480.
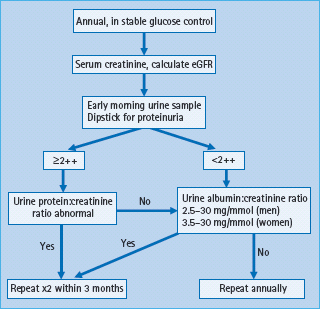
Serum creatinine should also be measured annually, using an accredited assay standardized to the recommended isotope dilution mass spectroscopy reference method. Using the four variable Modification of Diet in Renal Disease equations, which adjust for age, sex and ethnicity, eGFR is calculated from the serum creatinine [99]. Although the validity of this equation in diabetes has been debated, there is general agreement that it provides information that is more reliable than serum creatinine and is sufficiently accurate for clinical use when eGFR is <60mL/min/1.73m2 [100103]; however, the equation underestimates the rate of change of GFR at higher levels and is not a good indicator of hyperfiltration [104,105].
The final screening stage should indicate both the GFR and UAE status, as in Table 37.2. For example, stage 3 CKD with proteinuria or stage 2 CKD with microalbuminuria.
Serum cystatin C has been suggested as an alternative to creatinine. Cystatin C is a naturally circulating protein that is freely filtered by the glomerulus and almost completely reabsorbed and catabolized by tubular cells. Although levels reflect trends in GFR < 40 mL/min/1.73 m2, there is doubt about its ability to detect changes in GFR before the serum creatinine has risen [105–108]. Thus, it seems premature to use cystatin C as a marker of GFR.
Excluding other treatable causes of kidney disease
It is uncommon to find a specific treatable cause of CKD if the natural history is classic, with slowly progressive rise in albuminuria and BP in the presence of retinopathy; however, if there is doubt, ultrasound of the renal tract and measurement of autoantibodies and immunoglobulins may help. If the diagnosis remains unclear, referral to a nephrologist is appropriate.
Monitoring kidney disease
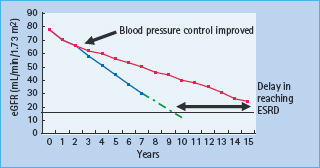
Once abnormal UAE has been detected, the albumin. creatinine ratio should be measured every 3 months, preferably on the three consecutive mornings before the clinic visit. This provides sufficient information to identify true changes in UAE with time, as opposed to day-to-day variation. Serum creatinine and eGFR should also be measured 3–6 monthly. Once renal function begins to decline, there is a linear relationship between eGFR, or the inverse of the serum creatinine, which is useful in assessing changes in rate of decline of GFR in response to therapy and to estimate when an individual will reach ESRD (Figure 37.6).
Figure 37.6 Monitoring changes in estimated glomerular filtration rate (eGFR). Solid black line: end-stage renal disease (ESRD). Blue line: actual linear decline in eGFR of 5–6m^min/1.73m2 in an individual with modest blood pressure (BP) control. Green dotted line: estimated further fall in eGFR in the same individual in the blue line, showing that they will reach ESRD in 9–10 years. Red line: fall in eGFR in an individual whose BP control was tightened between years 2 and 3. The rate of decline of eGFR is reduced, delaying ESRD by at least 5 years (illustrated by thick, black, double-ended arrow).
Prevention of kidney disease
Prevention of kidney disease is crucial (Table 37.3). Although much can be done to slow progression when UAE is raised or GFR has begun to decline, it may not be possible to avoid ESRD. The risk of developing diabetic nephropathy is greatly reduced by good blood glucose control. In T2DM, BP control is also crucial. Studies have generally used the development of microalbuminuria as their primary endpoint, with data on preservation of GFR being limited.
Table 37.3 Factors important in prevention of nephropathy in T1DM and T2DM.
| T1DM | T2DM | |
| Blood glucose control | Yes | Yes |
| Hypertension | Probably | Yes |
| RAS inhibition in “normotension” | No | Yes |
| Dyslipidemia treatment | Possibly | Possibly |
| Dyslipidemia treatment | Possibly | Possibly |
RAS, renin angiotensin system.
Prevention in type 1 diabetes
Glucose control
In initially normoalbuminuric patients in the Diabetes Control and Complications Trial (DCCT), the relative risk reduction for development of microalbuminuria was 39% and for proteinuria 54% in those allocated to the intensively treated group compared to those in the conventionally managed group over the 6.5-year study [109]. Mean achieved HbA1c was approximately 7.0% (53mmol/mol) and 9.1% (76mmol/mol), respectively. There is no HbA1c threshold below which risk is not reduced, implying that the lower the HbA1c, the lower the risk of nephropathy [110]. Thus, any reduction in HbA1c is beneficial.
In the open follow-up of the DCCT cohort, the Epidemiology of Diabetes Interventions and Complications (EDIC) study, the difference in HbA1c between the previously intensively and conventionally managed groups narrowed over 4 years of follow-up to a mean of 7.9% (63 mmol/mol) and 8.2% (66 mmol/mol), respectively [111]. Despite this, after 8 years, 6.8% in the intensively treated group and 15.8% in the conventionally treated group had developed new microalbuminuria, a 59% reduction in odds [112]. The 84% reduction in new proteinuria was even more impressive: 1.4 vs 9.4%. In addition, fewer participants in the intensive group developed hypertension (29.9 vs 40.3%) and serum creatinine >176μmol/L (5 vs 19 patients; P = 0.004). Thus, the beneficial renal effects of intensive glucose therapy extend far beyond the actual period of good control, a phenomenon termed “metabolic memory.”
Blood pressure control
No trials have specifically addressed the question of whether improved control of hypertension in patients with T1DM reduces the risk of renal disease, but given the weight of evidence in the general population, this would seem likely. Two trials have explored the effects of renin angiotensin system (RAS) inhibitors in patients with T1DM with normal UAE and BP [113,114]. In the Eurodiab Controlled Trial of Lisinopril in Insulin-Dependent Diabetes Mellitus (EUCLID) study, patients with T1DM receiving lisinopril for 2 years had significantly lower UAE than those receiving placebo [113]; however, the clinical relevance of the small difference (1 μg/min) is questionable. In the The DIabetic REtinopathy Candesartan Trials (DIRECT) study, candesartan 32 mg/day for 4.7 years did not prevent microalbuminuria [114]. Thus, there is no evidence that in normotensive patients with T1DM, prescription of agents that block the RAS prevents the onset of microalbuminuria.
Prevention in type 2 diabetes
Glucose control
In the UKPDS, although the mean achieved HbA1c in the intensively managed group was 7.0% (53 mmol/mol), compared to 7.9% (63 mmol/mol) in the less strictly managed group, there was a reduction in the relative risk of developing microalbuminuria and proteinuria of approximately 30% after 9–12 years [115]. Different glucose lowering therapies had similar effects, although the UKPDS was not powered to detect small differences between therapies. As in the DCCT, no threshold of HbA1 c and risk was observed, again suggesting that the lower the HbA1c, the lower the risk of nephropathy. For a 1% (11 mmol/mol) reduction in HbA1c, there was a 37% reduction in the risk of microvascular complications [116]. In the open follow-up of the UKPDS cohort, HbA1c was similar in the previously intensively and conventionally managed groups after 1 year [117]. Despite this, microvascular risk remained lower, confirming the “metabolic memory” seen in the DCCT/EDIC study.
In the Action in Diabetes and Vascular Disease: Preterax and Diamicron MR Controlled Evaluation (ADVANCE) study, intensive therapy was based on modified release gliclazide, with other agents added if the target HbA1c of 6.5% (48 mmol/mol) was not reached [118]. The lower HbA. c in the intensive group (6.5% [48 mmol/mol] compared to 7.3% [56 mmol/mol] in the standard group) was associated with a 9% relative risk reduction in new onset microalbuminuria over 5 years.
Blood pressure control
Control of hypertension reduces the risk of developing micro-albuminuria. In the UKPDS [119]. tight BP control (achieved mean 144/82 mmHg) compared to less tight control (achieved mean 154/87 mmHg) resulted in a 29% reduction in risk of microalbuminuria over 6 years. There is no BP level below which risk rises again (i.e. no “J” shape) [120]. Treatment with captoprii and atenolol was equally effective, although the study was not powered to detect differences between treatment modalities [121]. In the subset of normoalbuminuric patients with diabetes in the Heart Outcomes Prevention Evaluation (HOPE) study [122], addition of ramipril to background antihypertensive therapy reduced the risk of developing proteinuria, compared to the addition of placebo. In the Bergamo Nephrologic Diabetes Complications Trial (BENEDICT) study, hypertensive (BP > 130/85 mmHg), but normoalbuminuric patients with T2DM receiving trandolapril alone or in combination with verapamil were approximately 50% less likely to develop microalbuminuria than subjects taking verapamil alone or placebo [41]. In the ADVANCE trial, there was a significant 17% reduction in the incidence of microalbuminuria in those receiving perindopril indapamide [123]. Thus, there may be a particular benefit of RAS inhibition in prevention of nephropathy, as seen in a meta-analysis [124].
Overall, there is no doubt that tight BP control (achieved BP of approximately 140/80 mmHg) reduces the risk of microalbuminuria in T2DM. First-line therapy with RAS inhibitors may be most effective, but lowering BP sufficiently is more important than the type of first line agent used. Many guidelines now suggest a BP target of 130/80 mmHg for people with T2DM, based on the evidence around prevention of CVD events and not on renal outcomes; of note, achieved BP in the specific renal studies has been around 140/80 mmHg.
In contrast to the “metabolic memory” demonstrated with glucose control, the benefits of BP reduction are lost when BP control deteriorates [125]. Tight BP control must be continued long-term if the benefits are to be maintained.
Management of diabetic kidney disease
Rigorous intervention, particularly to control BP tightly, can alter the gloomy prognosis in diabetic nephropathy (Table 37.4). Conservative estimates suggest that good management can double the time taken from first appearance of proteinuria to need for RRT, from a mean of 9 years to a mean of 18 years. More optimistically, improved management of microalbuminuria may prevent progression to proteinuria.
Table 37.4 Factors important in delaying progression of nephropathy in T1DM and T2DM.
| Factor | Target |
| Glucose control | HbA1c as low as possible without undue hypoglycemia |
| RAS inhibition | For all, unless absolutely contraindicated |
| Blood pressure | As low as possible; < 125/75 mmHg if proteinuric or eGFR < 60 mL/min/1.73 m 2 ; others < 130/80 mmHg |
| Lipids | Statin for all; additional therapy if total cholesterol > 4.0 mmol/L or LDL cholesterol > 2.0 mmol/L or triglycerides > 2.1 mmol/L |
| Aspirin | 75 mg/day for all |
| Smoking | Stop |
| Weight | BMI < 25.0 kg/m2 |
| Dietary protein intake | If proteinuria: 6-month trial of reduction to 0.9 g/kg body weight per day |
BMI, body mass index; eGFR, estimated glomerular filtration rate; LDL, low density lipoprotein; RAS, renin angiotensin system.
Type 1 diabetes
Glucose control
Once UAE is abnormal, there is little evidence that tight blood glucose control influences progression. The studies that have been performed were all small, of short duration or did not achieve sufficiently tight glucose control [13,14,126–128]. In a highly selected group of patients undergoing serial renal biopsies after pancreas transplantation, renal structural changes regressed [129], but only after 10 years. Thus, very prolonged periods of extremely good control may be necessary to reverse renal structural changes, indicated by microalbuminuria or proteinuria.
Inhibition of the RAS in m icroalbuminuria and p roteinuria
A meta-analysis of 12 studies (698 individuals) summarized the effects of treatment with angiotensin-converting enzyme (ACE) inhibitors in microalbuminuric patients with T1DM [130]. The odds ratio of progression to persistent proteinuria was reduced by ACE inhibition to 0.35, and the odds ratio for regression to normal UAE increased to 3.07, compared to placebo treatment. After 2 years’ treatment, the mean reduction in UAE was 50.5% with ACE inhibition. The reduction in UAE was greatest in those with highest baseline UAE, but the response to treatment plateaued with time, suggesting that treatment delays, rather than prevents, progression.
Addition of an ACE inhibitor to non-ACE inhibitor antihypertensive therapy reduced the risk of a doubling of the serum creatinine by 48% and the composite endpoint of death, need for dialysis or renal transplantation by 50%, in patients with T1DM with proteinuria and hypertension [131]. Both benefits were independent of BP. In short-term studies, the effects of angiotensin II receptor blockers (ARBs) on BP and UAE are similar to those of ACE inhibitors in proteinuric patients with T1DM [132].
For a similar reduction in BP, there is a greater reduction in protein excretion using ACE inhibitors compared with other classes of antihypertensive agents [133]. This may be especially beneficial, as the passage of protein across the glomerular filtration barrier may accelerate the progression of nephropathy [134].
On the basis of the above, and of animal data showing preferential reduction in intraglomerular pressure with ACE inhibitors [135], ACE inhibitors should be offered to all patients with T1DM with abnormal UAE, even if BP is normal. The dose should be titrated up to the maximum recommended or tolerated doses, to obtain maximal antiproteinuric effect.
Blood pressure control
Tight BP control is crucial in slowing the progression of diabetic kidney disease. GFR and renal structural variables remain relatively stable in proteinuric patients with T1DM who do not have hypertension [136,137]. Reduction of BP to < 140/80 mmHg reduces the rate of decline of GFR from 10–12 mL/min/year untreated to < 5 mL/min/year [138]. Regression from persistent proteinuria to microalbuminuria has been reported, with the fall in GFR reduced to <1 mL/min/year for a substantial time in a significant number of patients [139].
If BP remains >125/75 mmHg on maximum dose of ACE inhibitor or ARB, antihypertensive therapy should be intensified. The choice of agent should be made on an individual basis, as there is no evidence in T1DM that any one add-on agent is better than any other. In the short term, addition of an ARB to therapy with an ACE inhibitor gives further reduction in BP and UAE [140,141], in line with a systematic review of data in proteinuric patients generally [142]; however, there is no evidence of long-term benefit, and some concern about hyperkalemia [142]. Addition of spironolactone to other antihypertensive therapy, including RAS blockade, reduces UAE in the short term [143]. There are no good data on direct renin inhibition in T1DM.
Type 2 diabetes
Glucose control
There is some evidence that improved glucose control delays progression of microalbuminuria. In the ADVANCE study, a difference in HbA.c of 6.5% (48mmol/mol) vs 7.3% (56mmol/ mol) over 5 years was associated with a relative risk reduction in the development of proteinuria of 21% [118]. In a small study of Japanese patients with T2DM, with normal UAE or microalbuminuria at baseline, the proportion of patients with worsening of nephropathy (an increase of one or more steps in the three stages of normoalbuminuria, microalbuminuria and proteinuria), was significantly lower after 6–8 years of intensive glucose management [144,145].
Inhibition of RAS
As with T1DM, there is now good evidence in T2DM that inhibition of the RAS should be the backbone of therapy. In microalbuminuric patients with T2DM with BP > 135/85 mmHg, a large randomized controlled study compared the ARB irbesartan, 150 or 300 mg/day, with placebo [44]. Over 2 years, the proportion of patients developing persistent proteinuria was as follows: high dose irbesartan 5.2% (hazard ratio 0.30); low dose irbesartan 9.7% (hazard ratio 0.61) and placebo 14.9%. The proportion of patients becoming normoalbuminuric was 34%, 24% and 21%, respectively. A much smaller study in similar patients demonstrated that ACE inhibition reduces the rise in UAE and stabilized serum creatinine over 4 or 5 years [146,147]. Thirty-two percent of the patients with T2DM in the HOPE study had microalbuminuria [122]. There was a significant reduction in the risk of developing proteinuria in those receiving ramipril, independent of BP.
Two large studies of patients with T2DM with advanced nephropathy have been conducted [148,149]. In the RENAAL study [148], the effects of the ARB losartan were compared with placebo, in addition to conventional antihypertensive therapy. In the group taking losartan, 43.5% reached the primary outcome (doubling of serum creatinine, ESRD or death), compared to 47.1% in the control group, a 16% risk reduction. In the second study, another ARB, irbesartan, was compared with the calcium-channel blocking agent amlodipine and placebo, in addition to conventional antihypertensive therapy [149]. Treatment with irbesartan was associated with a 20% reduction in the primary endpoint (doubling of serum creatinine, ESRD or death) compared to placebo and 23% compared to amlodipine.
Direct comparisons of ACE inhibitors and ARBs in microalbuminuric patients with T2DM suggest no clinically important differences in renal outcomes [150–152]; however, even the largest of these was not powered to detect small differences [150]. Thus, as in T1DM, patients with T2DM with high UAE should be prescribed an RAS inhibitor, which should be titrated up to the maximum tolerated dose.
Blood pressure control
Most patients with T2DM with elevated UAE will require additional antihypertensive therapy. The guideline target BP in proteinuric patients of <125/75 mmHg is extremely difficult to reach. The choice of additional agents should be made on an individual basis, with diuretics and calcium-channel blockers often being appropriate. A direct renin inhibitor, aliskiren, added to 100 mg/ day losartan in hypertensive patients with T2DM with nephropathy, reduced UAE by 20% compared to placebo, with no increase in adverse events [153]. Spironolactone, with or without background ACE inhibitor or ARB, reduces UAE and BP but may cause glycemic control to deteriorate [154,155].
Short-term studies have suggested greater reduction in BP and UAE when ACE inhibitors and ARBs are used in combination than when they are used separately [152]. however, in a study designed to assess CVD outcomes, and which included individuals with diabetes, combination therapy with an ACE inhibitor and ARB did not improve CVD outcomes, and was associated with more adverse events [156]. In particular, the incidences of renal dysfunction and renal failure were higher in those on combination therapy than those taking ACE inhibitor or ARB monotherapy. Thus, combination therapy is not advisable.
Low protein diet
A Cochrane meta-analysis concluded that reducing dietary protein intake non-significantly reduces progression to ESRD [157]. Questions about the level of protein intake required and compliance with diet were raised. Large variability between patients was seen, so that a 6-month trial of dietary restriction might be appropriate, with only those patients who respond continuing thereafter. Dietary protein intake should not be restricted to < 0.7 g/kg body weight/day.
Cardiovascular risk: smoking, lipids, aspirin
The above measures, particularly RAS blockade and controlling BP, reduce both CVD and renal risk. There are no good trials of smoking cessation, lipid control and use of aspirin individually in diabetic kidney disease, but the Steno-2 study in patients with T2DM and microalbuminuria addressed all modifiable CVD risk factors aggressively [158,159]. Although the proportion of patients reaching these strict targets was disappointing low, there was a large reduction in the proportion of the intensively managed group having a CVD event. The risk of developing proteinuria was also reduced (relative risk 0.39 [0.17–0.87]; P = 0.003), as was the risk of retinopathy and autonomic neuropathy.
After the 8-year randomized trial, participants were followed observationally for a further 5.5 years [160]. Twenty four patients in the initially intensively managed group died, compared to 40 in the conventional therapy group (hazard ratio 0.54 [0.32–0.89]; P = 0.02). The risk of cardiovascular death and of cardiovascular events was significantly lower in the intensively treated group. One patient in the intensive group compared to six in the conventional group developed ESRD. Thus, intensive intervention with lifestyle modification and multiple drug combinations had sustained beneficial effects on both cardiovascular and renal outcomes (Table 37.5).
Table 37.5 The Steno-2 study. Aggressive multifactorial management in patients with T2DM and microalbuminuria. Outcomes after 7.8 years of intensive or conventional management, plus 5.5 years observational follow-up.
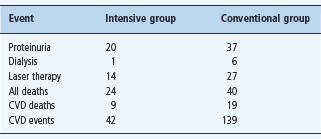
CVD, cardiovascular disease. Figures are number of patients.
Related posts:

Stay updated, free articles. Join our Telegram channel

Full access? Get Clinical Tree


