INTRODUCTION
SUMMARY
Cytogenetic and genetic analysis provides pathologists and clinicians with a powerful tool for the diagnosis and classification of hematologic malignant diseases. The detection of an acquired, somatic mutation establishes the diagnosis of a neoplastic disorder and rules out hyperplasia, dysplasia, or morphologic changes from toxic injury or vitamin deficiency. Specific cytogenetic and genetic abnormalities have been identified that are very closely, and sometimes uniquely, associated with morphologically distinct subsets of leukemia or lymphoma, enabling clinicians to predict their clinical course and likelihood of responding to particular treatments. The detection of one of these recurring abnormalities is helpful in establishing the diagnosis and adds information of prognostic importance. In many cases, the prognostic information derived from cytogenetic and genetic analysis is independent of that provided by other clinical features. Patients with favorable genetic prognostic features benefit from standard therapies with a well-known spectra of toxicities, whereas those with less-favorable clinical and cytogenetic or genetic characteristics may be better treated with more intensive or investigational therapies. Pretreatment cytogenetic analysis also can be useful in choosing between post-remission therapies that differ widely in cost, acute and chronic morbidity, and effectiveness. The appearance of new abnormalities in the karyotype of a patient under observation often signals clonal evolution and more aggressive behavior. The disappearance of a chromosomal abnormality present at diagnosis is an important indicator of complete remission following treatment, and its reappearance may herald disease recurrence.
Acronyms and Abbreviations:
ALCL, anaplastic large cell lymphoma; ALL, acute lymphocytic or lymphoblastic leukemia; AML, acute myeloid leukemia; AMML, acute myelomonocytic leukemia; APL, acute promyelocytic leukemia; CDS, commonly deleted segment; CLL, chronic lymphocytic leukemia; CMA, chromosome microarray analysis; CML, chronic myeloid leukemia; del, deletion; DLBCL, diffuse large B-cell lymphoma; EBV, Epstein-Barr virus; FAB, French-American-British; FISH, fluorescence in situ hybridization; FLT3, FMS-like tyrosine kinase; HSC, hematopoietic stem cell; IGH, immunoglobulin heavy chain; inv, inversion; ITD, internal tandem duplication; JAK, Janus kinase; LOH, loss of heterozygosity; MALT, mucosa-associated lymphoid tissue; MAPK, mitogen-activated protein kinase; MDS, myelodysplastic syndrome; Ph, Philadelphia chromosome; PI3K, phosphatidylinositide 3′-kinase; qRT-PCR, quantitative reverse transcriptase polymerase chain reaction; RA, refractory anemia; RAEB, refractory anemia with excess blasts; RARα, retinoic acid receptor-α; RARS, refractory anemia with ring sideroblasts; RARS-t, refractory anemia with ringed sideroblasts and thrombocytosis; RCMD, refractory cytopenia with multilineage dysplasia; SNP, single nucleotide polymorphism; STAT, signal transducer and activator of transcription; t, translocation; t-, therapy-related, TKI, tyrosine kinase inhibitor; WHO, World Health Organization.
GENETIC CONSEQUENCES OF GENOMIC REARRANGEMENTS
Over the past two decades, the genes that are located at the breakpoints of a number of the recurring chromosomal translocations have been identified. Alterations in the expression of the genes or in the properties of the encoded proteins resulting from the rearrangement play an integral role in the process of malignant transformation.1,2 The altered genes fall into several functional classes, including tyrosine or serine protein kinases, cell surface receptors, growth factors and, the largest class, transcription factors. These latter proteins are involved in the induction or repression of gene transcription, often functioning in a tissue-specific fashion to regulate cell growth and differentiation.
There are two general mechanisms by which chromosomal translocations result in altered gene function. The first is deregulation of gene expression (Chap. 10). This mechanism is characteristic of the translocations in lymphoid neoplasms that involve the immunoglobulin genes in B-lineage tumors and the T-cell receptor genes in T-lineage tumors. These rearrangements result in the inappropriate or constitutive expression of an oncogene. The second mechanism is the encoding and expression of a novel fusion protein, resulting from the juxtaposition of coding sequences from two genes that are normally located on different chromosomes. Such chimeric proteins are “tumor specific” in that the fusion gene typically does not exist in nonmalignant cells. Thus, the detection of such a fusion gene or protein product can be important in diagnosis and in the detection of residual disease or early relapse. Moreover, they may also be appropriate targets for tumor-specific therapies. An example is the chimeric BCR-ABL1 protein resulting from the t(9;22) in chronic myeloid leukemia (CML) (see “Methods of Cell Preparation” below). All of the translocations cloned to date in the myeloid leukemias result in a fusion protein.
Chromosomal translocations result in the activation of genes in a dominant fashion. A number of human tumors result from homozygous, recessive mutations. These mutations lead to the absence of a functional protein product, suggesting that these genes function as “suppressor” genes, whose normal role(s) is to limit cellular proliferation. The hallmark of tumor suppressor genes is the loss of genetic material in malignant cells, resulting from chromosomal loss or deletion, as well as by other genetic mechanisms (Chap. 10).1 A subset of tumor suppressor genes act by haploinsufficiency, whereby loss of one allele results in a reduction in the level of the protein product by half, thereby perturbing normal cellular processes. This mechanism is common in the recurring deletions in myeloid neoplasms (Chap. 83).
Extensive experimental evidence indicates that more than one mutation is required for the pathogenesis of hematologic malignancies. That is, expression of translocation-specific fusion genes or deregulated expression of oncogenes is required, but insufficient to induce leukemia. Thus, an important aspect of leukemia biology is the elucidation of the spectrum of chromosomal and molecular mutations that cooperate in the pathways leading to leukemogenesis. Where known, we describe the cooperating mutations associated with specific cytogenetic subsets of leukemia or lymphoma.
METHODS OF CELL PREPARATION
Cytogenetic analysis of malignant diseases should be based upon the study of the tumor cells themselves. In leukemia, the specimen is usually obtained by marrow aspiration and is typically cultured for 24 to 72 hours. When a marrow aspirate cannot be obtained, a marrow biopsy (bone core specimen) or a blood sample for patients who have circulating immature myeloid or lymphoid cells, can often be processed successfully. An involved lymph node or tumor mass specimen may be examined for the analysis of lymphoma cells.
For specimen collection, 1 to 5 mL of marrow are aspirated aseptically into a syringe coated with preservative-free sodium heparin and transferred to a sterile 15-mL centrifuge tube containing 5 mL of culture medium (RPMI 1640, 100 units sodium heparin). The use of Vacutainer tubes containing heparin as an anticoagulant should be avoided, as the heparin contains preservatives that suppress cell growth. If a marrow aspirate cannot be obtained, a marrow biopsy may be taken and placed into the collection tube. Approximately 75 percent of marrow biopsies can be minced to generate suspension of cells that will yield adequate numbers of metaphase cells for complete analysis. For blood specimens, 10 mL are drawn aseptically by venipuncture into a syringe coated with preservative-free heparin. To avoid loss of cell viability, it is critical that the specimen be transported at room temperature to the cytogenetics laboratory without delay. Overnight shipment of specimens frequently results in loss of cell viability, and most laboratories experience a high proportion (25–50 percent) of inadequate analyses using such specimens. For optimally handled specimens, approximately 95 percent of all cases should be adequate for cytogenetic analysis. Those cases that are inadequate generally represent samples from patients with hypocellular marrows.
CHROMOSOME NOMENCLATURE
Chromosomal abnormalities are described according to the International System for Human Cytogenetic Nomenclature (Table 13–1).3 To describe the chromosomal complement, the total chromosome number is listed first, followed by the sex chromosomes, and numerical and structural abnormalities in ascending order. The observation of at least two cells with the same structural rearrangement, for example, translocations, deletions or inversions, or gain of the same chromosome, or three cells each showing loss of the same chromosome, is considered evidence for the presence of an abnormal clone. However, one cell with a normal karyotype is considered evidence for the presence of a normal cell line. Patients whose cells show no alteration or nonclonal (single cell) abnormalities are considered to be normal. An exception to this is a single cell characterized by a recurring structural abnormality. In such instances, it is likely that this represents the karyotype of the mutated subclone in that particular patient.
Aneuploidy—An abnormal chromosome number because of either gain or loss of chromosomes. Banded chromosomes—Chromosomes with alternating dark and light segments as a result of special stains or pretreatment with enzymes before staining. Each chromosome pair has a unique pattern of bands. Breakpoint—A specific site on a chromosome containing a DNA break that is involved in a structural rearrangement, such as a translocation or deletion. Centromere—The chromosome constriction that is the site of the spindle fiber attachment. The position of the centromere determines whether chromosomes are metacentric (X-shaped, e.g., chromosomes 1–3, 6–12, X, 16, 19, 20) or acrocentric (inverted V-shaped, e.g., chromosomes 13–15, 21, 22, Y). During mitosis, the two exact copies of the DNA in each chromosome are separated by shortening of the spindle fibers attached to opposite sides of the dividing cell. Clone—In the cytogenetic sense, this is defined as two cells with the same additional or structurally rearranged chromosome, or three cells with loss of the same chromosome. Deletion—A segment of a chromosome is missing as the result of two breaks and loss of the intervening piece (interstitial deletion). Molecular studies of many recurring deletions have shown that, in each case, the deletions were interstitial, rather than terminal (single break with loss of the terminal segment). Diploid—Normal chromosome number and composition of chromosomes. Fluorescence in situ hybridization (FISH)—A molecular-cytogenetic technique based on the visualization of fluorescently-labeled DNA probes hybridized to complementary DNA sequences from metaphase or interphase cells, used to detect numerical and structural abnormalities. A short nomenclature description is used to describe the results of in situ hybridization. For interphase FISH, the abbreviation “nuc ish” is followed immediately by the locus designation in parentheses (or multiple loci separated by a comma), a multiplication symbol, and the number of signals observed. The number of cells scored is placed in brackets. For example, normal results for the BCR-ABL1 probe are described as “nuc ish (ABL1, BCR)×2[400].” A case with the t(9;22) resulting in the BCR-ABL1 fusion analyzed using a dual-color, dual-fusion probe would be described as “nuc ish (ABL1×3), (BCR×3), (ABL1 con BCR×2)[400].” Haploid—Only one-half the normal complement, i.e., 23 chromosomes. Hyperdiploid—Additional chromosomes; therefore, the modal number is 47 or greater. Hypodiploid—Loss of chromosomes with a modal number of 45 or less. Inversion—Two breaks occur in the same chromosome with rotation of the intervening segment. If both breaks were on the same side of the centromere, it is called a paracentric inversion. If they were on opposite sides, it is called a pericentric inversion. Isochromosome—A chromosome that consists of identical copies of one chromosome arm with loss of the other arm. Thus, an isochromosome for the long arm of No. 17 [i(17)(q10] contains two copies of the long arm (separated by the centromere) with loss of the short arm of the chromosome. Karyotype—Arrangement of chromosomes from a particular cell according to an internationally established system such that the largest chromosomes are first and the smallest ones are last. A normal female karyotype is described as 46, XX and a normal male karyotype is 46, XY. An idiogram is an idealized representation (diagram) of the chromosomes. Pseudodiploid—A diploid number of chromosomes accompanied by structural abnormalities. Recurring Abnormality—A numerical or structural abnormality noted in multiple patients who have a similar neoplasm. Such abnormalities are characteristic or diagnostic of distinct subtypes of leukemia and lymphoma that have unique morphologic and/or immunophenotypic features. Recurring abnormalities represent genetic mutations that are involved in the pathogenesis of the corresponding diseases; many recurring abnormalities have prognostic significance. Translocation—A break in at least two chromosomes with exchange of material. In a reciprocal translocation, there is no obvious loss of chromosomal material. Translocations are indicated by t; the chromosomes involved are noted in the first set of brackets and the breakpoints in the second set of brackets. The Ph translocation is t(9;22)(q34.1;q11.2). Nomenclature symbols:
|
METHODS THAT COMPLEMENT KARYOTYPE ANALYSIS
Cytogenetic analysis of human tumors is often technically difficult because of the presence of multiple abnormalities and requires highly skilled personnel. These factors have led investigators to seek alternative methods for identifying chromosomal abnormalities, such as fluorescence in situ hybridization (FISH).4 The FISH technique is based on the same principle as Southern blot analysis, namely, the ability of single-stranded DNA to anneal to complementary DNA.4 FISH can be performed on marrow or blood films, or fixed and sectioned tissue, as it does not require dividing cells. The target DNA is the nuclear DNA of interphase cells, or the DNA of metaphase chromosomes that are affixed to a glass microscope slide. Commercial probes are now available for the most common abnormalities, and are directly labeled with fluorochrome, which simplifies the technique by eliminating the probe preparation and detection steps. With the development of dual- and triple-pass filters, most laboratories now have the capacity to hybridize and detect two to three probes simultaneously. Table 13–1 summarizes the most frequently used commercially available FISH probes. Several types of probes can be used to detect chromosomal abnormalities by FISH. Hybridization of centromere-specific probes has been used to detect monosomy, trisomy, and other aneuploidies in both leukemias and solid tumors, as well as the sex chromosome complement in the transplant setting (Fig. 13–1).
Figure 13–1.
Fluorescence in situ hybridization (FISH) analysis. Panels B and D illustrate images of metaphase and interphase cells following FISH; the cells are counterstained with 4,6-diamidino-2-phenylindole-dihydrochloride (DAPI). A. Schematic of the BCR and ABL1 loci, location of the BCR and ABL1 dual fusion probe (Vysis, Inc), and configuration of signals in interphase cells. B. Hybridization of the BCR-ABL1 dual fusion probe to metaphase and interphase cells with the t(9;22). In cells with the t(9;22), only one green and one red signal is observed on the normal 9 and 22 homologs, and two yellow fusion signals (arrows) are observed on the der(9) and the der(22) (Ph) chromosomes as a result of the juxtaposition of the ABL1 and BCR sequences. C. Schematic of the KMT2A/MLL gene, location of the KMT2A break-apart probe (Vysis, Inc.), and configuration of signals in interphase cells. D. Hybridization of the KMT2A break-apart probe to metaphase and interphase cells with a t(11q23.3). In cells with a KMT2A translocation, a yellow fusion signal is observed for the germline configuration on the normal chromosome 11 homolog, a green signal is observed in the der(11) chromosome, and a red signal is observed on the partner chromosome.
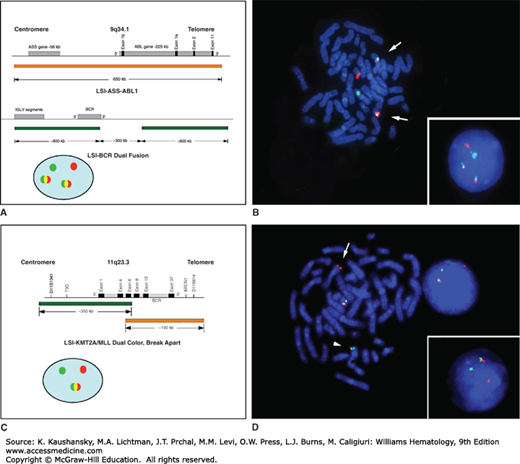
Translocations and deletions can also be identified in interphase or metaphase cells by using genomic probes that are derived from the breakpoints of recurring translocations or within the deleted segment (see Fig. 13–1). In some cases, FISH analysis provides more sensitivity, in that cytogenetic abnormalities have been identified by FISH in samples that appeared to be normal by conventional cytogenetic analyses. Advantages of FISH include (1) the rapid nature of the method and the ability to analyze large numbers of cells; (2) its high sensitivity and specificity; and (3) the ability to obtain cytogenetic data from samples with a low mitotic index or from terminally differentiated cells. A further increase in sensitivity in cases with a low percentage of malignant cells can be achieved by performing FISH analysis on samples that have been enriched previously for specific subpopulations of cells. For example, the use of FISH in combination with plasma cell enrichment techniques is routinely applied in the clinical setting to maximize the detection rate of specific chromosome rearrangements in myeloma.5,6 The major disadvantage of FISH testing is the inability to interrogate more than a few abnormalities. FISH is most powerful when the analysis is targeted toward those abnormalities that are known to be associated with a particular tumor or disease. In a clinical setting, cytogenetic analysis could be performed at the time of diagnosis to identify the chromosomal abnormalities in an individual patient’s malignant cells. Thereafter, FISH with the appropriate probes could be used to detect residual disease or early relapse, and to assess the efficacy of therapeutic regimens. For example, the use of FISH to detect the t(9;22) in CML patients following therapy with an oral tyrosine kinase inhibitor, or sex chromosome determination after a sex-mismatched transplant, is widespread. Material from patients newly presenting are often analyzed most efficiently by conventional cytogenetic analysis, combined with quantitative reverse transcriptase polymerase chain reaction (qRT-PCR) analysis if a specific chromosome rearrangement is suspected, for example, a BCR-ABL1 fusion. Molecular qRT-PCR monitoring of the blood and marrow of CML patients is now part of the recommended testing for patient followup.7
Several microarray-based technologies play an important role in the diagnosis and experimental analysis of hematologic malignancies, including high-density copy number/single nucleotide polymorphism (SNP) array testing (also known as chromosomal microarray analysis [CMA]), microarray-based gene expression profiling, and high-throughput SNP genotyping. CMA allows genome-wide detection of copy number abnormalities (deletions and duplications) at a much higher resolution than karyotyping; it also enables detection of loss of heterozygosity (LOH) that occurs without concurrent changes in the gene copy number, that is, uniparental disomy (UPD) (Chap. 10), and can be attributed to somatic mitotic recombination (also referred to as copy-neutral LOH) (Fig. 13–2). CMA is clinically available as an adjunct test to karyotyping and FISH, and it facilitates detection of genomic abnormalities in a substantial proportion of patients with myelodysplastic syndromes (MDSs) and leukemia with a normal karyotype; it can also be used as a cost-effective alternative to large panels of FISH probes, and as a very useful tool to characterize chromosomal abnormalities of uncertain significance. Microarray-based gene expression profiling has been applied to study a variety of hematopoietic malignancies, often revealing complex but unique expression signatures for each disease subtype. For example, gene expression profiling has shown that diffuse large B-cell lymphoma (DLBCL) comprises at least three different subtypes—germinal center B-cell (GCB)-like, activated B-cell (ABC)-like, and primary mediastinal B-cell lymphoma (PMBL)—each with a distinct oncogenic mechanism, prognosis, and response to therapies (Chap. 98).8 Expression profiling studies led to the recognition of a novel genetic subtype of high-risk B-cell acute lymphocytic or lymphoblastic leukemia (ALL), which has a similar expression signature as Ph-chromosome-positive ALL (Chap. 91).9,10 High-throughput array-based SNP genotyping, enabling the analysis of large numbers of cases and controls, has facilitated genome-wide association studies for the identification of disease susceptibility loci.11 Future diagnostic evaluation, identification of high-risk cases and management decisions will be increasingly based on genomic and even proteomic profiling of patients’ germline and tumor samples, which will likely utilize a combination of array-based and next-generation sequencing–based technologies.
Figure 13–2.
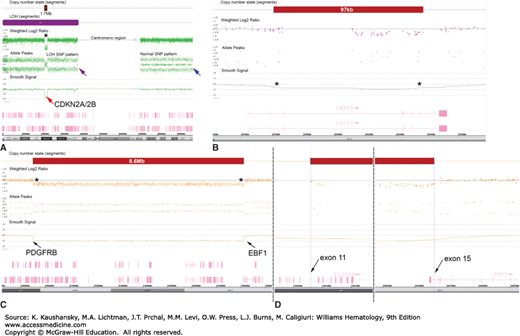
Representative results for three B-cell ALL samples illustrating detection of submicroscopic deletions and LOH by CMA. A. A 1.7-Mb deletion affecting the CDKN2A and CDKN2B tumor suppressor genes at 9p (shown by the dark bar on the top and the red arrow). The deletion is accompanied by an extended region of a copy-number neutral LOH affecting the entire short arm of chromosome 9 (indicated by the purple bar) and resulting in biallelic loss of CDKN2A and CDKN2B. The normal SNP pattern is indicated with a blue arrow, whereas the abnormal pattern associated with LOH is identified by the purple arrow. B. IKZF1 deletion detected by SNP array is associated with an adverse treatment outcome of pediatric B-cell ALL patients. C. Array plot showing 5q32-q33.3 deletion that fuses the PDGFRB and EBF1 genes in a case of Ph+-like ALL (D).
SPECIFIC CLONAL DISORDERS
The first consistent chromosomal abnormality in any malignant disease was identified in CML (Chap. 89). The Philadelphia (Ph) chromosome results from a translocation involving chromosomes 9 and 22, t(9;22)(q34.1;q11.2), (Fig. 13–3), and arises in a pluripotential stem cell that gives rise to both lymphoid and myeloid lineage cells. The standard t(9;22) is identified in approximately 92 percent of CML patients, whereas 6 to 8 percent have variant translocations that involve a third chromosome in addition to chromosomes 9 and 22 (see Chap. 89, Fig. 89–8). The genetic consequences of the t(9;22) or the complex translocations are to move a segment of the Abelson (ABL1) oncogene on chromosome 9 next to a segment of the BCR gene on 22. Analyses of leukemia cells from rare patients with typical CML lacking the t(9;22) has revealed a rearrangement involving ABL1 and BCR that is detectable only at the molecular level (1 to 2 percent of cases).12
Figure 13–3.
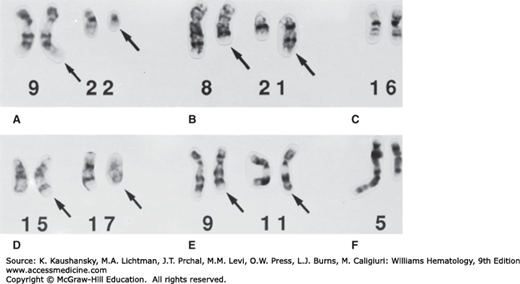
Partial karyotypes from trypsin-Giemsa-banded metaphase cells depicting recurring chromosomal rearrangements observed in myeloid leukemias. The rearranged chromosomes are identified with arrows. A. t(9;22)(q34.1;q11.2), CML. B. t(8;21)(q22;q22.3), AML-M2. C. inv(16)(pl3.1q22), AMMoL-M4Eo. D. t(15;17)(q24.1;q21.1), APL. E. t(9;11)(p21.3;q23.3), AMoL-M5. F. del(5)(q13q33), t-AML.
The t(9;22) and resultant BCR-ABL1 fusion is the sine qua non of CML.12 The BCR-ABL1 fusion protein is located on the cytoplasmic surface of the cell membrane and acquires a novel function in transmitting growth-regulatory signals to the nucleus via the RAS/MAPK, phosphatidylinositide 3′-kinase (PI3K)/AKT, and Janus kinase (JAK)/signal transducer and activator of transcription (STAT) signal transduction pathways. The tyrosine kinase activity of the BCR-ABL1 fusion protein can be specifically inhibited by several commercially available oral tyrosine kinase inhibitors (TKIs): imatinib mesylate (Gleevec/STI571, Novartis Pharmaceuticals, East Hanover, NJ), dasatinib (Sprycel, BMS-354825, Bristol-Myers Squibb, Princeton, NJ), and nilotinib (Tasigna, AMN107, Novartis Pharmaceuticals, East Hanover, NJ) (Chap. 89). Additional oral agents are also being tested in clinical trials.13,14 The BCR-ABL1 translocation can be detected by cytogenetic and FISH analysis, qRT-PCR, and Southern blot analysis to diagnose the disease and detect residual disease. Studies of patients treated with TKIs show a strong correlation between BCR-ABL1 levels as measured in the blood by qRT-PCR and the percentage of Ph+ cells in the marrow.
Several types of genetic changes are associated with imatinib resistance, including point mutations leading to amino acid substitutions in the BCR-ABL1 kinase domain that interfere with imatinib binding, as well as the acquisition of additional copies of the Ph chromosome or BCR-ABL1 gene amplification, both of which can be detected by FISH.14 Besides duplications of the BCR-ABL1 fusion, additional TKI resistance-associated genomic lesions, including acquired regions of LOH on chromosomes 1, 8, 9, 17, 19, and 22, have been detected by SNP array analysis.15 Although some patients who achieve a complete cytogenetic response on imatinib develop clonal karyotypic abnormalities, most commonly +8, −7, or del(20q), the majority of them do not go on to develop the clinical features of MDS.16 The significance of these early findings will be elucidated by the analysis of a large number of patients who have had complete cytogenetic responses to TKIs and are being followed prospectively.
As they enter the more aggressive stages of accelerated and blast phase disease, historically 80 percent of CML patients showed karyotypic evolution with the appearance of new chromosomal abnormalities in very distinct patterns in addition to the Ph chromosome. A change in the karyotype was considered to be a grave prognostic sign.17 The most common changes, a gain of chromosomes 8 or 19, or a second Ph chromosome (by gain of the first), or an i(17q), frequently occurred in combination to produce modal chromosome numbers of 47 to 50. Other genetic changes identified in CML in blast crisis include mutations in the TP53, RB1, MYC, CDKN2A (p16), KRAS/NRAS, or RUNX1/AML1 genes. With the advent of TKI therapy, the natural history of CML has been altered, and the karyotype in blast phase appears to differ from that seen previously. However, the pattern of abnormalities is not yet well described.
Rarely, marrow biopsies from patients will appear similar to those patients with CML, but will lack a Ph chromosome or the BCR-ABL1 fusion. Most often these patients have a MDS or myeloproliferative neoplasm (MPN), most commonly chronic myelomonocytic leukemia, refractory anemia with excess blasts (RAEB), or the poorly understood disorder of “atypical CML.” Some of the latter have JAK2V617F mutations and a phenotype consistent with chronic neutrophilic leukemia (Chaps. 84 and 89). Cytogenetic analysis of marrow biopsies from these patients commonly have a normal karyotype, +8, +13, del(20q), or i(17q). These patients have a substantially shorter survival than do those whose cells have the t(9;22). Because each of the oral TKIs blocks kinase activities in addition to BCR-ABL1, they have proven to be effective in other disorders, including chronic MPNs with platelet-derived growth factor receptor (PDGFR)-β rearrangements, a myeloproliferative variant of hypereosinophilic syndrome that expresses the FIP1L1-PDGFRA fusion protein, and in patients with mast cell malignancies that express an activating point mutation in KIT (Chap. 89).18
A cytogenetically abnormal clone is present in 15 percent of untreated polycythemia vera patients compared with 40 percent of treated patients (Table 13–2).19 When the disease transforms to acute myeloid leukemia (AML), almost 100 percent have a cytogenetically abnormal clone. The presence of a chromosome abnormality at diagnosis does not necessarily predict a short survival or the development of leukemia. However, a change in the karyotype may be an ominous sign. Marrow cells frequently contain additional chromosomes (+8 or +9). Trisomy 8 and 9 may occur together which is otherwise rare.19 Structural rearrangements most often involve a del(13q) or del(20q), noted in 30 percent of patients. Loss of chromosome 7 (20 percent) and del(5q) (40 percent) are often observed in the leukemic phase, and may be related to the prior treatment received by these patients (Chap. 84).
| Disease | Chromosome Abnormality | Frequency | Involved Genes* | Consequence | |
|---|---|---|---|---|---|
| CML | t(9;22)(q34.1;q11.2) | ~99%† | ABL1 | BCR | Fusion protein–altered cytokine signaling pathways, genomic instability |
| CML blast phase | t(9;22) with +8, +der(22)t(9;22), +19, or i(17q) | ~70% | |||
| PV | +8 +9 del(20q) del(13q) partial trisomy 1q | 20% (all abnormalities combined) | |||
| PMF | +8 +9 −7/del(7q) del(5q)/t(5q) del(20q) del(13q) partial trisomy 1q | 30% (all abnormalities combined) | |||
| AML | t(8;21)(q22;q22.3) | 10% | RUNX1T1/ETO | RUNX1/AML1 | Fusion protein–altered transcriptional regulation |
| t(15;17)(q24.1;q21.1) | 9% | PML | RARA | Fusion protein–altered transcriptional regulation | |
| inv(16)(p13.1q22) or t(16;16)(p13.1;q22) | 5% | MYH11 | CBFB | Fusion protein–altered transcriptional regulation | |
t(9;11)(p21.3;q23.3) t(10;11)(p12;q23.3) t(11;17)(q23.3;q25) t(11;19)(q23.3;p13.3) t(11;19)(q23.3;p13.1) t(6;11)(q27;q23.3) Other t(11q23.3) del(11)(q23) | 5–8% for all t(11q23.3) | MLLT3/AF9 MLLT10/AF10 KMT2A KMT2A KMT2A MLLT4/AF6 KMT2A | KMT2A/MLL KMT2A MLLT6/AF17 MLLT1/ENL ELL KMT2A | KMT2A histone methyltransferase fusion proteins–altered chromatin structure and transcriptional regulation | |
+8 +11 −7 or del(7q) del (5q)/t(5q) t(6;9)(p23;q34.1) inv(3)(q21.3q26.2) or t(3;3) del(20q) t(12p) or del(12p) | 8% 1–2% 14% 12% 1% 2% 5% 2% | KMT2A DEK MECOM/EVI1 | NUP214/CAN | Internal tandem duplication Overexpression of MECOM | |
| Therapy-related MDS/AML | −7 or del(7q) del(5q)/t(5q) der(1;7)(q10;p10) dic(5;17)(q11.1–13;p11.1–13) t(9;11)(p21.3;q23.3)/t(11q23) t(11;16)(q23.3;p13.3) t(21q22.3) t(3;21)(q26.2;q22.3) | 45% 40% 2% 5% 3% 2% (t-MDS) 2% 3% | MLLT3 KMT2A RUNX1/AML1 MECOM | TP53 KMT2A CREBBP RUNX1 | Loss of function–DNA damage response KMT3A histone methyltransferase fusion proteins–altered transcriptional regulation Overexpression of MECOM |
MDS (Unbalanced) | +8 −7/del(7q)‡ del(5q)/t(5q)‡ del(20q) −Y i(17q)/t(17p)‡ −13/del(13q)‡ del(11q)‡ del(12p)/t(12p)‡ del(9q)‡ idic(X)(q13)‡ | 10% 12% 15% 5–8% 5% 3–5% 3% 3% 3% 1–2% 1–2% | TP53 | Loss of function, DNA damage response | |
| (Balanced) | t(1;3)(p36.3;q21.2)‡ t(2;11)(p21;q23.3)/t(11q23.3)‡ inv(3)(q21.3q26.2)/t(3;3)‡ t(6;9)(p23;q34.1)‡ | 1% 1% 1% 1% | MMEL1 RPN1 DEK | RPN1KMT2AMECOM/EVI1NUP214 | Deregulation of MMEL1–transcriptional activation? KMT2A fusion protein-altered transcriptional regulation Altered transcriptional regulation by MECOM Fusion protein-nuclear pore protein |
| CMML | t(5;12)(q32;p13.2) | ~2% | PDGFRB | ETV6/TEL | Fusion protein–altered signaling pathways |
Cytogenetic analysis of cells from patients with primary myelofibrosis has revealed clonal abnormalities in 60 percent of patients (Chap. 86).19 These abnormalities are similar to those noted in other myeloid disorders. The most common anomalies are +8, −7, or a del(7q), del(11q), del(13q), and del(20q).19 A change in the karyotype may signal evolution to AML. Fewer than 10 percent of patients with essential thrombocythemia have an abnormal clone (Chap. 85). Recurring abnormalities include +8 and del(13q). Although del(5q) and inv(3)/t(3;3) are associated with thrombocytosis, they are characteristic of MDS or AML, rather than essential thrombocythemia.
Mutant JAK2V617F is a constitutively active tyrosine kinase that activates the STAT, PI3Ks, and mitogen-activated protein kinases (MAPKs) signalling pathways downstream of the erythropoietin receptor, thrombopoietin receptor, or the granulocyte colony-stimulating factor (G-CSF) receptor to promote proliferation and transformation of hematopoietic progenitor cells (Chap. 84). JAK2 mutations occur in polycythemia vera (95 percent), essential thrombocythemia (approximately 50 percent), and myelofibrosis (approximately 50 percent) (Chaps. 84 to 86).20 In refractory anemia with ring sideroblasts (RARS) with thrombocytosis (RARS-t), a MDS/MPN, unclassified by the World Health Organization (WHO) classification, 60 percent of patients have the JAK2V617F mutation, and present with higher white blood cell and platelet counts (Chap. 87).21 Less commonly, activation of the JAK-STAT pathway in MPNs may result from JAK2 exon 12 mutations (1 to 2 percent of polycythemia vera cases) or mutation of the thrombopoietin receptor, MPL (approximately 2 percent of essential thrombocythemia and approximately 5 percent of myelofibrosis). The majority of essential thrombocythemia and myelofibrosis patients with nonmutated JAK2 carry somatic mutations in the calreticulin gene (CALR) (Chaps. 85 and 86).22,23
Related posts:

Stay updated, free articles. Join our Telegram channel

Full access? Get Clinical Tree


