The clinical manifestations of intracranial tumors are usually referable to the anatomic area of the brain involved or adjacent structures. Some anatomic regions may allow a tumor to reach substantial size while remaining clinically silent. In contrast, small lesions in critical areas are more likely to present early. The initial diagnosis of intracranial tumors is most efficiently made by imaging. This article discusses the clinicoanatomic features and imaging characteristics of brain tumors, including the use of dynamic susceptibility-weighted, T1 dynamic, diffusion, functional, and diffusion tensor imaging.
- •
The initial diagnosis of intracranial tumors is most reliably and efficiently made by imaging.
- •
Diffusion-weighted imaging and diffusion tensor imaging can be best understood as special cases of diffusion imaging.
- •
The implementation of perfusion (DSC) and T1 dynamic imaging (DCE) requires careful consideration of technical aspects, both in image acquisition and post-processing.
- •
Distinguishing between early recurrence/pseudoprogression, recurrent tumor/delayed treatment effect, and true response/pseudoresponse has become increasingly complex because of the effects of antiangiogenic therapy on conventional (in particular) postcontrast imaging
Introduction
The clinical manifestations of intracranial tumors are myriad and most often referable to the anatomic area of the brain involved or adjacent structures. Some anatomic regions, particularly right frontal, may allow a tumor to reach substantial size while remaining clinically silent. In contrast, small lesions in critical areas (eg, cerebral aqueduct or primary motor cortex) are more likely to present early.
The initial diagnosis of intracranial tumors is most reliably and efficiently made by imaging. Particularly in the acute setting, noncontrast computed tomography (CT) is often the first imaging modality used. In virtually all instances, the identification of an abnormality on noncontrast CT (or in the setting of persistent clinical symptoms) is followed by magnetic resonance imaging (MRI) before and after contrast administration (usually a gadolinium chelate). The use of contrast-enhanced CT scan is, in many centers, restricted to those patients who cannot safely be placed in the magnet.
The value of MRI in defining the preoperative diagnosis, precise anatomic localization for operative planning, detection of response to therapy, discernment of tumor progression, and recognition of treatment-related side effect is based on both the high spatial resolution (<1 mm 3 ) and the large range of tissue characteristics that may be measured.
This article discusses both the clinicoanatomic features and imaging characteristics of brain tumors, including the use of dynamic susceptibility-weighted, T1 dynamic, diffusion, functional, and diffusion tensor imaging.
Imaging techniques
Because imaging is central to the diagnosis and management of intracranial tumors, this article summarizes the predominant imaging techniques used.
CT
The first CT scanner available for patient care was released in 1974 and is largely credited to the work of Ambrose and Hounsfield and Cormack. CT takes advantage of differences in electron density between tissues to produce contrast. Current clinical CT scanners are capable of submillimeter in-plane resolution at acquisition times on the order of 90 seconds for noncontrast brain studies.
The rapidity and ease of CT imaging has fueled the growth in use. The sensitivity and specificity of CT in comparison with MRI varies with specific disease process, but, in general is understood to provide considerably less information than MRI in the setting of infection, tumor, and across a spectrum of neurologic disorders.
MRI
MRI evolved from nuclear magnetic resonance spectroscopy (NMR), for which Bloch and Purcell were awarded the Nobel Prize in 1952 for “their development of new methods for nuclear magnetic precision measurements and discoveries in connection therewith.” The first paper describing the use of these physical properties for imaging was by Lauterbur in 1973.
In brief, clinical MRI produces images in which the pixel intensity is proportional to proton density and influenced by the local magnetic environment. Although a comprehensive discussion of the various pulse sequences that allow image acquisition is beyond the scope of this article, the essentials necessary to understand the biologic substrate being measured by each technique are discussed.
Anatomic Imaging
Anatomic imaging by MRI can be most simply understood in terms of the predominant image contrast, which may originate from spin-lattice (T1) relaxation, spin-spin (T2) relaxation, or susceptibility (T2*). In general, T1-weighted images provide high anatomic resolution and, with contrast administration, an assessment of blood-brain barrier integrity (also called enhancement). T2 imaging is most useful for identifying fluid and edema. T2* is most widely used for identifying blood and the detection of variations in local magnetic environment. This characteristic makes T2* sequences useful for blood flow imaging (ie, functional and perfusion MRI, discussed later).
In addition to preoperative evaluation, MRI has been introduced into operating suites to permit real-time imaging during operation. Studies have shown improvement in extent of tumor resection with the use of intraoperative MRI, but lengthened survival has not been shown. Improving the extent of resection in patients with low-grade gliomas may provide the strongest rationale for intraoperative MRI, with the usefulness in high-grade lesions not clearly shown.
Spectroscopy
Proton magnetic resonance spectroscopy (1H-MRS) is used to quantify metabolites (choline [Chol], creatine [Cr], lactate [Lac] and N-acetyl aspartate [NAA] are the most widely interpreted) within tumor and adjacent tissue. The levels of these metabolites (and their ratios) provides information about the underlying metabolic state.
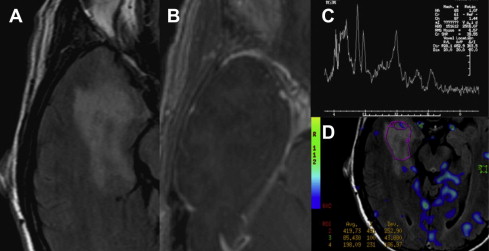
Choline signal is most often compared with Cr as an internal control, a ratio of greater than 3:1 is consistent with a neoplastic process. Increase of the choline signal is thought to be a consequence of increased synthesis and turnover of membrane phospholipids, and correlates with cell density in gliomas. Anaplastic astrocytomas often give higher choline concentrations than does glioblastoma multiforme (GBM), likely because of the presence of necrotic tissue in the latter. Fig. 1 shows an example of increased Cho/Cr and Cho/NAA ratios in this high-grade glioma.
Functional MRI
Functional MRI (fMRI) takes advantage of small variations in T2*-weighted imaging signal, as result of neuronal activity, to identify areas of the brain associated with specific tasks (eg, motor and language). The underlying physical substrate measured is predominantly the changing ratio of oxyhemoglobin/deoxyhemoglobin caused by neurovascular coupling. Measured signal variation is compared with the known functional paradigm producing a statistical map of areas most closely associated (by signal variation) with the task. The resultant images may be imported into the surgical navigation system for intraoperative use.
The relationship between fMRI, intraoperative mapping, and Wada testing has been studied extensively. Both Wada and intraoperative cortical stimulation identify those areas where inhibition (either electrical or pharmaceutical) blocks the behavior being mapped. fMRI is different in that it identifies areas associated with performance of the action, rather than abrogating it. fMRI depends on the nature of the paradigm(s) used, field strength, patient attention, and decisions made at the time of interpretation with respect to what level of statistical significance is judged correct.
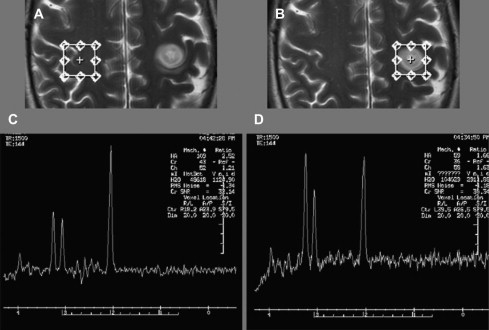
Despite fundamental differences between fMRI and more invasive approaches, outcomes based on fMRI language lateralization after anterior temporal lobe surgery in patients with epilepsy have been reported as superior to Wada testing and have a high concordance with Wada. fMRI has also been reported to accurately localize primary motor cortex. Both expressive and receptive language may be mapped ( Fig. 2 ).
Dynamic Susceptibility-Weighted MRI
Dynamic susceptibility contrast (DSC) imaging is also often referred to as perfusion imaging and has been widely used in stroke care. DSC involves the rapid acquisition of sequential images at a given location(s) as the contrast bolus moves through the brain: the first pass. From the first pass curve, several physical quantities may be derived, including cerebral blood volume (CBV), cerebral blood flow (CBF), and mean transit time (MTT).
The application of DSC to tumor imaging is a more complex undertaking than its use in stroke, which is generally well implemented by any time derivative (eg, MTT ). Of the metrics derived from DSC, CBV has proved to be the most useful in evaluating tumors and treatment effect. The histopathologic substrate reflected in CBV seems to be microvascular density. CBV values are most often normalized to contralateral tissue (nCBV); in many cases, normal white matter is used.
Essential considerations in the application of DSC in tumor imaging include leakage correction (mathematical or by contrast preload), arterial deconvolution (vs simpler mathematical techniques), choice of pharmacokinetic model, the time course and dosing used for preload, and consistent choice of the index tissue for normalization.
Application of DSC to tumor imaging has been shown to be accurate in distinguishing low-grade from high-grade tumors, with CBV as the most useful metric. In both histologically low-grade and high-grade tumors, nCBV seems to provide additional stratification, identifying both low-grade and high-grade tumors that behave more aggressively. Low-grade oligodendrogliomas may have increased rCBV without the same implications of aggressive behavior caused by the increased capillary density in all grades of this histopathologic subset.
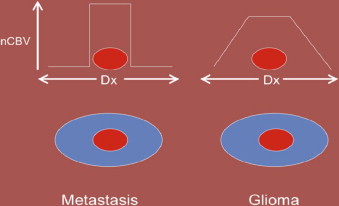
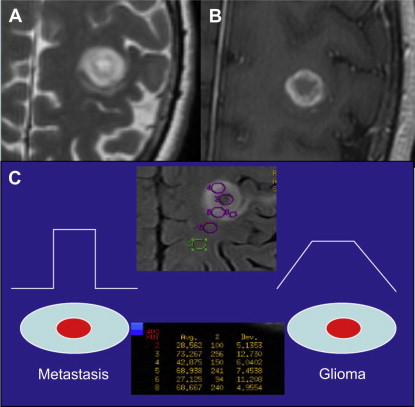
DSC may also aid in distinguishing high-grade glioma from metastatic disease. High-grade glioma tends to infiltrate the adjacent white matter, increasing the nCBV value, whereas, in metastatic disease, the adjacent edema is bland ( Figs. 3 and 4 ).


Dynamic Contrast-Enhanced MRI
Although DSC uses T2*-weighted imaging sequences to indirectly measure capillary density and size, dynamic contrast-enhanced (DCE) imaging measures the rate of T1 signal change with contrast enhancement to approximate capillary permeability and related parameters. CBV may also be measured using DCE techniques.
As with DSC, several metrics may be derived from DCE images, notably extracellular volume (V e ) and permeability (K trans ). Both K trans and V e are good predictors of tumor grade, with correct classification of 92% or more of tumor using discriminant analysis. That DCE imaging is T1 weighted, rather than T2* weighted, has technical benefits compared with DSC imaging: there is less artifact associated with hemorrhage. Our current standard of practice is to perform both: the DCE first (this also preloads contrast), followed by DSC.
Diffusion-Weighted Imaging and Diffusion Tensor Imaging
Diffusion-weighted imaging (DWI) and diffusion tensor imaging (DTI) can be best understood as special cases of diffusion imaging (DI). In brief, DI takes advantage of variation in signal intensity after the application magnetic gradient fields vectors, identical in direction but opposite in magnitude. Using this kind of approach, images based on the diffusibility of water may be produced. In the brain, the major limitation to water motion is cell membranes, so DI provides a measure of cell intactness and density; this limited application of DI is usually referred to as DWI and has broad application, particularly in stroke. When many directions are used, white matter (ie, neuronal axonal membranes) tracts may be identified because of their effect on water motion (DTI).
In oncologic applications, DWI is of particular value in identifying lymphoma, which tends to be densely packed, allowing differentiation from adjacent tissue. DWI may also be used for grading of gliomas and abscess.
Because of greater fine-structure definition, DTI may be of value in differentiating primary and metastatic tumors. A lower rate of diffusion and more isotropic movement are seen in the white matter surrounding primary tumors, presumably because of the presence of infiltrating tumor, compared with the diffusion features of vasogenic edema surrounding a brain metastasis. In densely cellular tumors, there is restriction in the diffusion of water, whereas areas of necrosis or less densely cellular tumor have increased levels of diffusion. Some data also suggest that DTI metrics (planar anisotropy, in particular) may predict tumor aggressiveness, presumably because of the degree of adjacent white matter infiltration.
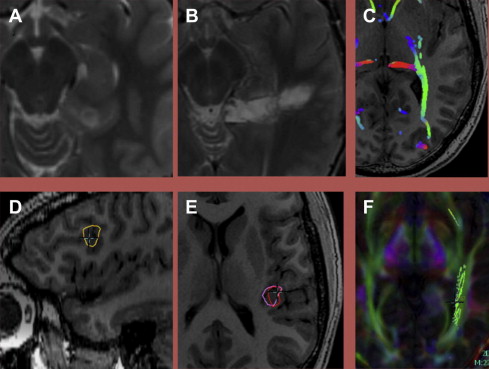
In preoperative planning, DTI can provide maps of white matter fiber tracts (tractography) in brain adjacent to tumors. By elucidating the anatomic relationship of motor and sensory pathway to tumor tissue, DTI has been reported to reduce surgical morbidity. Fig. 2 shows an example in which a posterior mesial temporal tumor is defined relative to the optic radiations.
Imaging techniques
Because imaging is central to the diagnosis and management of intracranial tumors, this article summarizes the predominant imaging techniques used.
CT
The first CT scanner available for patient care was released in 1974 and is largely credited to the work of Ambrose and Hounsfield and Cormack. CT takes advantage of differences in electron density between tissues to produce contrast. Current clinical CT scanners are capable of submillimeter in-plane resolution at acquisition times on the order of 90 seconds for noncontrast brain studies.
The rapidity and ease of CT imaging has fueled the growth in use. The sensitivity and specificity of CT in comparison with MRI varies with specific disease process, but, in general is understood to provide considerably less information than MRI in the setting of infection, tumor, and across a spectrum of neurologic disorders.
MRI
MRI evolved from nuclear magnetic resonance spectroscopy (NMR), for which Bloch and Purcell were awarded the Nobel Prize in 1952 for “their development of new methods for nuclear magnetic precision measurements and discoveries in connection therewith.” The first paper describing the use of these physical properties for imaging was by Lauterbur in 1973.
In brief, clinical MRI produces images in which the pixel intensity is proportional to proton density and influenced by the local magnetic environment. Although a comprehensive discussion of the various pulse sequences that allow image acquisition is beyond the scope of this article, the essentials necessary to understand the biologic substrate being measured by each technique are discussed.
Anatomic Imaging
Anatomic imaging by MRI can be most simply understood in terms of the predominant image contrast, which may originate from spin-lattice (T1) relaxation, spin-spin (T2) relaxation, or susceptibility (T2*). In general, T1-weighted images provide high anatomic resolution and, with contrast administration, an assessment of blood-brain barrier integrity (also called enhancement). T2 imaging is most useful for identifying fluid and edema. T2* is most widely used for identifying blood and the detection of variations in local magnetic environment. This characteristic makes T2* sequences useful for blood flow imaging (ie, functional and perfusion MRI, discussed later).
In addition to preoperative evaluation, MRI has been introduced into operating suites to permit real-time imaging during operation. Studies have shown improvement in extent of tumor resection with the use of intraoperative MRI, but lengthened survival has not been shown. Improving the extent of resection in patients with low-grade gliomas may provide the strongest rationale for intraoperative MRI, with the usefulness in high-grade lesions not clearly shown.
Spectroscopy
Proton magnetic resonance spectroscopy (1H-MRS) is used to quantify metabolites (choline [Chol], creatine [Cr], lactate [Lac] and N-acetyl aspartate [NAA] are the most widely interpreted) within tumor and adjacent tissue. The levels of these metabolites (and their ratios) provides information about the underlying metabolic state.
Choline signal is most often compared with Cr as an internal control, a ratio of greater than 3:1 is consistent with a neoplastic process. Increase of the choline signal is thought to be a consequence of increased synthesis and turnover of membrane phospholipids, and correlates with cell density in gliomas. Anaplastic astrocytomas often give higher choline concentrations than does glioblastoma multiforme (GBM), likely because of the presence of necrotic tissue in the latter. Fig. 1 shows an example of increased Cho/Cr and Cho/NAA ratios in this high-grade glioma.

Functional MRI
Functional MRI (fMRI) takes advantage of small variations in T2*-weighted imaging signal, as result of neuronal activity, to identify areas of the brain associated with specific tasks (eg, motor and language). The underlying physical substrate measured is predominantly the changing ratio of oxyhemoglobin/deoxyhemoglobin caused by neurovascular coupling. Measured signal variation is compared with the known functional paradigm producing a statistical map of areas most closely associated (by signal variation) with the task. The resultant images may be imported into the surgical navigation system for intraoperative use.
The relationship between fMRI, intraoperative mapping, and Wada testing has been studied extensively. Both Wada and intraoperative cortical stimulation identify those areas where inhibition (either electrical or pharmaceutical) blocks the behavior being mapped. fMRI is different in that it identifies areas associated with performance of the action, rather than abrogating it. fMRI depends on the nature of the paradigm(s) used, field strength, patient attention, and decisions made at the time of interpretation with respect to what level of statistical significance is judged correct.
Despite fundamental differences between fMRI and more invasive approaches, outcomes based on fMRI language lateralization after anterior temporal lobe surgery in patients with epilepsy have been reported as superior to Wada testing and have a high concordance with Wada. fMRI has also been reported to accurately localize primary motor cortex. Both expressive and receptive language may be mapped ( Fig. 2 ).

Dynamic Susceptibility-Weighted MRI
Dynamic susceptibility contrast (DSC) imaging is also often referred to as perfusion imaging and has been widely used in stroke care. DSC involves the rapid acquisition of sequential images at a given location(s) as the contrast bolus moves through the brain: the first pass. From the first pass curve, several physical quantities may be derived, including cerebral blood volume (CBV), cerebral blood flow (CBF), and mean transit time (MTT).
The application of DSC to tumor imaging is a more complex undertaking than its use in stroke, which is generally well implemented by any time derivative (eg, MTT ). Of the metrics derived from DSC, CBV has proved to be the most useful in evaluating tumors and treatment effect. The histopathologic substrate reflected in CBV seems to be microvascular density. CBV values are most often normalized to contralateral tissue (nCBV); in many cases, normal white matter is used.
Essential considerations in the application of DSC in tumor imaging include leakage correction (mathematical or by contrast preload), arterial deconvolution (vs simpler mathematical techniques), choice of pharmacokinetic model, the time course and dosing used for preload, and consistent choice of the index tissue for normalization.
Application of DSC to tumor imaging has been shown to be accurate in distinguishing low-grade from high-grade tumors, with CBV as the most useful metric. In both histologically low-grade and high-grade tumors, nCBV seems to provide additional stratification, identifying both low-grade and high-grade tumors that behave more aggressively. Low-grade oligodendrogliomas may have increased rCBV without the same implications of aggressive behavior caused by the increased capillary density in all grades of this histopathologic subset.
DSC may also aid in distinguishing high-grade glioma from metastatic disease. High-grade glioma tends to infiltrate the adjacent white matter, increasing the nCBV value, whereas, in metastatic disease, the adjacent edema is bland ( Figs. 3 and 4 ).
Dynamic Contrast-Enhanced MRI
Although DSC uses T2*-weighted imaging sequences to indirectly measure capillary density and size, dynamic contrast-enhanced (DCE) imaging measures the rate of T1 signal change with contrast enhancement to approximate capillary permeability and related parameters. CBV may also be measured using DCE techniques.
As with DSC, several metrics may be derived from DCE images, notably extracellular volume (V e ) and permeability (K trans ). Both K trans and V e are good predictors of tumor grade, with correct classification of 92% or more of tumor using discriminant analysis. That DCE imaging is T1 weighted, rather than T2* weighted, has technical benefits compared with DSC imaging: there is less artifact associated with hemorrhage. Our current standard of practice is to perform both: the DCE first (this also preloads contrast), followed by DSC.
Diffusion-Weighted Imaging and Diffusion Tensor Imaging
Diffusion-weighted imaging (DWI) and diffusion tensor imaging (DTI) can be best understood as special cases of diffusion imaging (DI). In brief, DI takes advantage of variation in signal intensity after the application magnetic gradient fields vectors, identical in direction but opposite in magnitude. Using this kind of approach, images based on the diffusibility of water may be produced. In the brain, the major limitation to water motion is cell membranes, so DI provides a measure of cell intactness and density; this limited application of DI is usually referred to as DWI and has broad application, particularly in stroke. When many directions are used, white matter (ie, neuronal axonal membranes) tracts may be identified because of their effect on water motion (DTI).
In oncologic applications, DWI is of particular value in identifying lymphoma, which tends to be densely packed, allowing differentiation from adjacent tissue. DWI may also be used for grading of gliomas and abscess.
Because of greater fine-structure definition, DTI may be of value in differentiating primary and metastatic tumors. A lower rate of diffusion and more isotropic movement are seen in the white matter surrounding primary tumors, presumably because of the presence of infiltrating tumor, compared with the diffusion features of vasogenic edema surrounding a brain metastasis. In densely cellular tumors, there is restriction in the diffusion of water, whereas areas of necrosis or less densely cellular tumor have increased levels of diffusion. Some data also suggest that DTI metrics (planar anisotropy, in particular) may predict tumor aggressiveness, presumably because of the degree of adjacent white matter infiltration.
In preoperative planning, DTI can provide maps of white matter fiber tracts (tractography) in brain adjacent to tumors. By elucidating the anatomic relationship of motor and sensory pathway to tumor tissue, DTI has been reported to reduce surgical morbidity. Fig. 2 shows an example in which a posterior mesial temporal tumor is defined relative to the optic radiations.
Glial primary tumors
Low-Grade Diffuse Fibrillary Astrocytomas (World Health Organization Grade II)
The average age at diagnosis of a low-grade astrocytoma is 34 years, although the range of ages is wide. Astrocytomas of low-grade histopathology become progressively less common with increasing age, such that, by age 45 years, a nonenhancing mass lesion is more likely to be high grade than low grade. There is an inverse correlation between increasing age at diagnosis and the time to progression from low to high grade.
Low-grade diffuse fibrillary astrocytomas (LGA; World Health Organization [WHO] grade II) show moderate increase in cell density, which is seen as an expansile region of hyperintense T2-weighted (T2W) signal. There is little, if any, vasogenic edema or enhancement. The presence of enhancement within the mass suggests the presence of high-grade histology. However, the absence of gadolinium enhancement is not reliable evidence of low-grade histology, because one-third of nonenhancing lesions have anaplastic histology at biopsy. Cysts seen on imaging often correlate with the presence of gemistocytes, which is a cell type that implies a tendency to aggressive behavior.
Calcification may be seen, but is less common than with oligodendroglioma. Magnetic resonance spectroscopy (MRS) shows a normal or mildly increased choline/creatine ratio and mildly decreased NAA. There is no evidence of restricted diffusion, and relative cerebral blood volume (rCBV) maps do not show increased CBV. These imaging findings reflect the histopathologic findings of mildly increased cellularity and infiltration of tumor cells into surrounding brain without significant vascular endothelial proliferation, mitotic activity, or necrosis.
An approach based on multiparametric, discriminant analysis using values derived from both DCE and DSC (nCBV, K trans , and V e ) has shown great accuracy in differentiating low-grade from high-grade lesions, correctly classifying 89% of high-grade and 100% of low-grade tumors in a sample of 76 patients.
Patients with low-grade gliomas usually undergo maximal possible tumor resection but then do not receive adjuvant treatment with irradiation or chemotherapy unless there are tumor-related symptoms that limit quality of life (eg, intractable seizures) or there is evidence of rapid tumor growth. Thus, the rationale behind serial imaging surveillance in these patients is the early detection of tumor progression.
Low-grade gliomas often show progression as gradual enlargement of the region of nonenhancing hyperintense T2W signal surrounding the resection cavity. Mandonnet and colleagues found that, in untreated low-grade oligodendrogliomas, there is approximately a 4-mm annual increase in cross-sectional diameter of the tumor. Thus, it is of great importance to compare each new MRI study with prior studies from as long a period as possible to detect the presence of gradual interval growth, which could escape detection if comparison is limited to the most recent prior examination.
Patients with low-grade gliomas may receive treatment when their tumors show growth or when there are symptoms, such as poorly controlled seizures, that might benefit from therapy. Treatment may consist of involved field irradiation or chemotherapy without irradiation. In these patients, response of the tumor may consist of shrinkage of the lesion or stabilization of size, with or without decrease in target symptoms (eg, decrease in seizure frequency). Clinical experience indicates that stabilization is the most common form of response. When shrinkage does occur, it is usually minor in degree and is often apparent only after 1 year or more following initiation of therapy; this is true for both LGA and low-grade oligodendrogliomas and compares with the more rapid responses seen in anaplastic oligodendrogliomas with a loss of the heterozygosity of the short arm of chromosome 1, in which best response is often seen after only 3 months of therapy.
Low-grade adult gliomas have a well-known tendency to become more histologically anaplastic and clinically aggressive over time, evolving toward GBM. This evolution is called anaplastic progression and results from a stepwise accumulation of molecular genetic alterations within tumor cells. Although the numbers are difficult to determine, approximately 50% of LGA undergo radiographically detectable anaplastic progression, with the remainder of LGA showing gradual growth as low-grade lesions.
GBM arising within a known LGA is termed secondary GBM. In contrast, patients whose GBM are diagnosed after a short interval of symptoms and in whom there is no known prior LGA are said to have de novo, or primary, GBM. There are several important distinctions between these 2 types of GBM. De novo tumors typically arise in older adults, and overexpress epidermal growth factor receptor (EGFR) without alterations in TP53. Patients with secondary GBM tend to be younger at the time of diagnosis, inactivate TP53, and do not overexpress EGFR.
In the case of anaplastic progression within low-grade gliomas, a new focus of rapidly growing, contrast-enhancing tumor appears within an existing, nonenhancing mass. The interval from initial diagnosis to anaplastic progression is strongly age dependent. These patients are treated aggressively with irradiation and chemotherapy at the time progression is recognized. The imaging considerations regarding treatment responses in these patients are the same as those described later for high-grade gliomas.
A small group of patients are found to have incidental low-grade gliomas during imaging for some unrelated reason. Shah and colleagues conducted a retrospective review of the available literature, finding no clear evidence for improved outcome with surgical treatment versus serial observation.
Anaplastic Astrocytoma and GBM
High-grade gliomas represent approximately 15% to 20% of all primary intracranial tumors. Anaplastic astrocytoma (AA) and GBM (see Fig. 1 ) constitute high-grade diffuse fibrillary astrocytomas, and are characterized by high cell density, mitotic figures, and vascular endothelial proliferation. Necrosis is a defining feature of GBM. Multifocality is seen in one-third of cases.
Compared with LGA, there is more mass effect, and areas of hemorrhage may produce heterogeneous signal on T1-weighted (T1W) and T2W imaging. Dense cellularity may produce relative hypointensity on T2W images as well as restricted diffusion. Enhancement with gadolinium may be homogeneous or heterogeneous. Irregular peripheral enhancement implies the presence of necrosis, and thus suggests GBM. Smooth linear enhancement around a centrally hypointense area can be seen with cysts in the absence of necrosis. A combination of vasogenic edema and infiltrating tumor cells usually produces extensive surrounding areas of hyperintense T2W signal within the white matter surrounding the enhancing portion of the tumor. High-grade gliomas occasionally do not show enhancement after administration of gadolinium. The peak age incidence is 41 years for AA and 53 years for GBM.
It is often the standard of care to image patients (including postcontrast sequences) after tumor resection to assess for the completeness of resection. The value of this practice in predicting progression-free survival has been shown by several groups showing a direct correlation between extent of resection as determined by postoperative MRI and time to progression.
Patients who are diagnosed with high-grade gliomas (ie, WHO grade III and IV) are usually treated in the postoperative setting with a combination of involved field irradiation and concurrent temozolomide. This has been associated with an increased risk of early treatment-related injury, referred to as pseudoprogression (PP; discussed later). Increasingly, anaplastic oligodendrogliomas with loss of 1p are treated initially with chemotherapy alone, reserving irradiation until there is evidence of tumor progression.
In terms of response, high-grade tumors may show shrinkage, stability, or progression during these treatments. Shrinkage is common only with anaplastic oligodendrogliomas that have a deletion of 1p, and then best response is often seen within 3 months of initiation of therapy. Shrinkage may occur in the size of nodular enhancing disease and in the area of hyperintense T2W signal. Tumor cysts often do not change in size even when the surrounding tumor is shrinking. It has been reported that the change in CBV from baseline may predict high-grade glioma response to conventional therapy.
Stability in the size of the tumor is a more common outcome with treatment, especially with astrocytomas. This fact has lead to the use of progression-free survival, or the duration of stable disease, as a common end point in clinical trials for high-grade gliomas.
Most high-grade gliomas show progressive enlargement within months of diagnosis. Progression most often is declared when there is enlargement of 1 or more enhancing nodules within the tumor, or appearance of a new nodular area of enhancement either locally at the tumor margin or distantly elsewhere in the brain. Increases in size of a tumor cyst and the appearance of hemorrhage when there is stability of the remainder of the lesion does not qualify as tumor progression.
Low-Grade Oligodendroglioma
Low-grade oligodendroglioma (LGO; Fig. 5 ) is a tumor of low to moderate cell density that usually has more well-defined margins with adjacent normal brain than do astrocytomas. There is abundant proliferation of capillaries, and absence of necrosis. These tumors show prominent involvement of cortex in addition to white matter, they often show microscopic spread into the subarachnoid space, and frequently calcify. The frontal and temporal lobes are the most common location.