General Principles
Tumor Growth and Chemotherapy
There are a wide variety of chemotherapeutic agents and a growing number of targeted agents available to treat women with gynecologic cancers. The selection of a treatment regimen should be based on the results of randomized phase III trials, but this may not be possible, particularly when treating patients with uncommon cancers.
Treatment recommendations and choice of drugs are determined by the known efficacy and potential toxicities of chemotherapeutic agents and the clinical context, that is, first-line treatment or treatment for recurrent disease after one or more lines of prior therapy. Most antineoplastic agents have a relatively narrow therapeutic index, and treatment decisions are based on multiple factors, including age, performance status, medical comorbidities, organ function, tumor type, previous chemotherapy, objectives of therapy, and the predicted likelihood of benefit, which should be communicated clearly to the patient and her family (Table 3.1).
It is important to consider the natural history and biology of the cancer being treated. For example, low-grade serous cancers or granulosa cell tumors are typically indolent and slow growing, in contrast to undifferentiated sarcomas, which are rapidly progressive. This may influence decisions regarding initiation of treatment, particularly when chemotherapy is administered with palliative intent. It may be appropriate to withhold or delay chemotherapy in asymptomatic patients with relatively indolent metastatic disease.
It is a fundamental principle that chemotherapy should be administered only to patients in whom the diagnosis of cancer has been confirmed with a biopsy. Cytology may provide acceptable confirmation, depending on the clinical context, for example, in a patient with a large volume of ascites, multiple peritoneal nodules, an adnexal mass, and an elevated CA125 titer, it would be acceptable to give neoadjuvant chemotherapy if the cytology was consistent with a primary ovarian cancer.
All chemotherapeutic agents have potential side effects and potential benefits. It is important to ascertain whether the patient has measurable disease or elevated tumor markers before commencing treatment, particularly in patients with metastatic disease, so that response can be assessed. The extent of previous therapy and the patient’s age, general health, and other relevant medical problems (e.g., neuropathy from long-standing diabetes or prior chemotherapy with taxanes) should all be taken into consideration when deciding on the choice of treatment. The patient’s emotional, social, and financial status must be respected as part of the considerations. It is essential to clearly communicate the aims and objectives of therapy, that is, cure or palliation, the likelihood of benefit, and the side effects of treatment, so the patient can make an informed decision regarding chemotherapy.
Table 3.1 Issues When Considering Cancer Chemotherapy
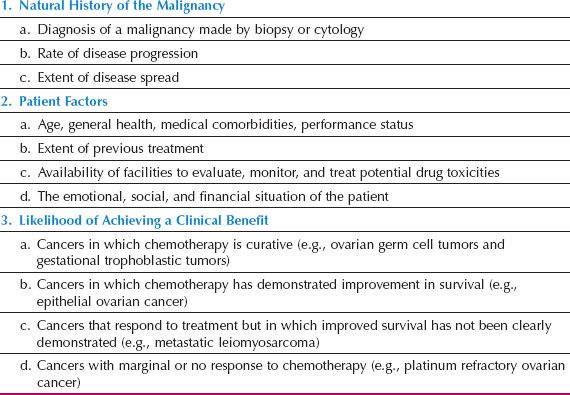
Gynecologic cancers can be grouped into the following three categories, based on the likelihood of chemotherapeutic response and treatment benefit:
1. Highly chemosensitive tumors—treatment administered with curative intent. This group includes ovarian germ cell tumors and gestational trophoblastic tumors, where chemotherapy is curative for most patients. Toxicity is acceptable if the probability of cure is high, but every effort should be made to limit toxicity and reduce side effects without compromising the chance of cure by inappropriate dose reductions or prolonged delay between cycles.
2. Chemosensitive, but cure is uncommon. This group includes advanced high-grade serous epithelial ovarian cancer, where response rates range from 70% to 90%. Chemotherapy increases progression-free and overall survival in patients with advanced ovarian cancer, but the majority of patients will relapse and die of disease.
3. Response to chemotherapy is relatively low. This group includes uterine leiomyosarcomas and platinum-resistant ovarian cancers, and the impact of treatment on overall survival is unclear. In this setting, it is important to consider the patient’s performance status, other medical comorbidities, extent of disease, rate of progression, and symptoms when discussing the relative risks and benefits of cytotoxic drug therapy.
Differential Sensitivity
Most cancer chemotherapeutic agents target DNA in malignant and normal cells. DNA damage results in cancer cell death and is responsible for many of the benefits and side effects of therapy (1). Most combinations of chemotherapy are administered using doses that are close to, or at, the maximum tolerated dose (MTD), based on the concept that a combination of drugs with nonoverlapping mechanisms of action administered at full dose may prevent or delay the emergence of drug-resistant tumor cells, and result in greater cell kill. The therapeutic window between antitumor effect and normal tissue toxicity may be narrow, because there are many similarities between normal cells and malignant cells, particularly those normal cell populations in which constant cell proliferation is common (e.g., bone marrow, gastrointestinal epithelium, and hair follicles). As a result, the differential effect of antineoplastic drugs on tumors compared with normal tissues is quantitative rather than qualitative. Some degree of injury to normal tissue occurs with all chemotherapeutic agents (1). The normal tissue toxicity produced by most chemotherapeutic agents commonly correlates with the intrinsic rate of cellular proliferation in the target tissue, which explains why blood count suppression, mucosal injury, and alopecia are common with many chemotherapeutic regimens.
Therapeutic Index
For any chemotherapeutic agent, the net effect on the patient is referred to as the drug’s therapeutic index (i.e., a ratio of the doses at which therapeutic effect and toxicity occur). The mechanism of action does not distinguish between normal cells and proliferating cancer cells, so there is a narrow therapeutic window between antitumor effect and toxicity (1). Cancer chemotherapy requires a balance of therapeutic effect and toxicity to optimize the therapeutic index, which may be influenced by pharmacologic and biologic factors, including pharmacogenomics in an individual patient.
Biologic Factors Influencing Treatment
Cell Kinetic Concepts
The growth capacity of normal and malignant cells is closely regulated by a complex process of signaling and inhibitory pathways. The increased or selective cytotoxicity of chemotherapy in chemosensitive cancers was previously thought to result from the differential rates of proliferation in normal and malignant cells. It was believed that cancer cells simply grew faster than normal cells, which caused their sensitivity to chemotherapy. This is not the case for most solid tumors, and the efficacy of chemotherapy cannot be explained by this reductionist theory (1). Cancers are characterized by continuous dysregulated cellular proliferation, greater sensitivity to cytotoxic chemotherapy than normal cells, limited ability to repair DNA damage, and cell death through apoptosis (2). For example, ovarian cancers that occur in patients with germline BRCA mutations appear to be much more sensitive to platinum-based chemotherapeutic agents, because of the deficiency in homologous recombination repair, nonhomologous endjoining, and an inability to repair DNA double-strand breaks (DSBs), rather than because of more rapid proliferation.
Patterns of Normal Growth
All normal tissues have the capacity for cellular division and growth. There are three general types of normal tissue growth: static, expanding, and renewing.
1. The static population comprises relatively well-differentiated cells that, after initial proliferative activity in the embryonic and neonatal period, rarely undergo cell division. Typical examples are striated muscle and neurons.
2. The expanding population of cells is characterized by the capacity to proliferate under special stimuli (e.g., tissue injury). Under those circumstances, the normally quiescent tissue (e.g., liver or kidney) undergoes a surge of proliferation with regrowth.
3. The renewing population of cells is constantly in a proliferative state. There is constant cell division, a high degree of cell turnover, and constant cell loss. This occurs in bone marrow, epidermis, and gastrointestinal mucosa.
Normal tissues with a static pattern of growth are rarely seriously injured by drug therapy, whereas renewing cell populations such as bone marrow, gastrointestinal mucosa, and spermatozoa are commonly injured, which explains many of the side effects of chemotherapy.
Cancer Cell Growth
Tumor cell growth represents a disruption in the normal cellular brake mechanisms, resulting in continued proliferation and eventual death of the host. It is not the rate of cellular proliferation per se, but the failure of the regulated balance between cell loss and cell proliferation that differentiates malignant cells from normal cells.
Gompertzian Growth
The characteristics of cancer growth have been assessed by multiple studies in animals and more limited studies in humans. When tumors are extremely small, growth follows an exponential pattern that later seems to slow. In 1825, Gompertz proposed that tumors grow in a sigmoidal pattern, with the fastest growth occurring when tumors are about one-third of their maximum size, with growth slowing as tumors get larger. Experimental models suggest that this observation is the result of decreased cell production, rather than increased cell loss in larger tumors. Put simply, Gompertzian growth means that as a tumor mass increases in size, the time required to double the tumor’s volume also increases. This suggests that small tumors and micrometastases should be more sensitive to chemotherapy (3).
Doubling Time
The doubling time of a human tumor is the time it takes for the mass to double its size. There is considerable variation in doubling times of human tumors. For example, germ cell tumors and some lymphomas have relatively fast doubling times (20 to 40 days), whereas adenocarcinomas and squamous cell carcinomas have relatively slow doubling times (50 to 150 days). In general, metastases have faster doubling times than primary tumors.
If it is assumed that exponential growth occurs early in a tumor’s history and that a tumor starts from a single malignant stem cell, then:
1. A 1-mm mass will have undergone approximately 20 tumor doublings
2. A 5-mm mass (a size that might be first visualized on a radiograph) will have undergone 27 doublings
3. A 1-cm mass will have undergone 30 doublings
When a 1-cm tumor is diagnosed, it is commonly assumed that the tumor was detected early. In reality, it probably has undergone 30 doublings and been present for approximately 60% of its life span (4).
Unfortunately, our current diagnostic methods detect tumors only relatively late in their growth, and metastases may have occurred long before there is obvious evidence of the primary lesion. The second implication of tumor kinetics is that, in late stages of tumor growth, very few doublings in tumor mass have a dramatic impact on the size of the tumor. After a tumor becomes palpable (1 cm in diameter), only three more doublings are necessary to produce a large tumor mass (8 cm in diameter) (4,5).
Cell Cycle
The cell cycle is controlled by a complex system with multiple overlapping checkpoints that regulate progression through the cell cycle (6). Loss of normal cell cycle control and disabled checkpoints are a hallmark of cancer, with somatic events that promote entry and progression through the cell cycle. Cyclins and their associated cyclin-dependent kinases (CDKs) are the key drivers of the cell cycle, and specific transitions in the cell cycle are controlled by specific CDKs (6,7).
Cell cycle progression is controlled by successive changes in cyclin–CDK activity. Several checkpoints can stall the cell cycle in response to genotoxic insults. To minimize the possibility of errors, checkpoints exist at four different points in the cell cycle, G1/S, intra-S, G2/M, and at metaphase to anaphase. The TP53-dependent G1/S checkpoint blocks initiation of DNA replication. The intra-S phase checkpoint is initiated by ATR-CHK1 to stabilize stalled replication forks and block replication. The G2/M checkpoint inhibits mitotic entry, and the spindle assembly checkpoint inhibits anaphase until there is bipolar attachment of chromosomes to microtubules of the mitotic spindle (6,7). The complex cell cycle and its controls are simplified by the classic cell cycle model shown in Figure 3.1.
1. G1 phase (postmitotic phase). Cyclin D–CDK4/6 promotes entry into the cell cycle at the restriction point, and is the initial driver of the G1 phase. This is a period of variable duration when enzymes necessary for DNA and RNA synthesis and other proteins occur in preparation for cell division.
2. S phase (DNA synthetic phase) is the period in which new DNA replication occurs. Cyclin E–CDK 2 activity increases during late G1 and peaks in S phase, and cyclin A–CDK2 complexes are active in S and G2 phases.
3. G2 phase (postsynthetic phase) is the period during which the cell has a diploid number of chromosomes and twice the DNA content of the normal cell. The cell remains in this phase for a relatively short time before it reenters the mitotic phase. Cyclin B–CDK1 is essential for G2–M transition and mitosis. PLK and Aurora A are critical for centrosome maturation, formation of the mitotic spindle, and also play a role in chromosomal segregation and cytokinesis.
4. M phase (mitotic phase) of the cell cycle is the phase of cell division.
5. G0 phase (the resting phase) is the time during which cells are quiescent and do not divide. Cells may move in and out of the G0 phase.
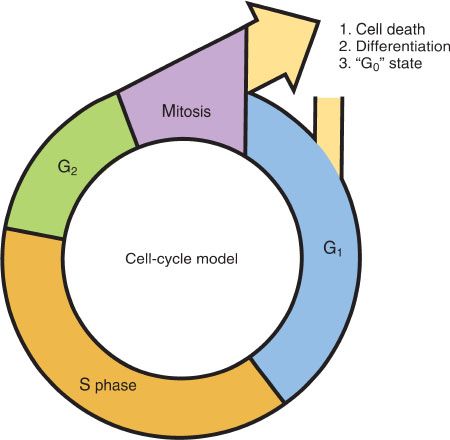
Figure 3.1 The cell cycle. After cell division, a cell can (1) die, (2) differentiate, or (3) enter resting (G0) phase. Cells in the latter two phases can reenter the cycle at G1.
The generation time is the duration of the cycle from M phase to M phase. Variation occurs in all phases of the cell cycle, but the variation is greatest during the G1 period. The two gap phases serve as more than time delays to allow cell growth. They also provide time for the cell to monitor the internal and external environment, to ensure that conditions are suitable and preparations are complete before the cell commits itself to the S phase and mitosis. The G1 phase can vary greatly depending on external conditions and extracellular signals. If extracellular conditions are unfavorable, cells delay progress through G1 and may enter a resting state known as G0, in which they can remain for long periods before resuming proliferation (8).
These cell cycle events have important implications for cancer therapy. Tumors consist of pools of proliferating and nonproliferating or quiescent cells. Dividing cancer cells that are actively traversing the cell cycle are more sensitive to chemotherapeutic agents. Cells in a resting state (G0) are relatively insensitive to chemotherapeutic agents. These may include cancer stem cells and a hypoxic cell population, which are relatively drug resistant (9).
Cell Kinetics
In cell kinetic studies performed on human tumors, the duration of the S phase (DNA synthesis phase) is relatively similar for most human tumors and is about 8 hours while the M phase is about 1 hour. In mammalian cells, the length of the G2 phase is about 2 hours. The length of the G1 phase is highly variable and can range from about 6 hours to several days or longer (10). The length of the cell cycle in human tumors varies from slightly more than half a day to perhaps 5 days. With cell cycle times in the range of 24 hours and doubling times in the range of 10 to 1,000 days, it is clear that only a small proportion of tumor cells are in active cell division at any one time.
Table 3.2 Cell Cycle Specificity of Chemotherapeutic Agents

Two major factors that affect the rate at which tumors grow are the growth fraction and the rate of cell loss from the population due to terminal differentiation or cell death. The growth fraction is the number of cells in the tumor mass that are actively dividing. There is a marked variation in the growth fraction of tumors in humans. In the past, it was thought that human tumors contained billions of cells, all growing slowly. In actuality, there is a small fraction of cells in a tumor mass that is rapidly proliferating, while the remainder, including a stem cell component, are out of the cell cycle and quiescent. Cancer “stem cells” are a small population of the tumor mass. They appear to be relatively chemoresistant, and are thought to be responsible for the high rate of recurrence of many solid tumors. For example, studies have shown an enriched population of cancer stem cells and stem cell pathway mediators in recurrent ovarian cancers, suggesting that these cells contribute to the development of recurrence (11,12). Several developmental pathways, including Notch, Wnt, Hedgehog, and TNF beta, have been shown to be crucial for the regulation and maintenance of ovarian cancer stem cells, and they are potentially amenable to targeted therapies (13).
Cell Cycle–Specific versus Cell Cycle–Nonspecific Drugs
Antineoplastic agents have complex mechanisms of action and induce damage to cells in a wide variety of ways. They may have different sites of action in the cell cycle, and their activity is a function of the proliferative capacity of the tumor being treated. Chemotherapeutic agents can be divided into two main classes based on their site of action in the cell cycle: Cell cycle–nonspecific and cell cycle–specific, although this is an oversimplification of how chemotherapy works (Table 3.2).
Cell Cycle–Nonspecific Cell cycle–nonspecific agents kill in all phases of the cell cycle and have limited dependency on proliferative activity. They have a linear dose response and are active on cells in either a dividing or resting state. They include alkylating agents, antitumor antibiotics, and hormonal therapies.
Cell Cycle–Specific Cell cycle–specific agents act only at particular phases of the cell cycle, and include antimetabolites that are S-phase specific, vinca alkaloids and taxanes that are M-phase dependent, and Bleomycin and Topotecan that are G2-phase dependent. Between these two broad classifications, there is a spectrum of drugs with variable degrees of cell cycle and proliferation dependence (Table 3.3).
Table 3.3 Site of Action in the Cell Cycle

Log Kill Hypothesis
From knowledge of basic cellular kinetics, concepts of chemotherapy have emerged that have proven useful in the design of chemotherapeutic combination regimens (2). In experimental tumor systems in mouse models, survival is inversely proportional to the number of cells implanted, or to the size of the tumor at the time treatment is initiated (14). Treatment immediately after tumor implantation, or when the tumor is subclinical in size, results in a higher chance of cure than if the tumor is clinically obvious and large (14). Skipper’s cell kill hypothesis, published over 60 years ago, suggested that if tumors were treated at the level of micrometastases rather than larger volume tumors, it was more likely that the treatment would be effective. This is supported by the results of adjuvant chemotherapy in many solid tumors.
Skipper used a murine leukemic model to define the concept of logarithmic cancer cell growth and specific log cell kill with chemotherapy (14). They suggested that chemotherapeutic agents work by first-order kinetics; that is, they kill a constant fraction of cells rather than a constant number of cells. This concept has had important implications for the development of chemotherapeutic regimens and adjuvant chemotherapeutic trials. For instance, a single exposure of tumor cells to an antineoplastic drug might be capable of producing 2- to 5-logs of cell kill. With typical body tumor burdens of 1012 cells (1 kg), a single dose of chemotherapy is unlikely to be curative. This explains the need for intermittent courses of chemotherapy to achieve the magnitude of cell kill necessary to produce tumor regression and cure. It also provides a rationale for multiple-drug or combination chemotherapy.
The cure rate in mouse models is significantly improved if only micrometastases are present, that is, 101 to 104 cells, which are too small for clinical detection (14). This is the basis for using adjuvant chemotherapy in apparently localized cancers, when subclinical metastases are likely to be present in many patients.
Drug Resistance and Tumor Cell Heterogeneity
Chemotherapeutic agents often are active when initially used, but tumors commonly develop resistance to chemotherapy (15). Many patients have an initial response and then develop a recurrence that is no longer responsive to the drugs that were previously effective. It is unclear why some cancers, such as germ cell tumors and gestational trophoblastic tumors, are usually cured with chemotherapy, even at an advanced stage, while the majority of solid tumors, such as high-grade serous ovarian cancers, ultimately develop drug resistance (16).
It has been postulated that cancers that are curable with chemotherapy have an increased intrinsic sensitivity to induction of apoptosis by a DNA damaging agent, and have wild-type TP53 (16). Malignant cells with intact function of p53 recognize recombination checkpoints that activate apoptosis in the presence of DNA strand breaks caused by chemotherapy. The majority of germ cell tumors retain intact apoptotic pathways, including the expression of wild-type p53, and these patients respond very well to platinum-based chemotherapy. In contrast, germ cell tumors with p53 mutations are frequently resistant to chemotherapy (17). Similarly, gestational choriocarcinomas express high levels of wild-type p53, have a high BAX: Bcl2 ratio, and high levels of apoptosis (16).
There is a lot of evidence to support the key role of apoptotic pathways in causing cell death in response to chemotherapy, and signaling pathways activated by p53 appear to be very important. Many solid tumors, such as high-grade serous ovarian cancer, are characterized by TP53 mutations, which may explain why recurrence is so common after initial response to chemotherapy (18). There are many possible mechanisms for drug resistance related to the instability of the cancer cell genome, which is characterized by gene amplifications and deletions, rearrangements, and multiple mutations. There is often epigenetic silencing of genes and many cellular mechanisms involved in drug resistance (2,15,18). Resistant tumor cells may display increased deactivation or decreased activation of drugs, allow increased drug efflux, or resist normal drug uptake (15,17–19).
Theories for Overcoming Drug Resistance
It has been suggested that spontaneous mutation to a drug-resistant phenotype occurs in rapidly growing malignant tumors, and this is called the somatic mutation theory (20). The theory suggests that most mammalian tumor cells start with intrinsic sensitivity to antineoplastic drugs, but develop spontaneous resistance at variable rates. This concept—the Goldie–Coldman hypothesis—was applied to the growth of malignant tumors and has important clinical implications (20). A fundamental assumption of this hypothesis is that mutations conferring resistance to chemo-therapy occur in 103 to 106 cells, which are substantially below the level of clinical detection.
Goldie and Coldman (20) developed a mathematical model that relates curability to the initial appearance of singly or doubly resistant cells. Assuming a natural mutation rate, the model predicts a variation in size of the resistant fraction in tumors of the same size and type, depending on the mutation rate and the point at which the first mutation develops. Given these assumptions, the proportion of resistant cells in any untreated tumor is likely to be small, and the initial response to treatment would not be influenced by the number of resistant cells. In clinical practice, this means that a complete remission could be obtained even if resistant cells were present. The failure to cure such a patient, however, would be directly dependent on the presence of resistant cells.
This model of spontaneous drug resistance implies that (20):
1. Tumors are curable with chemotherapy if no permanently resistant cells are present and if chemotherapy begins before resistance develops.
2. If only one antineoplastic agent is used, then the probability of cure diminishes rapidly with the development of a single resistant line.
3. Minimizing the emergence of drug-resistant clones requires multiple effective drugs that are used as early as possible in the course of the patient’s disease.
4. The rate of spontaneous mutation to resistance occurs at approximately the natural frequency of 1 in 10,000 to 1 in 1,000,000 cell divisions.
This model predicts that alternating cycles of treatment should be superior to the sequential use of particular agents, because sequential use of antineoplastic drugs would allow for the development and regrowth of a doubly resistant line. The intrinsic frequency of spontaneous mutation to drug resistance is likely to be influenced by the etiologic factors responsible for tumor development. Lung or bladder cancers, for instance, result from exposure to multiple carcinogenic chemicals and may have a higher spontaneous mutation rate than is seen in other tumors. Under these circumstances, numerous drug-resistant clones may be present before the tumors are clinically evident. This is an attractive theory that could explain the inability of antineoplastic therapy to cure a number of common malignancies (20), but it has not been confirmed in clinical trials using alternating noncross–resistant chemotherapeutic regimens to treat many solid tumors, including breast and ovarian cancer (21–23).
An alternative hypothesis, developed by Norton and Simon, focuses on the Gompertzian growth rates exhibited by malignant tumors (24,25). This mathematical model suggests that the efficacy of treatment for tumors exhibiting sensitivity to particular chemotherapeutic agents will be enhanced if single agents, or combination regimens, are delivered at their optimal dose levels in a so-called dose-dense manner, rather than as alternating regimens.
The fundamental difference between these two models is that in the Goldie–Coldman model, the individual drugs are given in sequence at their optimal levels to produce a cytotoxic effect, whereas in the Norton–Simon model, which focuses on the rapid administration of as many active agents as possible, dose levels of individual drugs will frequently need to be modified because of overlapping toxic effects (e.g., bone marrow suppression).
Randomized trials in breast cancer and ovarian cancer provided evidence in support of the Norton–Simon hypothesis (26,27). High-risk gestational trophoblastic tumors are very chemosensitive, and treatment with EMA-CO every 6 to 7 days is an example of a dose-dense regimen that is highly effective (see Chapter 15).
These models have been useful in progressing clinical trials, developing combination chemotherapeutic regimens, and the timing of adjuvant chemotherapy (28). The simplicity of the models is challenged by the biologic complexity of cancer, and the many nonkinetic reasons why chemotherapy may not work.
Drug Resistance
Resistance to chemotherapy continues to be a major problem in cancer treatment, and can be broadly classified into primary or acquired (15). Primary resistance is a common feature of a number of cancers, such as metastatic uterine leiomyosarcoma and clear cell ovarian cancer. Acquired resistance occurs after an initial response to chemotherapy.
The vast majority of patients with advanced solid tumors will eventually develop acquired resistance, and there are many potential explanations and mechanisms for this (2,11,12,15). Both primary and acquired resistance may be caused by alterations in drug metabolism, including changes in drug uptake, efflux, and detoxification. Enhanced efflux is caused by increased expression of P Glycoprotein and Multidrug Resistance associated Protein1 (MRP1). P Glycoprotein transports a number of hydrophobic agents, such as doxorubicin, paclitaxel, and vinca alkaloids, while MRP-1 transports topoisomerase inhibitors and anthracyclines (19).
Many other mechanisms of resistance to chemotherapy and targeted agents have been described, including modification of drug targets, dysregulation of apoptotic pathways, and enhanced DNA repair (15). Drug-resistant subpopulations may be present before starting chemotherapy, and may be selected out over time. These subpopulations may be made up of cancer stem cells, often quiescent and not cycling, which are intrinsically resistant to chemotherapy (12,13).
Dose Intensity, Dose-Dense, and High-Dose Chemotherapy
Studies in human solid tumors in vitro frequently demonstrate steep dose–response curves, suggesting the importance of administering the maximum tolerated dose, particularly in the first-line setting, or when the aim of treatment is cure or prolongation of survival (29).
Dose intensity (DI) is a measure of the amount of drug delivered per unit of time, generally expressed as mg/m2/wk (30).
Relative dose intensity (RDI) is the ratio of the delivered dose of a single drug (or of several drugs in a combination chemotherapeutic regimen) to the planned dose of the drug.
In very chemosensitive tumors, such as lymphoma and germ cell tumors, there is a steep dose–response curve. Relatively small increases in the dose of chemotherapy will have a substantial effect on the number of tumor cells killed.
Although retrospective data suggest that dose intensity may be important in ovarian cancer, several prospective randomized trials in epithelial ovarian cancer have failed to demonstrate an improved outcome either by increasing the dose of cisplatin or carboplatin per cycle or by extending the duration of treatment beyond six cycles in the first-line setting (31–33). Randomized studies of high-dose chemotherapy (with bone marrow or peripheral progenitor stem cell support) for advanced ovarian cancer also have failed to demonstrate superior survival compared to standard dose regimens (34,35).
Although evidence does not suggest that dose-intensive approaches improve outcome, there is a minimum dose below which response rates and survival will be compromised. In general, the goal should be to maintain dose intensity consistent with an acceptable toxicity in each patient. The severity of neutropenia can frequently be reduced through the administration of a bone marrow stimulatory agent (e.g., granulocyte colony stimulating factor [GCSF]). These drugs can be given prophylactically with certain chemotherapeutic regimens that commonly cause grade 3 or 4 myelosuppression and a high risk of febrile neutropenia.
Mathematical modeling of the growth of tumor cells supports the concept of dose intensification by increasing the frequency of chemotherapy administration: the so-called dose-dense chemotherapy. There is evidence that dose-dense chemotherapy with weekly paclitaxel is more effective than standard 3 weekly dosing in ovarian cancer. The Japanese GOG reported the results of a randomized trial comparing carboplatin and paclitaxel administered every 3 weeks at standard dose with the same dose of carboplatin (AUC = 6) every 3 weeks and paclitaxel given weekly (80 mg/M2) in the experimental arm (27). There was a significantly longer progression-free and overall survival in the experimental arm. This study was repeated in the United States (GOG 252) and in the United Kingdom (ICON 8) to see whether the findings could be replicated in a Caucasian population. It is possible that the benefit may be due to pharmacogenomic variations in Japanese women. The results of these two studies are eagerly awaited.
Pharmacologic Factors Influencing Treatment
Pharmacologically, it is useful to describe effective chemotherapy as concentration over time of the active agent or its metabolite at the primary site of antitumor action. Although it is not possible to determine exact pericellular pharmacokinetics, substantial information on important pharmacokinetic factors is available (36).
Drug effect = drug concentration × duration of exposure (C × T)
Because direct measurements often are not possible, considerable focus is given to plasma concentration × time (C × T) analyses. Many factors influence this pharmacokinetic result, including route of administration and drug absorption, transportation, distribution, biotransformation, inactivation, excretion, and interactions with other drugs.
Route of Administration and Absorption
Traditionally, drugs have been given orally, intravenously, or intramuscularly. Over the past decade, considerable attention has been given to the regional administration of chemotherapeutic agents, particularly in ovarian cancer (37–41). The intraperitoneal approach is based on the finding that the peritoneal clearance of the agent is slower than its plasma clearance and, as a result, an increased concentration of the drug in the peritoneal cavity can be maintained, while plasma concentrations are low.
Studies of a wide variety of chemotherapeutic agents have demonstrated a differential concentration of 30- to 1,000-fold, depending on the molecular weight, charge, and lipid solubility of the drug. Clinical trials in ovarian cancer were performed with IP cisplatin, carboplatin, and paclitaxel combinations (37–41).
Several randomized trials have revealed that the intraperitoneal administration of cisplatin as primary therapy for small volume advanced ovarian cancer (largest tumor nodule within the peritoneal cavity ≤1 cm in maximal diameter) resulted in an improvement in progression-free survival, and an overall survival comparable to intravenous administration, but with increased toxicity (38–40). There is ongoing research with intraperitoneal therapy to develop less toxic regimens (41).
Drug Distribution
Antineoplastic agents usually produce their antitumor effect by interacting with intracellular target molecules. It is critically important that a drug or active metabolite reach the cancer cell in sufficient concentration to have a lethal effect. After absorption, drugs may be bound to serum albumin or other blood components. Their ability to penetrate various body compartments, vascular spaces, and extracellular sites is highly influenced by plasma protein binding, relative ionization at physiologic pH, molecular size, and lipid solubility (36).
Sanctuary Sites
Unique circumstances may produce sanctuary sites, which are areas where the tumor is inaccessible to anticancer drugs and the drug concentration over time is insufficient for cell kill. Examples of such sanctuary sites include the cerebrospinal fluid and areas of large tumor masses with central tumor necrosis and a low oxygen tension.
Cell Penetration
Some drugs enter the target cell by simple diffusion; in other instances, cellular penetration is an active process. As an example, many of the alkylating agents depend on a carrier transport system for cellular penetration. For large macromolecules, it may be necessary for pinocytosis to accomplish cellular entry.
Drug Metabolism
Many antineoplastic agents are active as intact molecules, while others require metabolism to an active form (42). Many of the antimetabolites require phosphorylation for cell entry. The alkylating agent cyclophosphamide requires absorption and liver metabolism to be activated. Attention to these unique metabolic requirements is needed for appropriate drug selection. For example, if direct installation of an alkylating agent is required, an agent that is active as an intact drug should be selected (e.g., Thiotepa), rather than cyclophosphamide, because the latter drug requires hepatic biotransformation. Initial activation is important, as is the rate of metabolic degradation of the active drug or metabolite in determining antitumor activity. As an example, one mechanism of drug resistance in ovarian cancer is increased metabolism of alkylating agents because of increased intracellular enzymes (e.g., glutathione-S-transferase) (42).
Excretion
Most chemotherapeutic agents are excreted through the kidney or liver. Overall, kidney or liver function is critical to normal drug excretion, so it is necessary to modify the dosage of certain agents if either of these organs is functionally impaired.
Certain drugs (e.g., vincristine, doxorubicin, paclitaxel) are excreted primarily through the liver, and others (e.g., methotrexate) are excreted almost entirely by the kidney. Extreme care should be taken with appropriate dose reduction in patients with impaired renal function. Most experimental protocols and cooperative group trials contain formulas for dose modification, or dose omission, for specific organ impairments (43).
Table 3.4 Drug Interactions in Cancer Chemotherapy

Stay updated, free articles. Join our Telegram channel

Full access? Get Clinical Tree


