The reference ranges used to define normal hematocrit, hemoglobin, erythrocyte count, and the erythrocyte indices, change considerably during fetal life as well as in the weeks after birth.1, 2 Consequently, the laboratory findings that define anemia in a fetus or neonate are highly dependent on the gestational and postnatal age. Once anemia is recognized in a fetus or neonate, the differential diagnosis used to seek for the cause is unique from that at all other ages. In this chapter we display the pertinent reference ranges and review the underlying differences in erythropoiesis, erythrocyte structure, function, and metabolism that make anemias in the fetus and neonate so unique.
ERYTHROPOIETIN BIOLOGY IN THE FETUS AND NEONATE
Erythropoietin has both erythropoietic effects and nonerythropoietic effects during human fetal and neonatal development (Table 43.1).3, 4 Although initially described by, and principally known for, its actions on erythroid progenitors, erythropoietin is also an important physiologic growth factor for fetal small intestinal villous enterocytes and neurons.4, 5, 6, 7
Erythropoietin is a constituent of amniotic fluid, in concentrations of 25 to 40 mU/ml. A normal human fetus swallows 200 to 300 ml of amniotic fluid per kilogram body weight per day, and thus swallows 10 to 15 U of erythropoietin/kg/day.8 In humans, erythropoietin does not cross the placenta from maternal to fetal circulations, and it appears that the source of the erythropoietin in amniotic fluid is not the maternal circulation. In the second and third trimesters, amniotic fluid is largely derived from fetal urine, with minor constituents from fetal tracheal effluent and the placenta and fetal membranes. However, erythropoietin in amniotic fluid does not appear to come from fetal urine. The fetal kidney makes little erythropoietin before delivery, and the first-voided urine of neonates generally has no detectable erythropoietin.8 Studies using in situ hybridization and immunohistochemistry indicate that the source of erythropoietin in amniotic fluid is largely maternal: from mesenchymal and endothelial cells in the deciduae and from the amnion.8
Erythropoietin is present in human colostrum and breast milk in concentrations of 10 to 20 mU/ml.4, 5, 6, 7, 8, 9 Erythropoietin concentrations in mother’s milk do not correlate with erythropoietin concentrations in her blood. In fact, over the first weeks of lactation, maternal serum erythropoietin concentrations fall, whereas milk erythropoietin concentrations increase, reaching the highest concentrations in women breast-feeding for a year or more. The source of erythropoietin in breast milk appears to be mammary gland epithelium.7, 8
TABLE 43.1 ACTIONS OF ERYTHROPOIETIN IN THE HUMAN FETUS
Site of Erythropoietin Production
Mechanism of Erythropoietin Delivery to Target Cells
Actions at Target Cells
Hepatocyte/hepatic macrophages
Paracrine
Erythropoiesis/angiogenesis
Glia
Paracrine
Neural migration
Glia
Paracrine
Neural protection from hypoxia
Decidua and amniotic membranes (amniotic fluid)
Swallowed by fetus
Small bowel villous development
Mammary epithelia (breast milk)
Swallowed by neonate
Small bowel villous development
Erythropoietin in human amniotic fluid, colostrum, and breast milk is relatively protected from proteolytic digestion in the fetal and neonatal gastrointestinal tract.8 Rather than being absorbed from the gastrointestinal track into the blood, the erythropoietin swallowed by the fetus and neonate binds to erythropoietin receptors on the luminal surface of villous enterocytes, where it serves topically as a growth and development factor. Indeed, experimental animals artificially fed formulas devoid of erythropoietin have retarded villous development, a condition that can be remedied by enteral recombinant erythropoietin and blocked by antierythropoietin antibody.4, 5, 6, 7, 8, 9
Erythropoietin is produced by cells in the developing central nervous system and is present in relatively high concentrations in fetal cerebrospinal fluid (CSF).10, 11, 12, 13, 14, 15 Among newborn infants, the highest concentrations of erythropoietin in the CSF are seen in the most premature neonates, and by several years of age CSF erythropoietin concentrations are generally below 1 mU/ml.5 Erythropoietin receptors are expressed on human fetal neurons,10, 11, 12, 13, 14, 15 and at least small quantities of recombinant erythropoietin, administered intravenously, cross the blood-brain barrier and appear in the CSF fluid.16 Erythropoietin in the central nervous system is a neuroprotectant from hypoxia. Erythropoietin production increases rapidly in the brain during hypoxia, and when erythropoietin binds to receptors on neurons, antiapoptotic activity is induced. Cell culture systems and whole animal models illustrate a marked neuroprotective effect of erythropoietin.17 The clinical utility of recombinant erythropoietin as a neuroprotectant is a topic of recent and ongoing studies.18, 19, 20, 21, 22
The liver is the primary site of erythropoietin production in the fetus. The kidney does not become the primary site until several months after birth. In the human fetus, the kidney produces about 5% of the total erythropoietin during mid-gestation. The developmental mechanisms regulating the switch in erythropoietin production from the liver to the kidney are not completely known but may involve developmental expression of transcription activators such as hypoxia inducible factor and hepatic nuclear factor 4, or developmental methylation of promoter and enhancer regions. Alternatively, the switch might involve the GATA transcription factors, particularly GATA-2 and GATA-3, which are negative regulators of erythropoietin gene transcription.
Erythropoietin ameliorates experimental damage to the placenta and fetal liver induced by lipopolysaccharide.23 Elevated concentrations of erythropoietin in fetal blood and/or amniotic fluid may indicate fetal hypoxia, and although erythropoietin may have a protective role for some fetal cells, such as neurons, placental, hepatic, and intestinal villous cells, it might also be a marker for poor neurodevelopmental outcome on the basis of severe or chronic hypoxia.23, 24, 25, 26
NORMAL ERYTHROCYTE VALUES DURING HUMAN FETAL DEVELOPMENT
Normal ranges for erythrocyte values of the human fetus and neonate are generally not available. This is because blood is not drawn on healthy neonates to establish such ranges. Instead, reference ranges are used, consisting of the 5th to the 95th percentile values compiled from laboratory tests performed on neonates who were thought to have minimal pathology relevant to the laboratory test, or pathology unlikely to affect the test results significantly. The premise on which the reference range concept is based is that these values approximate normal ranges, although they were admittedly obtained for a clinical reason and not from healthy volunteers.1, 2
Circulating erythrocytes in the mid- and third trimester fetus have features reminiscent of what is called “stress erythropoiesis in adults. These features include marked anisocytosis, poikilocytosis, macrocytosis, and a relatively high percentage of nucleated erythrocytes. Marrow cellularity in the fetus is relatively high, and because the available marrow space is fully cellular, the fetus and newborn infant have little marrow reserve on which to call. Erythroid precursors account for 30% to 65% and myeloid cells 45% to 75% of nucleated marrow cells at birth.27 The myeloid to erythroid ratio at birth is approximately 1.5:1. Marrow cellularity decreases after birth, attaining a density that is normal for adults by 1 to 3 months.28 Initially, this decrease in cellularity results from a rapid decline in red cell precursors. At 1 week of age, erythroid elements account for only 8% to 12% of nucleated cells, and the myeloid to erythroid ratio exceeds 6:1. The normal adult proportion of myeloid to erythroid precursors is not established until the third month. Both the percentage and absolute number of lymphocytes increase during the first 2 months, so that by 3 months of age, they constitute nearly 50% of marrow nucleated cells. Differential counts of bone marrow aspirates from preterm infants are the same as those for term infants.29
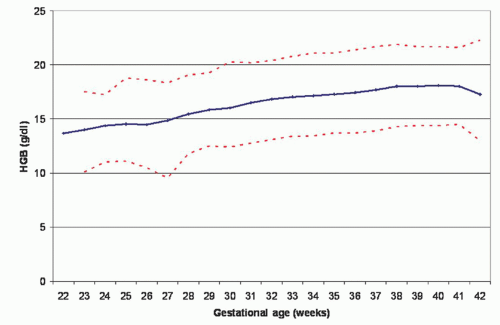
Normal reference ranges for the hemoglobin concentration on the day of birth, at gestational ages ranging from 22 to 42 weeks, are shown in Figure 43.1. The reference ranges gradually increase during this period in utero, and there are no differences between genders.30 After birth, the anatomic site of blood sampling to measure the hemoglobin and hematocrit influences the test result. 1, 2, 31 Perfusion of small vessels in the extremities can be relatively poor, particularly during hypotension or skin cooling, resulting in increased transudation of fluid and hemoconcentration. Consequently, the hemoglobin concentration and packed cell volume of capillary blood are 5% to 10% higher than those of venous blood.2 The difference between capillary and venous values is greatest at birth but disappears by 3 months of age. The discrepancy is greatest in preterm infants and in those with hypotension, hypovolemia, and acidosis.32 Differences can be minimized, but not fully resolved, by warming the extremity before sampling, obtaining freely flowing blood, and discarding the first few drops. The interpretation of serial observations necessitates the consistent use of one site of blood sampling.
FIGURE 43.1. Reference ranges for blood hemoglobin concentration at birth. Values are shown from 24,416 subjects after 22 to 42 weeks gestation. The solid line shows the mean value and the dashed lines show the 5% and the 95% reference range. (From Jopling et al. Reference ranges for hematocrit and blood hemoglobin concentration during the neonatal period; data from a multihospital healthcare system. Pediatrics 2009;123;e333-e337.)
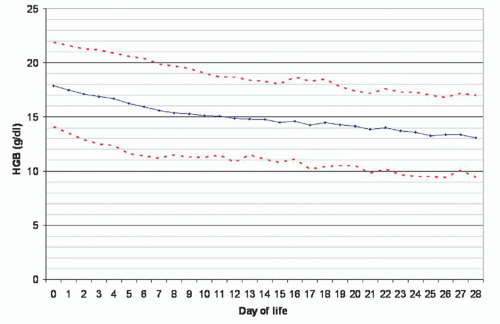
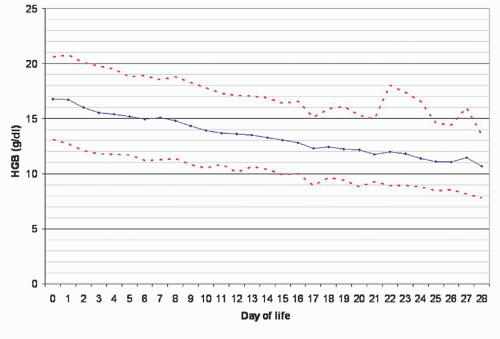
Hemoglobin concentrations increase during the first hours after birth attributable in part to a shift of fluid from the intravascular compartment but also to the transfusion of fetal red cells from the placenta at the time of birth.2 After the first day, the reference ranges for hemoglobin and hematocrit gradually decrease, as shown in Figure 43.2 (term and late preterm neonate) and Figure 43.3 (preterm neonates).
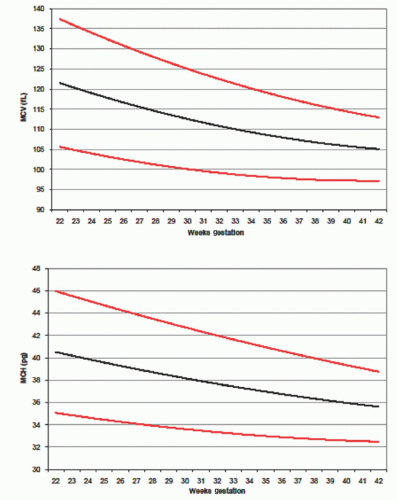
The mean corpuscular volume (MCV) at birth is highly dependent on gestational age, as shown in Figure 43.4.33 Values below the 5th percentile are seen in neonates with α-thalassemia trait or hereditary spherocytosis.34, 35, 36 A low MCV at birth due to fetal iron deficiency is less common, but this can occur with chronic fetomaternal hemorrhage or twin-to-twin transfusion syndrome. The mean corpuscular hemoglobin (MCH), like the MCV, is high at birth, by adult standards, and is highly dependent on gestational age. In contrast, the mean corpuscular hemoglobin concentration (MCHC) does not change with gestational age and should be in the range 33 to 35 g/dl in all neonates whether born prematurely or at term. An MCHC value >36 to 36.5 g/dl can suggest hereditary spherocytosis, particularly if accompanied by an MCV below the reference range for gestational age.35, 36
Reticulocytosis and normoblastosis reflect the accelerated nature of fetal erythropoiesis. Reticulocyte counts at birth are approximately 5%, with a range of 4% to 7%.2 Counts in preterm infants are slightly higher, averaging 6% to 10%. Reticulocytes remain elevated for the first 1 to 2 days of life, then drop abruptly to 0% to 1%.
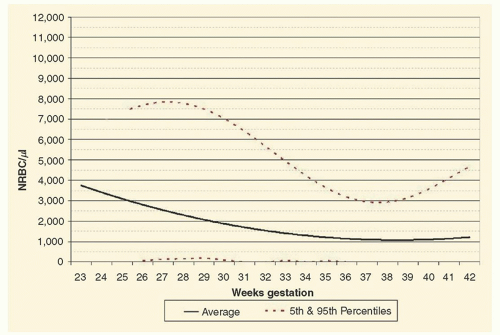
Nucleated red blood cells (NRBC) are seen regularly on blood smears during the first day of life. The reference ranges for NRBC, according to gestational age at birth, are shown in Figure 43.5.37 Elevations in NRBC in preterm infants correlate with adverse outcomes of intraventricular hemorrhage (IVH) and periventricular leukomalacia.37, 38 Elevations in NRBC in term infants correlate with hypoxic ischemic encephalopathy and with adverse neurodevelopmental outcomes.37, 38
FIGURE 43.2. Reference ranges for blood hemoglobin concentration of term and late preterm neonates during the first month after birth. The solid line shows the mean value and the dashed lines show the 5% and the 95% reference range. (From Jopling et al. Reference ranges for hematocrit and blood hemoglobin concentration during the neonatal period; data from a multihospital healthcare system. Pediatrics 2009;123;e333-e337.)
FIGURE 43.3. Reference ranges for blood hemoglobin concentration of neonates 29 to 34 weeks gestation during the first month after birth. The solid line shows the mean value and the dashed lines show the 5% and the 95% reference range. (From Jopling et al. Reference ranges for hematocrit and blood hemoglobin concentration during the neonatal period; data from a multihospital healthcare system. Pediatrics 2009;123;e333-e337.)
Red cell morphology in the newly born preterm or term neonate is characterized by macrocytosis and poikilocytosis. Target cells and irregularly shaped cells are particularly prominent. A high proportion of stomatocytes is noted when viewed by phase contrast microscopy.39 Similarly a high proportion of siderocytes (3.16% vs. normal male adult mean of 0.09%) are seen.40 Differential staining of red cells for fetal hemoglobin (HbF) provides a demonstration of the switch in hemoglobin synthesis that precedes birth: the younger macrocytes contain a minimal amount of HbF, whereas the smaller older cells are rich in HbF.41
Variations in red cell size and shape are somewhat greater than those observed in term infants, and cytoplasmic vacuoles are evident in nearly one-half of all cells when viewed by using interference-contrast microscopy. Red cell survival is shorter in preterm than in term infants. For infants who undergo exchange transfusion or multiple transfusions, both erythropoietin concentrations and reticulocyte counts are lower at any given hemoglobin concentration.42 It had been assumed that oxygen delivery is decreased in newborns because of the presence of a high-affinity hemoglobin, but a leftward shift in the hemoglobin-oxygen dissociation curve due to high levels of HbF might actually better maintain oxygen delivery during episodes of severe hypoxemia.43
The capacity of a fetus or neonate to deliver oxygen to tissues is better estimated by the circulating red blood cell volume than by the hematocrit or hemoglobin concentration. However, measuring the circulating red blood cell volume in a fetus or neonate is particularly difficult. Therefore, either the hematocrit or the hemoglobin is often used in making transfusion decisions. Mock et al. used a nonradioactive method, based on in vivo dilution of biotinylated RBC enumerated by flow cytometry, to estimate the correlation between hematocrit and circulating RBC volume in infants below 1,300 grams, between 7 and 79 days of life. They found that venous hematocrit values correlated highly with the circulating erythrocyte volume (r = 0.907; p < 0.0001).44
FIGURE 43.4. Reference ranges for mean corpuscular volume (MCV) upper panel, and mean corpuscular hemoglobin (MCH) on the day of birth. Values are shown from subjects after 22 to 42 weeks gestation. The solid line shows the mean value and the dashed lines show the 5% and the 95% reference range. (From Christensen et al. The erythrocyte indices of neonates, defined using data from over 12,000 patients in a multihospital healthcare system. J Perinatol 2008;28:24-28.)
Neonates have a shorter red cell survival than do children and adults.45 The life span of red cells from term infants is estimated to be 60 to 80 days with use of the 51Cr method and 45 to 70 days using methods involving 59Fe.45 Fetal studies using [14C] cyanatelabeled red cells in sheep revealed an average red cell life span of 63.6 ± 5.8 days.46 The mean red cell life span increased linearly from 35 to 107 days as the fetal age increased from 97 days (midgestation) to 136 days (term).
Neonatal red cells transfused into adults have a similarly short survival,47 indicating that factors intrinsic to the newborn red cell are responsible. Also, adult red cells survive normally in newborn recipients.48 The life span is not parametrically distributed, in that most cells are destroyed before the mean survival is reached. Shortened red cell survival as well as demands imposed by an expanding red cell mass account for erythropoietic rates at birth that are three to five times higher than those of normal adults.
The abrupt transition from the uterus to an oxygen-rich environment triggers responses that have a profound effect on erythropoiesis. During the first 2 months of life, the infant experiences both the highest and lowest hemoglobin concentrations occurring at any time in development. Although quite variable, erythropoietin levels at birth usually are well above the normal adult range. Erythropoietin levels fall in the immediate postnatal period, with a half-life of 2.6 ± 0.5 hours in infants with polycythemia and 3.7 ± 0.9 hours in infants born to mothers with preeclampsia.49 By 24 hours, the erythropoietin value is below the normal adult range, where it remains throughout the first month. The decrease in erythropoietin is followed by a decline in the number of bone marrow precursors50 and a fall in the reticulocyte count.
The combination of shortened cell survival, decreased production, and growth-related expansion of the blood volume is responsible for a progressive fall of the hemoglobin concentration to a mean of approximately 11 g/dl at 2 months of age.51 The lower range of normal for infants of this age is approximately 9 g/dl. This nadir is called physiologic anemia, because it is not associated with apparent distress and is not prevented with nutritional supplements. Stabilization of the hemoglobin concentration is heralded by an increase in reticulocytes at 4 to 8 weeks.50 Thereafter, the hemoglobin concentration rises to a mean level of 12.5 g/dl, where it remains throughout infancy and early childhood.
FIGURE 43.5. Reference ranges for blood concentrations of nucleated erythrocytes on the day of birth. Values are shown from subjects after 23 to 42 weeks gestation. The solid line shows the mean value and the dashed lines show the 5% and the 95% referenc range. (From Christensen et al. Neonatal reference ranges for blood concentrations of nucleated red blood cells. Neonatology 2010;99:289-294.)
At term, the placenta and umbilical cord contain 75 to 125 ml of blood, or approximately one fourth to one third of the fetal blood volume. The umbilical arteries constrict shortly after birth but the umbilical vein remains dilated, and blood flows in the direction of gravity. Infants held below the level of the placenta can receive half of the placental blood volume (30 to 50 ml) in 1 minute. Conversely, infants held above the placenta can lose 20 to 30 ml of blood back into the placenta per minute.52 The blood volume of infants with early cord clamping averages 72 ml/kg, whereas the volume of infants with delayed cord clamping averages 93 ml/kg. Linderkamp et al. compared postnatal alterations in blood viscosity, hematocrit, plasma viscosity, red cell aggregation, and red cell deformability in the first 5 days in full-term neonates with early (less than 10 seconds) and late (3 minutes) cord clamping.53 The residual placental blood volume decreased from 52 ± 8 ml/kg of neonatal body weight after early cord clamping to 15 ± 4 ml/kg after late cord clamping. The neonatal blood volume was 50% higher in the late cord-clamped infants than in the early cord-clamped infants.
It is possible to promote placental transfer of blood to preterm infants by delaying the clamping of the umbilical cord for 30 seconds. In fact transfer of about 10 ml/k body wt can be expected using this method.54 In a randomized trial by Mercer et al., this maneuver of delayed cord clamping among infants <1,500 grams birth weight resulted in less IVH and less late-onset sepsis.55 An alternative approach involves “milking or “stripping of the umbilical cord after delivery, while the placenta is still attached to the uterus. This maneuver moves fetal blood toward the fetus before the umbilical cord is clamped. Delayed clamping and cord stripping are roughly equivalent means of providing a small transfusion before birth of a very low birth weight (VLBW) infant, thereby reducing the odds that a donor blood transfusion will be needed during the first days after birth when phlebotomies for laboratory tests commonly result in transfusions to replace the rapidly depleted red cell mass.56, 57, 58
FETAL AND NEONATAL ERYTHROCYTE MEMBRANE AND METABOLISM
The erythrocyte membranes of neonates differ slightly from those of adults.59 The percentage of spectrin dimers and the spectrin tryptic peptide patterns are the same as in adult cells60 but neonatal cells have more immunoreactive myosin.61 The quantity and distribution of lipids differ in several respects from adult red cells. Total lipid, phospholipid, and cholesterol are increased out of proportion to the surface area of newborn red cells.62, 63 Neonatal cells also exhibit increased endocytosis in response to membraneactive agents, suggesting that the membranes of neonatal cells are less stable and are capable of greater reorganization.59
Antigen expression differs from that of adult cells. The A, B, S, and Lutheran antigens are present in decreased amounts. Replacement of the i antigen with its adult counterpart I requires its conversion from a linear polylactosamine to a branched polylactosamine.59 Reduced A and B antigenicity may result in part from decreased branching and increased stimulation of glycoproteins on neonatal red cells.64
At term, red cell deformability and viscoelastic properties are normal.65 Similarly, osmotic fragility of erythrocyte from preterm neonates is similar to or even slightly less fragile than erythrocytes of term neonates. However, preterm neonates may have a small subpopulation of cells that are more susceptible to hemolysis, giving preterm infants a greater tendency to develop hemolytic jaundice.66
Increased concentrations of certain erythrocyte enzymes in neonates can be explained by the young mean age of red cells. The increase in glycolytic enzymes is comparable in magnitude to that observed in high-reticulocyte adult blood.67, 68 Increased glycolytic enzyme activity, in turn, is responsible for increased consumption of glucose and galactose and increased levels of adenosine triphosphate (ATP).69 Unique metabolic characteristics of neonatal erythrocytes are summarized in Table 43.2.
TABLE 43.2 METABOLIC CHARACTERISTICS OF FETAL/NEONATAL RED BLOOD CELLS
Metabolic characteristics explained by young mean cell age
Increased enzyme activity
Hexokinase
Aldolase
Triosephosphate isomerase
Phosphoglycerate mutase
Pyruvate kinase
Lactate dehydrogenase
Glucose-6-phosphate dehydrogenase
6-Phosphogluconate dehydrogenase
Glutathione reductase
Glyoxalase I and II
Galactokinase
Galactose-1-phosphate uridyl transferase
Increased glucose and galactose consumption
Increased levels of ATP
Metabolic characteristics distinctive for neonatal red cells
Embden-Meyerhof pathway
Increased activity of phosphoglycerate kinase, enolase, glucose phosphate isomerase, and glyceraldehyde-3-phosphate dehydrogenase
Decreased activity of phosphofructokinase
2,3-Diphosphoglycerate instability
Pentose phosphate pathway and glutathione metabolism
Decreased glutathione peroxidase and glutathione synthetase
Glutathione instability
ATP and phosphate metabolism
ATP instability
Decreased phosphate uptake, slower incorporation of phosphate into ATP and 2,3-diphosphoglycerate
Nonglycolytic enzymes
Decreased enzyme activity
Carbonic anhydrase
Catalase
Cholinesterase
Adenylate kinase
Phosphoribosyl transferase
Cytochrome b5 reductase
ATP, adenosine triphosphate.
The activities of four enzymes in the Embden-Meyerhof pathway—phosphoglycerate kinase, enolase, glucose phosphate isomerase, and glyceraldehyde-3-phosphate dehydrogenase—are increased out of proportion to cell age.70, 71 The activity of phosphofructokinase, a rate-controlling enzyme in glycolysis, is only 40% to 70% of that in adult red cells of comparable age.68, 69, 71 Low levels of phosphofructokinase may produce a block in glycolysis, resulting in the accumulation of glucose-6-phosphate and fructose-6-phosphate and a decrease in the amounts of 2,3-diphosphoglycerate (2,3-DPG) and phosphoenolpyruvate.71 Decreased activity of phosphofructokinase is probably explained by accelerated decay of a less stable fetal isoenzyme.72 Neonatal red cells contain a homotetramer of liver-type phosphofructokinase subunits rather than the heterotetramer of liver and muscle subunits present in adult cells.73 Differences in the relative proportions of isoenzymes have also been described for hexokinase and enolase.74 The concentration of 2,3-DPG falls rapidly during short periods of incubation,69 apparently because of accelerated breakdown. Preterm infants have lower 2,3-DPG concentrations than term infants. These concentrations gradually increase with gestation.75, 76 Concentrations can be increased with the use of erythropoietin, thereby shifting the oxygen dissociation curve to the right.77
Only gold members can continue reading. Log In or Register to continue
 The Diagnostic and Therapeutic Approach to Hematologic Problems


