Tumor growth kinetics
Elizabeth Comen, MD  Teresa A. Gilewski, MD
  Larry Norton, MD
Overview
Kinetics is the study of movement and changes in magnitude over time. Kinetics is a central concept in oncology; cancer progression reflects changes in cancer cell numbers, metastatic sites, and tumor mass as a function of time. It is the purpose of this chapter to illustrate both the practical applications and theoretical implications of one aspect of kinetics—tumor growth kinetics. Just as time and space are inextricably linked so too are growth kinetics and the tumor’s microenvironment. Here we review the kinetics of cellular proliferation and population growth, finding a theoretical basis for improved practices in cancer chemotherapy.
Introduction
Kinetics is the study of movement or, more generally, changes in magnitude—size, shape, distance, velocity, or indeed anything quantifiable—over time. As a science, therefore, kinetics should be considered central to oncology. Cancer is, after all, all about changes in cancer cell numbers, sites of involvement, and tumor mass sizes as a function of time. Morbidity and mortality from cancer is a consequence of such changes, as measured by recurrence-free, progression-free, and overall survival (OS) times. Moreover, at the molecular level, cancer is not a static process, but involves aberrations in gene integrity, copy number and expression, post-translational modification, and RNA and protein production and degradation that are time dependent. Failure to analyze and interpret cancer biology with regard to changes over time, therefore, may miss the essences of phenomena and thereby lead to misinterpretations, both conceptual and clinical.
The purpose of this chapter is to use recent results in cancer research to illustrate both the practical applications and theoretical implications of one aspect of kinetics—tumor growth kinetics, the study of changes in cell number and over time tumor mass—for cancer medicine. In evaluating carcinogenesis within a time-dependent fashion, it is critical to understand the relevance of the space in which cancer cells change over time. Specifically, cancer–stromal interactions uniquely influence cancer growth. Just as time and space are inextricably linked so are growth kinetics and the tumor’s microenvironment. Here, we offer novel insights into how a multitude of cancer processes are best understood by evaluating not simply a kinetic framework but also how the stroma mediates cancer growth.
Some mysteries in cancer medicine
The study of cancer reveals many enigmas, sets of observations that are both true and seemingly incompatible. Identifying enigmas thereby indicates weakness in theories, creating opportunities for progress by hypothesis-testing experimentation. We will examine some of these and then seek their elucidation using kinetic science.
Polygenetic etiology of cancer
As our first example, let us consider the observation that cancer cells manifest myriad changes in gene morphology and copy numbers. This is consistent with the theory that malignancy results from accumulated abnormalities in diverse, somewhat independent genomic processes, the polygenetic concept of cancer. The functionalities associated with such changes include self-sufficiency in growth signals, insensitivity to antigrowth and pro-apoptotic signals, and the abilities to invade, to form metastases, to induce angiogenesis, and to replicate without limit. Yet how is this theory compatible with the equally well-documented observation that carcinomas in situ, which are clinically benign in that they do not metastasize and rarely grow to large sizes, are usually as aberrant genetically as the malignancies they spawn?
The concept of a polygenetic etiology of malignancy presents another mystery, which concerns the strong statistical association of histologic grade, tumor size, and propensity for traveling to regional (largely nodal) and distant sites. These traits are so commonly grouped together that we may forget that they are manifestations of distinct biologic processes: morphogenesis, regulation of mitosis apoptosis, and metastasis, respectively. Indeed, metastatic behavior presents many thought-provoking enigmas. Toward the end of the nineteenth century, Halsted used the prevailing mechanics of his time to hypothesize that the malignant spread of primary breast cancer could be halted by the meticulous removal of a whole breast containing the tumor in contiguity with the ipsilateral axillary contents. The idea behind the radical mastectomy was that cancer cells gain access to the rest of the body by invading lymphatic channels in the breast, channels that then traverse the axilla before connecting with the systemic circulation.
Many observations would seem to support Halsted’s contention. Radical mastectomies did indeed cure some individuals, almost all of whom would have died of metastatic cancer had their breast cancers been left intact—a fact proven by observational studies in the nineteenth century. Also, lymphatic invasion is a powerful prognostic variable. Most compelling is the modern observation that sentinel lymph node mapping confirms a common flow pattern from the breast for lymph and cancer cells. Yet how would one invoke Halsted’s theory to explain how some patients with uninvolved axillary lymph nodes at the time of radical local surgery still develop distant metastases?
Molecular classification versus cancer stem cell concept
Another enigma concerns the classification of tumors by RNA expression profiling. It is unquestionably true that tumors differ in their patterns of gene expression, and that these differences correlate with clinically meaningful endpoints such as disease-free and OS and benefit from chemotherapy.1 Hence, testing a small anatomic sample of a cancerous mass is informative regarding the behavior of the whole cancer, as if all of the cells in the cancer carry the critical information. Yet how can we reconcile this observation with the popular, experimentally derived hypothesis that it is only a tiny minority of cancer cells—“cancer stem cells” or tumor-initiating cells—within the mass that have the capacity to form new tumors?
Cancer as a local versus systemic disease
It is well known that breast cancer is often a systemic disease early in its life-history; this is underscored by the fact that systemic adjuvant therapies like hormonal treatments and chemotherapy improve cancer-free and OS. But how is this compatible with the equally venerable observation that better local control, as by radiation therapy to the remaining breast tissue following breast-conserving surgery, improves survival? Indeed, it seems that for every four cases of local recurrence prevented by radiation therapy, one patient is saved from distant metastases and subsequent death. If the disease is metastatic early, why should local control make any difference at all? Part of the answer may be found in the observation that on detailed histopathological analysis, breast cancer cells are commonly found centimeters away from the clear margins of excised primary tumors. But this raises new questions. How did these cells get there, and what is the relationship between such cells and distant metastases?
Gompertzian growth
Another enigma concerns growth patterns. It has been shown that the growth pattern of breast cancer cannot be explained by simple exponential or linear kinetics, but must follow an S-shaped curve intermediate between these two extremes (Figure 1).2 The evidence is not only from direct clinical observations but also from logical inferences based on clinical observations. For example, based on retrospective analyses of preexisting mammograms after the clinical diagnosis of breast cancer, it has been estimated that an average tumor may take 2 years to grow in size from one cell to 109 or 1010 cells. This number of cells corresponds to a tumor volume of 1–10 cm3 if all of the cells were packed tightly together, which for the sake of this argument is a rational size range for the diagnosis of a primary mass.
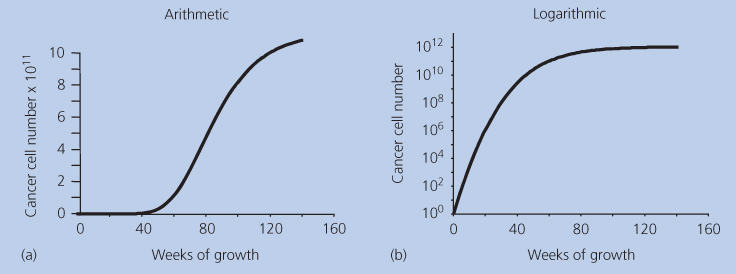
Figure 1 (a,b) Gompertzian growth on two scales.
Now let us consider what would happen should cancers grow in a linear pattern. This means that growth would be from one cell to two cells, then three cells, the four cells, and so on in equal units of time. By this pattern, if it took a tumor 2 years to grow from one cell to this size range (109 or 1010 cells), it would take another 2 years for it to double in size to 2–20 cm3 and yet another 2 years to triple in size to 3–30 cm3. This is clearly an unrealistically slow growth for an untreated primary cancer. Hence, it is extremely unlikely that cancers grow linearly.
Nor is exponential kinetics applicable to real-life examples. An exponential growth pattern involves constant doubling times. That is, if it takes a week for one cell to divide into two cells, by exponential kinetics, it would take another week for those two cells to become four, an additional week for those four to divide into eight, and so on. Many decades ago, Howard Skipper and colleagues used exponential kinetics to explain the growth and response to therapy of a murine leukemia, laying the groundwork for much of the experimental and clinical chemotherapy to follow. But does exponential kinetics apply to human disease? Let us turn again to the case of a primary breast cancer growing from one cell to 109 or 1010 cells over 2 years. Were it to have grown exponentially to this point and continue to grow exponentially thereafter the mass would double in size every 22–24 days, which means that it would reach a size of 4–40 cm3 in <7 weeks from diagnosis. This is an explosive growth rate that is just incompatible with general medical experience. Hence, exponential kinetics cannot apply. Yet, mitosis does produce two cells from one, so early malignant growth at the few-cell stage must be approximately exponential. This is truly an enigma.
The only way to resolve this mystery is to hypothesize that although growth may start in an exponential fashion, there is a progressive deviation toward slower growth as the tumor becomes larger. Of the infinite number of possible decremented exponential curves, one type has been shown to accurately fit actual tumor growth curves.3 This type was defined by Benjamin Gompertz in 1825 and has since been one of the most utilized mathematical formulas in all of biomathematics. It is illustrated in Figure 1 on two different scales of size: arithmetic and logarithmic. The “S” shape is apparent on the arithmetic scale, but on the logarithmic scales, the relative growth rate is seen to be continuously decreasing as the mass grows larger. As will be discussed in depth later, Gompertzian kinetics have proven very useful in designing improved regimens of anticancer chemotherapy, not only in breast cancer—where it was first explored—but also in malignant lymphoma, childhood sarcoma, and other malignant diseases. But if Gompertzian growth kinetics is ubiquitous in nature, what is its (necessarily ubiquitous) etiology?
In this chapter, we will explore these issues—carcinogenesis, the behavior of tumor-initiating cells, pathohistologic grading, and patterns of metastatic spread—using the framework provided by the science of kinetics. We will examine the fundamentals of cell proliferation as a cause of tumor growth and the development of cellular heterogeneity. We will seek in modem molecular science an etiology of Gompertzian growth. We will also illustrate the clinical relevance of growth kinetics in practical cancer medicine with a focus on the therapeutic implications of Gompertzian growth on the dose scheduling of anticancer drugs. We will identify new areas for kinetic research that have implications for prognostication, choice of therapies, the discovery of new therapeutic targets, and the design of prevention strategies.
The kinetics of cellular proliferation
The study of how cancer cells divide provides some insight into these enigmas, but presents mysteries of its own, the contemplation of which may provide further illumination. As tumors are comprised of cancer cells with their supporting stroma, it is reasonable to start a discussion of tumor kinetics by considering the proliferative kinetics of cancer cells.
Assessing growth parameters
Mitosis, or cell division, is the basic biologic process that results in an increase in somatic cell numbers over time. The term growth applies to the increasing volume of a cellular population and is measured in units of volume (cubic centimeters) or weight (milligrams). Growth is largely the consequence of increasing numbers of cells but also can be influenced by the increasing size of the individual cells, edema, and changes in the context of the extracellular matrix, hemorrhage, and infiltration by host cells, such as leukocytes. The term proliferation, in contrast, applies specifically to an increase in the number of cells, which is measured as cell number as a function of time. Cells divide by progressing through a sequence of steps that are collectively called the mitotic or “cell” cycle.
It is important for the student of cell kinetics to understand the methods for assessing cell cycle phases because—as in all areas of science—concepts are inextricably confounded with their means of quantification.4 At the simplest level, metaphase cells may be counted on a microscope slide. This mitotic index is a rough estimate of the percent of cells in M phase. Experimentally, the mitotic index can be improved by a now seldom used method called the stathmokinetic technique, in which a mitotic poison is applied at a known time before counting. The proliferative activity of a tissue may also be estimated by examining microscopic slides after immunohistologic staining for the Ki-67 protein, present in all proliferating cells and absent in nonproliferating cells. Although Ki-67 staining is now mostly used, historically the most productive technique is the thymidine labeling index (TLI). Here, viable cells are exposed briefly in vitro to a radiolabeled precursor of DNA. The most common thymidine label is tritium, but carbon 14 has also been used. The percentage of tumor cells with autoradiographic grains over their nuclei estimates the fraction of cells that were in S phase during the period of thymidine exposure.
Except for the stathmokinetic technique, all of the above are static assays, providing a snapshot rather than a movie of proliferation.5 Nevertheless, the snapshot is of a concept called the growth fraction, the proportion of the cancerous mass that is actually involved in proliferation. Previously, the growth fraction of human leukemias was assessed by the use of the TLI in vivo, now no longer permissible.
A kinetic extension of the TLI is the percentage of labeled mitoses curve. This technique counts, as a function of time after exposure, the number of M phases that contain radioactive label. This measures the cells currently in M phase that had been in S phase during the exposure to radioisotope. Hence, it is the only technique that actually measures cell cycle durations. Kinetic autoradiographic techniques of this type were used decades ago to divide the cell cycle into four phases: the synthesis of DNA occurs mostly in the S phase and the actual division of the parent cell into two daughters during the M phase; the time gap between cell division and DNA synthesis is gap number 1, or G1, and the time gap between DNA synthesis and cell division is gap number 2, or G2. Although the term mitosis is often used to refer to the M phase, the adjective mitotic properly refers to all cells that are engaged in any portion of the whole process of self-replication: G1, S, G2, and M phases. This distinguishes mitotic cells from cells that do not divide within a defined period of observation, called G0 cells. The M phase is the least variable in length, lasting about 1 h in most mammalian cells. The G2 phase is usually 3 h in length. The total duration of the cell cycle varies considerably, but the average in human cancer is between 2 and 4 days. Most of this variability is accounted for my variability in the length of the G1 phase. The long mitotic cycle in adult humans is in marked contrast with the cell cycle duration in Drosophila, which may take minutes, or with that of mammalian embryos, which may take only hours.
In G1 phase, a normal mammalian somatic cell contains a diploid number of chromosomes and hence diploid (2N) DNA content. During the S phase, a cell’s DNA content should increase from 2N to 4N. (A very small number of so-called S0 cells may stop synthesizing DNA before completing the S phase, and rarely a cell can rest in the G2 phase and not proceed into M phase.) G0 cells tend to be smaller than G1 phase cells and have lower RNA and protein conten ts. The variations in cellular DNA content during the proliferative cycle can be exploited analytically by a collection of automated methods called flow cytometry. In fluorescence-activated cell sorting, a suspension of individual cells is automatically counted by being allocated into bins by DNA content, RNA content, cell size, antibody (such as Ki-67) label, uptake of bromodeoxyuridine and/or tritiated thymidine during the S phase, or combinations of such markers. This can be performed on fresh tissue—leukemias, tumor cells in effusions or ascites, enzymatically dispersed solid tumors—or on cells recovered from paraffin-embedded specimens. By measuring DNA content per cell, flow cytometry can also identify cells with abnormal amounts of DNA in the G0–G1 peak, termed aneuploid. The S-phase fraction may be impossible to measure in the presence of marked aneuploidy, one limitation of this method.
Growth fraction, death fraction, tumor size, and therapeutic response
Using the previous techniques, it has been determined that 2–20% of cells in a typical cancer are in the S phase at any point in time. Because the S phase occupies one-quarter to one-half of the cell cycle, the growth fraction is usually 4–80%, with an average of <20%. For a given tissue, malignant or benign, the length of the cell cycle in vivo is fairly constant in spite of variations in the number of cycling cells in that population. However, subtle changes in cycle kinetics have been seen in cancers in laboratory animals that are allowed to grow large and phase lengths can shift significantly as cells are cultured in vitro. This is in addition to changes in the growth fraction itself during tumor growth: one of the most robust, and mysterious, observations in tumor growth kinetics is that the growth fraction decreases with increasing tumor size. Is this the etiology or the consequence of Gompertzian growth? We will further discuss this later.
It is relevant in this regard that the rate of decrease in the growth fraction as the mass gets larger is slower for malignant than for benign tissues. But this is one of the few quantitative differences between malignant and benign tissues in cytokinetic terms. Some normal tissues, such as bone marrow and alimentary mucosa, have larger growth fractions and shorter mitotic cycle times than many cancers, even cancers of those tissues. This is the second major enigma presented by cytokinetic data. Although the growth fraction of a malignancy may be no greater than that of normal tissues from which it sprang, within a given histologic type of cancer, both a high S-phase fraction and the presence of aneuploidy are frequently associated with a growth rate that is relatively more rapid. This rapid growth suggests a malignant behavior that is relatively more aggressive, and often portends a poorer therapeutic response. These observations amplify rather than solve the enigma mentioned earlier of the association between histologic grade, tumor size, and metastatic behavior.
A partial answer may perhaps be found in the important companion concept to the concept of the growth fraction: the death fraction or cell-loss fraction. This is simply the proportion of the cellular mass that is lost by cell death per unit of time. The cell-loss fraction is hard to estimate from actual measurements since apoptosis—a common path of cell death—can leave few anatomic traces. It is usually inferred by comparing the expected growth rate (calculated from the measured growth fraction) with the actual growth rate. The impact of a high cell-loss fraction can be considerable. For example, basal cell epitheliomas of the skin grow slowly in spite of demonstrating a large number of metaphase figures. The importance of cell loss, however, goes beyond its impact on growth rate. Each mitotic cycle carries with it a finite probability of mutation. A tumor with a higher cell loss rate takes more mitotic cycles to double in size than a tumor with a lower cell loss rate. Thus, the rate of cell loss relates directly to the rate of mutations toward biologic properties of clinical importance.
Related posts:


Stay updated, free articles. Join our Telegram channel

Full access? Get Clinical Tree


