INTRODUCTION
SUMMARY
Lymphocytes are a heterogeneous population of blood cells that can be distinguished from other leukocytes by their characteristic morphology and structural features.* Mature lymphocytes can be divided into several functional types and subtypes based on their organs of development and function. The major classes of lymphocytes include T cells, B cells, and natural killer (NK) cells. T lymphocytes develop in the thymus (Chaps. 6, 74, and 76) and are exported to the blood and lymphoid organs. They are responsible for cell-mediated cytotoxic reactions and for delayed hypersensitivity responses (Chap. 76). T lymphocytes also produce the cytokines that regulate immune responses and provide helper activity for B cells. B lymphocytes can capture, internalize, and present antigens to T cells and are the precursors of immunoglobulin-secreting plasma cells (Chap. 75). NK cells account for innate immunity against infectious agents and transformed cells that have altered expression of transplantation antigens (Chap. 77). Blood T and B lymphocytes are indistinguishable by light and electron microscopy. NK cells tend to be larger cells with relatively large granules scattered in their cytoplasm. B cells can mature into plasma cells upon activation by engagement with antigen or with certain B cell mitogens. Although the different lymphocyte subpopulations appear similar by morphology they have distinct surface and intracellular protein expression patterns. These subpopulations, as defined by antigen expression, reflect different functional subsets, maturation stages, and activation stages. This chapter describes the light and transmission electron microscopic structures of lymphocytes and plasma cells and the major structural features reflected by surface antigens that are characteristic of each lymphocyte type. The chapter also provides information on biophysical and biochemical features of human lymphocytes.
Acronyms and Abbreviations
ADAM, a disintegrin and a metalloprotease; BTK, Bruton tyrosine kinase; CD, cluster of differentiation; Ig, immunoglobulin; lck, leukocyte tyrosine kinase; LGL, large granular lymphocyte; MHC, major histocompatibility complex; NK, natural killer; TCR, T-cell receptor; TdT, terminal deoxynucleotidyl transferase; TFH, follicular helper T cells; Th, T helper cells; TREG, T-regulatory cell; ZAP-70, zeta-associated protein of 70 kDa.
*This chapter was written by H. Elizabeth Broome in the 8th edition and some of the text and images have been retained.
DEFINITION AND HISTORY
Lymphocytes and plasma cells first were described in 1774 and 1875, respectively.1 Studies during the subsequent 75 years with improved histologic techniques and light microscope optics furthered understanding of the lymphoid organs and the distribution of lymphocytes.2,3,4,5,6 By the mid-20th century, awareness that the immune system had at least two components—one governing humoral immunity and one governing cellular immunity—led to early concepts of different lymphocyte subsets. Also, at the same time came the discovery that the thymus and bursa of Fabricius in birds were the source of what came to be known as T (thymic-derived) and B (bursa-derived) lymphocytes, respectively, and that the marrow was the bursa equivalent in humans (human B cells therefore could represent marrow-derived cells). This discovery coupled with descriptions of inherited absence of the thymus leading to loss of cellular immunity but retention of humoral immunity and cases of retention of cellular immunity in children who were deficient in antibody production, eventually led to our current understanding of the division of labor among what originally appeared to be a common lymphocyte pool, morphologically. The later advent of monoclonal antibodies against numerous surface antigens coupled with flow cytometry, in vitro functional assays, molecular techniques to distinguish between B cells and T cells, and experiments using inbred strains of mice brought us to our current state of knowledge of the immune response and its abnormalities.
Flow cytometry identifies a multitude of lymphocyte subsets based on antigen expression patterns. These immunophenotypic subsets correlate closely with function as determined by in vitro and in vivo testing. T lymphocytes, B lymphocytes, and natural killer (NK) cells represent three major blood lymphocyte functional subsets. The marrow and thymus contain precursor cells that resemble lymphocytes but lack function without differentiation and maturation into various lymphocyte subsets. Plasma cells are terminally differentiated B lymphocytes that produce immunoglobulin and mostly reside in marrow, lymph nodes, and other lymphoid tissues. (Chap. 6).
MICROSCOPY AND HISTOCHEMISTRY OF NORMAL BLOOD LYMPHOCYTES
Classic studies of blood and tissues defined lymphocytes as spherical and/or ovoid cells that have diameters from 6 to 15 μm when flattened on glass slides.4 Some of these studies described two separate broad types of lymphocytes based on size: small lymphocytes with diameters of 6 to 9 μm and large lymphocytes with diameters of 9 to 15 μm. Patients with acute viral illnesses have increased numbers of circulating large, “reactive,” lymphocytes. Other illnesses, such as infection with Bordetella pertussis and autoimmune disorders, can cause blood to have increased small lymphocytes or lymphocytes with plasma cell-like morphology (Chap. 78). The mean absolute number of circulating small lymphocytes in normal adults is 2.5 × 10⁹/L (Chap. 2).7 Children have higher lymphocyte counts that trend downward until they reach adult levels at approximately 8 to 10 years of age (Chap. 7).8
Most lymphocytes in normal blood are small with an ovoid or kidney-shaped nucleus that stains purple, has densely packed nuclear chromatin, and occupies approximately 90 percent of the cell area (Fig. 73–1A and B) by Romanowsky polychromatic stains (e.g., Giemsa or Wright) of air-dried films. A small rim of cytoplasm stains light blue. Nucleoli rarely are observed in Wright-stained films, but nucleoli in these cells may become visible in certain preparations, such as cytospin slides, or after prolonged storage in anti-coagulated blood collection tubes.
Figure 73–1.
Wright-Giemsa stained blood films showing (A) a normal, small lymphocyte, monocyte, and segmented neutrophil; (B) normal small lymphocyte and two medium-sized lymphocytes; (C) neutrophil and two lymphocytes with morphologic features characteristic of Bordetella pertussis infection (small size, cleaved nuclei, and scant cytoplasm); (D) reactive lymphocytes; and (E) large granular lymphocyte and small lymphocyte. Wright-Giemsa stained marrow films showing (F) normal plasma cell; (G) two normal plasma cells, one nucleated red cell, and one neutrophil; and (H) two plasma cells with one containing many Russell bodies.
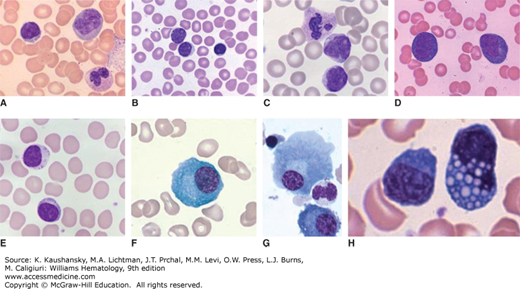
A minority of lymphocytes in normal blood have morphology that defines them as large granular lymphocytes (LGLs).9 These LGLs are slightly larger than most lymphocytes, having an increased area of light blue or clear cytoplasm. LGL cytoplasm contains a number of coarse pink granules, usually 5 to 15 per cell, and occasional clear vacuoles. In a normal adult, approximately 5 percent but up to 10 to 15 percent of blood lymphocytes are LGLs (see Fig. 73–1E).9 The LGLs in blood are composed of NK cells and a subset of cluster of differentiation (CD) 8+ T lymphocytes, indistinguishable by their morphology.
Active movement of lymphocytes is studied by phase-contrast, or interference-contrast, microscopy. Lymphocytes move slowly with a “hand mirror” appearance. Cytoplasmic spreading does not occur. However, during cell movement, a thickening occurs in the cytoplasmic rim, which houses most of the cell’s organelles, including the Golgi apparatus.
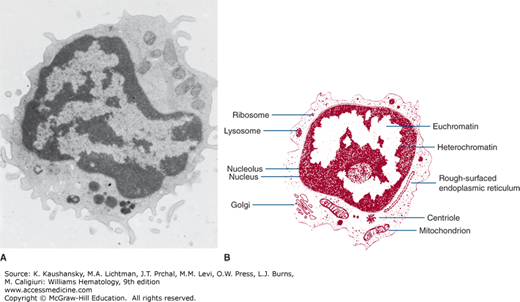
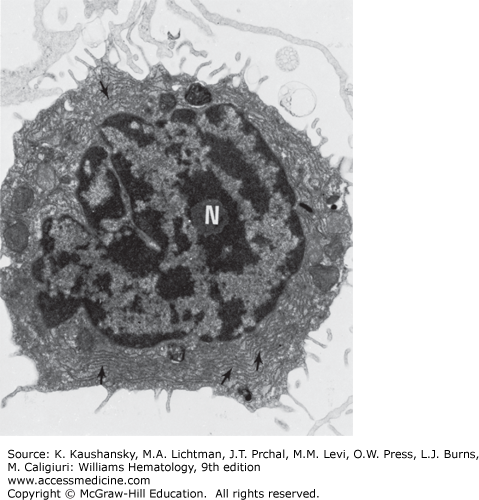
The blood lymphocyte measures approximately 5 μm in spherical diameter as visualized by transmission electron microscopy.10 The nucleus has an abundance of electron-dense, condensed heterochromatin, a feature characteristic of nonproliferating cells. The nucleoli are round in section, approximately 0.5 to 1.4 μm in diameter. They are composed of three distinct and concentrically arranged structural units: the central region or agranular zone; the middle, fibrillar region; and the granular zone, which contains intranucleolar chromatin. The lymphocyte’s nuclear membrane contains nuclear pores and a perinuclear space.
The cytoplasmic organelles of the lymphocytes are characteristic of eukaryotic cells. Some organelles, such as the Golgi zone, are poorly developed. The cytoplasm contains free ribosomes, occasional ribosome clusters, and strands of rough-surfaced endoplasmic reticulum (Fig. 73–2). Centrioles, mitochondria, microtubules (diameter approximately 0.25 μm), and microfilaments (diameter approximately 0.07 μm) are present in the cytoplasm adjacent to the cell membrane. The cytoplasm also contains lysosomes, which are approximately 0.4 μm in diameter, are electron opaque, and contain classic lysosomal enzymes (e.g., acid phosphatase, β-glucuronidase, and acid ribonuclease).11 The lymphocyte plasma membrane stains with colloidal iron, a marker for membrane sialic acid. Lymphocyte cell membranes and cell coat glycoproteins are shown with other electron-dense markers, including phosphotungstic acid, lanthanum colloid, and ruthenium red.
Most T lymphocytes have a localized “dot” pattern when stained for acid phosphatase, acid and neutral nonspecific esterases, β-glucuronidase, and N-acetyl-β-glucosaminidase.12 LGLs stain for acid hydrolases with a dispersed, granular reaction pattern.13 B lymphocytes either lack esterase and acid phosphatase or show minimal scattered granular staining.
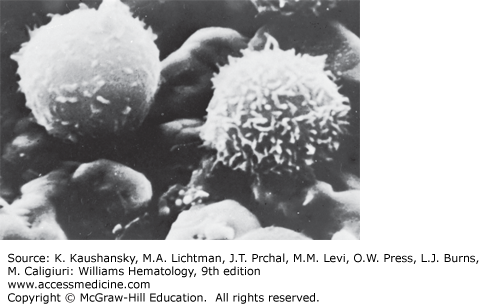
Scanning electron microscopy provides three-dimensional information.14 However, the resolution achieved with scanning electron microscopy, approximately 0.1 μm, is considerably less than that possible with transmission electron microscopy, generally 0.002 to 0.0039 μm. Normal blood lymphocytes, washed and collected on silver membranes and fixed in glutaraldehyde, have a spherical topography with varying numbers of stubby or finger-like microvilli (Fig. 73–3).15 In contrast, monocytes are much larger, have few microvilli, and display ruffled membranes and ridge-like profiles (Chap. 67).
Lymphocyte microvilli contain parallel bundles of actin filaments that undergo continuous assembly and disassembly.16 The function of lymphocyte microvilli probably includes segregating surface receptors involved in extravasation. Two receptors involved in the initial rolling phase of extravasation, L-selectin and α4β7 integrin,17 localize to microvillar tips. In contrast, the β2 integrins that mediate stable adhesion and diapedesis localize to nonprotrusive regions of the cell surface. This spatial separation of surface receptors might enable a temporal segregation of adhesive function during extravasation. Lymphocytes expressing chimeric L-selectin constructs that no longer localize to microvilli do not roll on L-selectin ligands, supporting this hypothesis.18
MORPHOLOGIC CHANGES ASSOCIATED WITH ACTIVATION
Lymphocyte stimulation is associated with a complex sequence of morphologic and biochemical events. Activation of B and T lymphocytes results in the transformation of the small, resting lymphocyte into proliferating large cells with abundant highly basophilic cytoplasm, irregularly condensed or smudgy chromatin, and round to slightly irregular nuclear outlines (see Fig. 73–1D). Nucleoli may be evident by light microscopy in these cells, but they usually are not prominent. Infection with B. pertussis causes an increase in blood lymphocytes with a particular activated morphology characterized by small size, scant cytoplasm, and cleaved nuclei with mature chromatin (see Fig. 73–1C).
Activated lymphocytes proliferate and mature into effector lymphocytes and memory cells. Effector cells include helper T cells, cytolytic T cells, and plasma cells (see Figs. 73-1F and G, 73–4, and 73–5). In vitro, plant lectins, bacterial products, polymeric substances, and enzymes activate lymphocytes and cause mitosis. Such agents are called mitogens. Some mitogens are specific for either B or T lymphocytes, whereas other mitogens stimulate both.19
Figure 73–4.
Transmission electron micrograph of lymphocyte from normal individual incubated with phytohemagglutinin20 for 3 days. The transformed cell has a large Golgi zone (G) and many ribosomal aggregates (arrows). The nucleus is euchromatic (×7500).
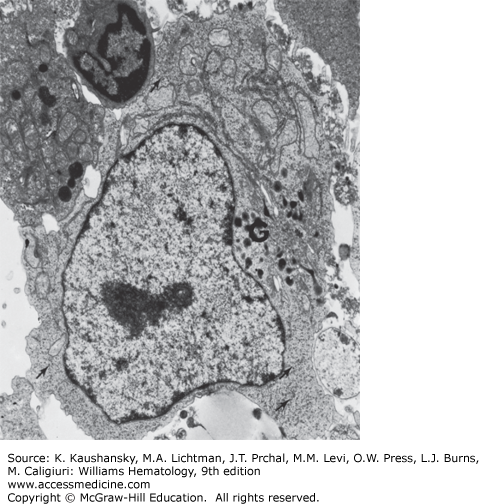
Figure 73–5.
Transmission electron micrograph of plasmacytoid cell present in culture of lymphocytes from a patient with chronic lymphocytic leukemia incubated with pokeweed mitogen for 7 days. The nucleolus (N) and rough-surfaced endoplasmic reticulum (arrows) are evident (×9000). (Reproduced with permission from Cohnen G, Douglas SD, Konig E, Brittinger G: Pokeweed mitogen response of lymphocytes in chronic lymphocytic leukemia: A fine structural study, Blood 1973 Oct;42(4):591-600)
Approximately 4 hours after mitogen stimulation, lymphocytes show increased nucleolar size and an increase in the number and concentration of granules in the granular zone. These changes are followed by an increase in fibrillar zones and increased intranucleolar chromatin. Nucleolar chromatin becomes more electron lucent or dispersed. From 48 to 72 hours following the addition of phytohemagglutinin, the volume of the cytoplasm increases. In addition, the cytoplasm contains an increased number of ribosomal clusters and more rough-surfaced endoplasmic reticulum. The activated cell has increased numbers of lysosomes and a larger Golgi complex with more components.20 Under some circumstances (e.g., cultures of human lymphocytes stimulated for 7 to 10 days with pokeweed mitogen), some B cells form well-developed Golgi and plasmacytoid features.21 Similar plasmacytoid cells are observed in antigen-stimulated lymph nodes, during graft rejection in vivo, and in some in vitro systems, including the mixed lymphocyte culture. In lymph nodes, the stimulated lymphoid cells may be referred to by various pathologists as lymphoblasts, immunoblasts, centroblasts, or large lymphoid cells. Morphologic criteria for these cells overlap.
Following stimulation with antigen or mitogens, the lymphocyte enters the cell cycle. The fate and function of lymphocytes that traverse the cell cycle can be divided into two pathways. Some lymphocytes undergo several mitotic cycles and then return to the G0 phase, indistinguishable in morphology from the original nonactivated cells. Some of them then become memory cells, programmed to remember the stimulating antigen and thus respond more rapidly to reexposure to the original antigen. Alternatively, they become terminally differentiated effector lymphocytes, such as plasma cells or cytotoxic T cells (Chaps. 75 and 76).
MICROSCOPY AND HISTOCHEMISTRY OF PLASMA CELLS
Plasma cells derive from small B lymphocytes after activation in the correct environment. The characteristic feature of plasma cells is abundant cytoplasmic and secretory immunoglobulin (Ig). A fully mature plasma cell lacks surface Ig expression. Each plasma cell has the same clonal rearrangement of its V(D)J (variable diversity joining) Ig genes as its predecessor B lymphocyte (Chap. 75). Several mitotic divisions may occur during cellular differentiation from the resting lymphocyte to the plasmablast to the immature plasma cell. Immature plasma cells can undergo successive waves of mitosis in the medullary cords of lymph nodes in response to antigen.22 Cell transfer experiments demonstrated that these transformed cells later mature into antibody-producing plasma cells.23
Pokeweed mitogen induces B lymphocytes to transform into plasma cells after 7 to 10 days of culture.24 These plasma cells infrequently contain large electron-dense inclusions (Russell bodies), which may measure 2 to 3 μm in diameter (see Fig. 73–1H).25 Russell bodies, cytoplasmic Ig in the endoplasmic reticulum, sometimes are dissolved during the staining procedure. They usually occur in pathologic states but may be found in plasma cells from normal lymph nodes or marrow.
The mature plasma cell has a characteristic basophilic cytoplasm and an eccentric nucleus when treated with a polychrome stain. The nuclear polarity is attributable to a large paranuclear zone, which corresponds to the Golgi apparatus. The typical mature plasma cell spread on a slide usually is round or oval and has a diameter of 9 to 20 μm, with a mean cell diameter of 14 μm and a mean nuclear diameter of 8.5 μm (see Fig. 73–1F and G).26 The nuclear heterochromatin is coarse and distributed in a pattern that sometimes resembles the spokes of a wheel (cartwheel nucleus) on paraffin sections. Normal plasma cells may occasionally have two or more nuclei. Cytochemical features of plasma cells include positive staining for β-glucuronidase and mitochondrial enzyme markers. They do not stain for peroxidase or nonspecific esterase.27
Plasma cells in patients with certain diseases may have different histochemical properties. Plasma cell size and morphology may be altered substantially in myeloma and macroglobulinemia (Chaps. 107 and 109, respectively). Plasma cells with two or three nuclei are more frequent in marrows from patients with plasma cell dyscrasias. Periodic acid-Schiff stains may reveal cytoplasmic or nuclear inclusions in clonal plasma cells.28 Under some circumstances, amyloid inclusions in plasma cells have been detected by electron microscopy.29 In hemochromatosis and hemosiderosis, plasma cells may contain hemosiderin when examined by electron microscopy.30
The plasma cell is packed with a rough-surfaced endoplasmic reticulum having numerous attached ribosomes as seen by electron microscopy. A large, circumscribed Golgi zone forms a paranuclear halo when observed by light microscopy. The nucleus has dense areas of heterochromatin. The Golgi zone contains lamellae, vesicles, vacuoles, and a number of granules. Mitochondria are located between the strands of endoplasmic reticulum.31
ANTIGENS OF HUMAN LYMPHOCYTES
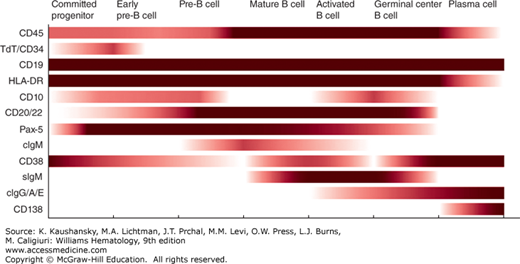
Figure 73–6 summarizes the expression of antigens on cells of the B-lymphocyte lineage, including committed progenitor B cells and pre-B cells. Chapter 74 discusses these cells and the maturation stages they represent. Figure 73–6 also lists antigens that are expressed or increased upon B-cell activation. Of the B-cell–associated antigens that are commonly used, only a few are restricted to cells of the B lineage. Of these antigens, only CD20, CD22, and Pax 5 are not found on other cell types. Pax 5, a transcription factor, is a “master regulator” of B-cell development32,33 that is expressed from the precursor stage through all B-cell maturation until it is lost at the plasma cell stage. Demonstration of monoclonal surface Ig allows diagnosis of clonal, neoplastic B cells. CD20 is the target of rituximab, a monoclonal antibody commonly used for treatment of B-cell neoplasms. CD19 is restricted mostly to B cells, but may be expressed weakly by follicular dendritic cells. CD19 is expressed by B cells at all stages of maturation, including the committed B-cell progenitor and most normal plasma cells. As such, it is the best-defined pan–B-cell surface antigen.
Related posts:
 Hematopoietic Stem Cells, Progenitors, and Cytokines
Examination of the Marrow
Therapeutic Apheresis: Indications, Efficacy, and Complications
Hemolytic Anemia Resulting from Infections with Microorganisms
Structure and Composition of the Erythrocyte
Disorders of Hemoglobin Structure: Sickle Cell Anemia and Related Abnormalities
Hematopoietic Stem Cells, Progenitors, and Cytokines
Examination of the Marrow
Therapeutic Apheresis: Indications, Efficacy, and Complications
Hemolytic Anemia Resulting from Infections with Microorganisms
Structure and Composition of the Erythrocyte
Disorders of Hemoglobin Structure: Sickle Cell Anemia and Related Abnormalities
Stay updated, free articles. Join our Telegram channel

Full access? Get Clinical Tree


