- The functions of the kidney are to eliminate waste products, control body fluid volume and composition, produce erythropoietin, renin, and prostaglandins, and regulate vitamin D metabolism.
- In renal disease, these functions are impaired, leading to the development of uraemic syndrome.
- There is evidence that nutritional treatment can prevent or delay the progression of chronic kidney disease (CKD), control symptoms, and prevent or reduce the development of complications such as protein energy malnutrition (PEM) and cardiovascular disease (CVD).
- PEM is a common clinical finding in renal disease and has a negative bearing on quality of life, morbidity, and mortality, and therefore it should be adequately prevented, diagnosed, and treated.
- Nutritional prescriptions in renal patients are complex because nutritional goals are multiple, and at times conflicting, yet the prescribed diets should be as realistic and practical as possible.
- Nutritional support is needed when spontaneous food intake is inadequate to cover nutrient requirements.
14.1 Introduction
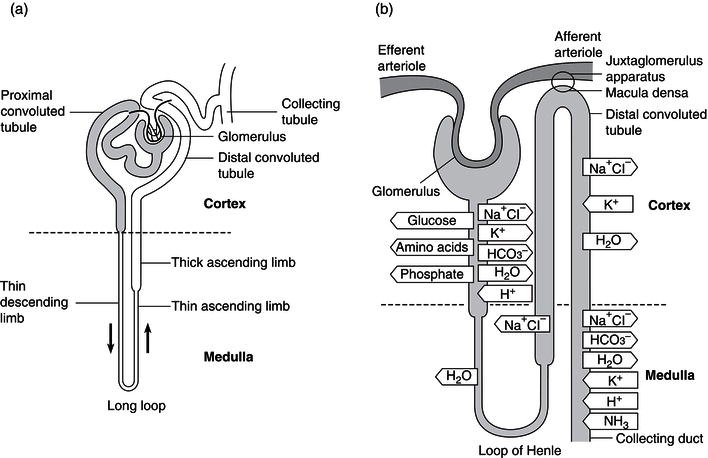
Medical nutrition therapy plays an essential role in the management of renal disease. To appreciate the interaction between nutritional and renal dysfunction, it is important to have an understanding of the normal physiology of the kidney. The kidney is essentially an excretory organ, but it is also involved in the regulation of the volume and composition of body fluids, and has specific endocrine and metabolic functions. The functional unit is the nephron, of which there are approximately 1 million in each kidney. The function and action of a nephron are shown in Figure 14.1. A large volume of blood – about 1.3 l – passes through the nephrons every minute. The rate of ultrafiltration is referred to as the glomerular filtration rate (GFR) and is approximately 125 ml/minute. This value varies with age and sex. The filtrate formed in the glomerulus passes first into the proximal convoluted tubule, then into the loop of Henle, and finally through the distal convoluted tubule to the collecting ducts. During this process, the filtrate is modified according to the needs of the body through reabsorption and secretion by the tubules (Figure 14.1b).
Renal disease impairs excretory and other kidney functions. Therefore, the serum levels of urea, electrolytes, and other metabolites increase, the metabolism of nutrient changes, and the patient becomes symptomatic. When renal failure reaches its final stages, renal replacement therapy (RRT) is started. This restores most kidney functions, but dialysis is not able to correct all the metabolic changes induced by renal failure.
Dietary modifications have important roles in kidney disease. Interventions in protein, fluid, sodium, potassium, and phosphate intake can counteract the changes induced by loss of kidney function, whether acute or chronic. Another goal is to slow the evolution of kidney disease to renal failure. Chronic kidney disease (CKD) is characterised by a progressive nature, which leads to a relentless loss of renal mass and function, even when the pathogenic factors of the original damage have been successfully treated. At first the loss of function is compensated for by an adaptive hypertrophy of the remaining functional nephrons (remnant nephrons), associated with increased glomerular plasma flow and transcapillary glomerular hydraulic pressure. These haemodynamic changes allow an increase of total kidney GFR in spite of a reduced kidney mass. In the long term, however, the glomeruli become sclerotic and renal function progressively declines. Much effort has been put into identifying the best nutritional interventions to control the factors involved in the progression of the kidney disease and to delay the need for RRT. Another fundamental role of nutrition is the prevention or control of protein–energy malnutrition (PEM) and cardiovascular disease (CVD), commonly seen in kidney patients, with the aim of improving outcome and survival.
Figure 14.1 The function and action of a nephron. Redrawn from Kumar and Clark (1998), with permission from Elsevier.
Chronic kidney disease (CKD) – the onset of renal failure develops over a longer period of time.
Diabetic kidney disease (DKD) – chronic kidney disease in patients with diabetes mellitus.
End-stage renal failure (ESRF) – patients require some form of RRT (haemodialysis or continuous ambulatory peritoneal dialysis, CAPD) or kidney transplantation.
This chapter will be organised according to the type of renal disease, as the role of nutritional management in each situation is different (Box 14.1).
14.2 Assessment of nutritional status in kidney patients
Nutritional assessment needs to be performed regularly in kidney patients in order to identify those at risk of malnutrition, or those who are malnourished, and provide adequate nutritional intervention. Standard multiple methods of assessment are used, including clinical examination, dietary intake evaluation, anthropometry, and measurement of biochemical, functional, and body-composition indices, in order to obtain data about different body components (fat mass, lean body mass, and visceral proteins). All nutritional status indices have prognostic value, with an impact on morbidity and mortality (see Chapter 2).
Methods of nutritional assessment
Food and nutrient intake
The assessment of dietary intake is important in defining the adequacy of the diet and compliance with prescriptions. Evaluation is done by 24-hour recall and through dietary interviews over 3–7 days, carried out by a well-trained dietitian, or by food diaries over 3–7 days. The National Kidney Foundation Kidney Disease Outcomes Quality Initiative (NKF KDOQI) guidelines, for patients on dialysis, suggest a 3-day food diary, covering a dialysis day, a non-dialysis day, and a weekend day. To help the patient quantify portion sizes and household measures, three-dimensional models or pictures of food – printed or on a digital display – can be helpful.
In stable CKD patients with neutral nitrogen balance (nitrogen intake = nitrogen loss) – excluding therefore conditions of weight loss, active catabolism, worsening of renal failure (in pre-dialysis patients), and inadequacy of dialysis in haemodialysis or continuous ambulatory peritoneal dialysis (CAPD) – protein intake can be assessed indirectly through the protein equivalent of total nitrogen appearance, calculated from the urea nitrogen appearance in the urine or dialysate via equations specific to the treatment modality (conservative or RRT).
Anthropometric measurements
Body weight and height, used to calculate the body mass index (BMI), should always be measured and recorded at the first visit in order to obtain a basal reference value, which is useful in monitoring any change at follow-up. In patients on conservative treatment, patients with oedema, or dialysed patients, it is important to consider the dry weight or oedema-free body weight, based on clinical estimation or defined as the weight measured after haemodialysis – or after empting the peritoneal cavity in CAPD patients – in order to exclude the effect of fluid retention. In haemodialysis patients, mortality is higher for subjects with a post-dialysis BMI < 23 kg/m2, or < 20 kg/m2 in elderly subjects. Therefore, the European Renal Best Practice (ERBP) guidelines recommend that dialysis subjects should maintain a BMI > 23 kg/m2. Being overweight, on the other hand, both in haemodialysis and CAPD subjects, seems to be protective even at levels equivalent to obesity (BMI > 30 kg/m2) or severe obesity (BMI > 35 kg/m2).
Unintentional weight loss over time is important information to add to absolute weight when assessing the risk of PEM. Percentage weight loss in the previous 3–6 months is used to define PEM.
According to the ERBP guidelines for haemodialysis, the percentage change in body weight should be calculated from the difference between the averaged, over 1 month, post-dialysis weight and the averaged post-dialysis weight of the previous month.
Body weight gives only a rough estimate of body-composition changes. Skeletal or fat mass should therefore be assessed by other anthropometric measurements (limb circumferences and areas and skinfold thickness, taken at multiple sites) or by body-composition methods (BIA, bioelectrical impedance analysis; dual-emission X-ray absorptiometry, DXA). It is important to note that water retention in end-stage renal disease (ESRD) or on RRT may limit the reliability of anthropometric indices.
Biochemical indices
In RRT patients, laboratory data should be measured before the haemodialysis session or after the equilibration phase in CAPD. Urea nitrogen appearance is calculated during the interdialytic interval.
Creatinine excretion reflects muscle mass, but creatinine kinetics is altered in CKD, and therefore the creatinine/height ratio should not be used. With RRT, in the absence of renal excretion, pre-dialysis serum creatinine can be used again.
Serum proteins synthesised by the liver, such as albumin, pre-albumin, and transferrin, are indicators of the visceral protein pool. The differences in the protein half lives modify their sensitivities in detecting nutritional changes, but multiple non-nutritional factors, such as plasma volume, urinary excretion, and inflammation, can modify serum-protein concentration.
Albumin has a long half life of 21 days and its synthesis decreases with the liver production of positive acute-phase proteins, such as C-reactive protein (CRP). Hypoalbuminaemia (cut-off value 3.8–4.0 g/dl) is associated with both higher mortality and cardiac disease risk and is considered more a negative prognostic than a PEM indicator.
Transferrin has a shorter half life of 9 days, which makes it a more sensitive index of malnutrition; however, the protein concentration is also influenced by iron status, infections, and inflammation.
Pre-albumin is a protein with a very short half life that can detect short-term changes in visceral protein status. In pre-dialysis patients, however, the serum concentration of the protein is influenced by renal function. Pre-albumin levels may therefore rise as GFR declines, independent of the nutritional status of the patient. In dialysed patients pre-albumin can instead be used as a nutritional marker. Values < 30 mg/dl are generally indicative of PEM and are associated with an increased mortality risk.
Low or declining values of total cholesterol serum levels may indicate malnutrition, but this change may also be the consequence of inflammation or comorbid conditions. Values less than 150 mg/dl are associated with a higher mortality risk.
CRP serum-level measurement is useful in detecting inflammation and an increased risk of atherosclerosis and cardiovascular mortality. A rise in the plasma levels of this protein is associated with malnutrition and reduced albumin levels. There is no consensus about including CRP as a diagnostic index of PEM.
Functional indices
Functional indices are useful as they may detect early changes in nutritional status. The most common indices in clinical practice are lymphocyte count (to measure immune response) and hand grip strength (to measure skeletal muscle function).
Subjective global assessment
Subjective global assessment is a clinical tool which integrates history about gastrointestinal symptoms and weight loss in the last 6 months with a physical examination of fat and muscle mass. Subjective global assessment gives a quick assessment of nutritional status, without the need for complex anthropometric or laboratory data. In CKD, the modified CANUSA (Canada-USA) study version should be used. Other tools based on subjective global assessment modifications include the patient-generated subjective global assessment, the Malnutrition and Inflammation Score, and the Dialysis Malnutrition Score, which include laboratory or body-composition measurements in order to overcome the limitations of subjective judgement.
14.3 Acute kidney injury
Introduction
‘Acute kidney injury’ (AKI) is the newest term introduced by the Kidney Disease: Improving Global Outcomes guidelines, in place of the previous ‘acute renal failure’ (ARF). AKI indicates the spectrum of injuries which may affect the kidney: from the mildest uncomplicated forms, treated with medical interventions, to the most severe, associated with trauma, sepsis, or other organ failure, and requiring RRT. AKI is characterised by a rapid loss of kidney function and an accumulation of metabolic end products normally excreted by the kidneys. Fluid, electrolyte, and acid–base balance are altered and plasma levels of urea, creatinine, hydrogen ions, potassium, and uric acid become elevated. Protein catabolism increases, contributing to the higher plasma urea levels. The scientific international societies are working to reach a globally shared definition and diagnostic modalities in staging for AKI. The prevalence of AKI, through time is not well known, due to modifications of its definition. AKI may involve between 5 and 20% of critically ill patients. The overall mortality is between 40 and 90%, despite many recent improvements in treatment. Patients with shock, sepsis, or multiple organ failure have the worst prognosis. Relevant determinants of outcome are the degree of protein hypercatabolism induced by AKI and its associated conditions, and the need for RRT. In the last 2 decades, the options for dialysis treatment have increased to include not only intermittent haemodialysis (IHD) and peritoneal dialysis but also different forms of continuous renal replacement therapy (CRRT), such as continuous veno–venous haemofiltration, continuous veno–venous haemodialysis, and continuous venous–venous haemodiafiltration, or the latest so-called ‘hybrid’ modalities of RRT, such as extended-duration dialysis, sustained low-efficiency dialysis, and the Genius system. While the efficacy of the different treatments is not yet defined by the literature, all of them have an impact on the nutritional status of the patient, which must be taken into account.
Nutritional treatment in AKI
The presence of PEM with hypercatabolism has a strong prognostic value, being a predictor of in-hospital mortality independent of other complications and comorbidities. On the other hand, it is yet to be clearly demonstrated that nutritional intervention can improve outcome, but clinical experience indicates that treatment may have important benefits. The markedly negative nitrogen balance often seen in the most severe patients and the poor prognosis suggest the importance of a well-planned nutritional treatment, with optimal amounts of energy, nitrogen, and other nutrients.
Nutritional support for patients with AKI must take into account not only the metabolic disturbances associated with the kidney injury, but also the underlying disease process and the associated complications, as well as the treatment modalities (conservative or RRT). RRT causes loss of both macro- and micronutrients, which must therefore be supplemented. The impact of RRT depends on the method utilised and its intensity. CRRT causes significant loss of water-soluble, low-molecular-weight substances. A total daily loss of 10–15 g amino acids and 5–10 g protein has been reported.
Metabolic changes
Protein metabolism
Severe protein catabolism with a highly negative nitrogen balance and the release of amino acids from skeletal muscle is characteristic of AKI. Hypercatabolism is defined on the basis of daily increases in blood urea nitrogen (>11 mmol/l), blood urea nitrogen-to-creatinine ratio (>10), or urea nitrogen appearance (>10 g/day).
Increased hepatic gluconeogenesis and ureagenesis occur in response to this protein hypercatabolism, and nitrogen losses can be as high as 150–200 g/day. Box 14.2 shows the main causes of hypercatabolism in AKI. Injury to the kidney is associated with the development of an intense proinflammatory state, with increased levels of cytokines. Endocrine abnormalities can be partly responsible for the increased gluconeogenesis, proteolysis, and accelerated protein turnover seen in AKI. The secretion of counter-regulatory hormones, such as catecholamines, glucagon, and cortisol, is increased, leading to insulin resistance. Protein breakdown is also induced by metabolic acidosis. RRT, which is often necessary in AKI, is a strong catabolic stimulus, due to the loss of nutrients (amino acids, peptides, and vitamins) during the dialytic procedure and the production and release of protein catabolism-inducing cytokines and proteases during the blood contact with the dialysis membranes. Imbalances of plasma and intracellular amino acids have been described in AKI, due to metabolic abnormalities, decreased renal function, loss through the dialysis membranes, and altered plasma clearance. As a consequence, amino acids such as histidine, arginine, tyrosine, serine, and cysteine, which are non-essential in healthy subjects, may become conditionally essential in AKI. The levels of amino acids such as phenylalanine and methionine are increased, while the concentration of non-essential amino acids involved in the urea cycle (arginine and ornitine) is reduced.
- endocrine abnormalities:
- raised glucagon;
- raised cortisol;
- raised catecholamines;
- insulin resistance;
- raised glucagon;
- uraemic toxins;
- metabolic acidaemia;
- associated events (sepsis, shock, SIRS, MOF, trauma, burns, etc.);
- inflammation (increased cytokine activity);
- resistance to growth factors;
- reduced nutrient intake;
- immobilisation;
- loss of nutrients;
- renal replacement therapy.
Lipid and carbohydrate metabolism
Lipid metabolism is severely affected by AKI. Plasma concentrations of triglycerides, very low-density lipoproteins (VLDLs) and low-density lipoproteins (LDLs) are usually elevated in renal patients, while cholesterol and high-density lipoprotein (HDL) levels may be low. Impaired lipolysis is the main reason for these changes, as the activities of key enzymes of lipid metabolism (post-heparinic lipoprotein-lipase, hepatic triglyceride lipase, and peripheral lipoprotein lipase) are altered, both at peripheral and at hepatic levels. Plasma lipid clearances are altered and the ability to utilise exogenous lipids may be reduced; therefore, the amount of lipids given in AKI should be lower than in non-uraemic patients.
Vitamins and minerals
RRT causes major losses of water-soluble vitamins, which must be supplemented. The intake of vitamin C should be 30–50 mg/day, in order to avoid secondary oxalosis, but the requirement may be double with CRRT. Plasma levels of fat-soluble vitamins A and E, involved in the body antioxidant defence system, are reduced. The risk of supplemented vitamin A accumulation and toxicity over time requires monitoring of the vitamin levels. Vitamin K levels are normal or even elevated. Magnesium, calcium, and selenium may need supplementation.
Nutritional requirements
Guidelines on enteral and parenteral nutrition in patients with AKI have been developed and recently reviewed by the European Society for Clinical Nutrition and Metabolism (ESPEN) (Table 14.1).
Patients with AKI derived from primary renal involvement (most often drug or contrast media-induced) with a low degree of catabolism (urea nitrogen appearance <6 g/day) and a short expected duration of renal insufficiency can be treated with oral low-protein diet (LPD) (0.6–0.8 g/kg/day, max. 1) in order to maintain blood urea nitrogen lower than 100 mg/dl (~36 mmol/l). This intake, which is lower than or equal to the 0.8 g/kg/day for healthy adults set by the Recommended Dietary Allowances (RDAs) in order to meet the needs of almost all (97–98%) individuals in a group, allows reduction of the nitrogen toxic load. However, because of the associated protein hypercatabolism, lower amounts should be avoided. In acutely ill patients on RRT, protein requirements are higher (1–1.5), and they are even higher on CRRT (up to a maximum of 1.7 g/kg/day).
AKI is not a cause of increased energy demand per se. On the contrary, patients with uncomplicated AKI may have a lower energy expenditure compared to healthy controls. Energy need is influenced more by the coexisting disease (e.g. sepsis, surgery, or trauma). An amount of energy not exceeding 1.3 times the basal metabolic rate (i.e. 25–35 kcal/kg/day) is generally suggested in these patients, the higher amount being reserved for hypercatabolic patients with higher urea plasma levels and very negative nitrogen balance. Energy >35 kcal/kg/day is seldom needed. Measuring or calculating energy expenditure, on the basis of estimated dry weight, is useful to avoid overfeeding.
Table 14.1 Nutritional guidelines for AKI patients. IBW, ideal body weight (Metropolitan Life Insurance tables). ESPEN, 2006 and 2009: www.espen.org.
| Protein, g/kg IBW/day conservative treatment extracorporeal treatment CRRT | 0.6–0.8, max. 1 0.8–1.2, max. 1.5 Up to 1.7 |
| Energy, kcal/kg IBW/day, as non-protein calories | 20–30 (adapted according to the weight of the patients) |
Carbohydrate and fat intake should be maintained within 3–5 g/kg/day (max. 7) and 0.8–1.2 g/kg/day, respectively. These indications take into account the presence of insulin resistance and the impaired ability to metabolise exogenous lipids.
Nutritional support
Nutritional support can be implemented through enteral nutrition, oral nutritional supplementation (ONS) or tube feeding, or parenteral nutrition.
Available formulas for enteral nutrition are either standard or kidney disease-specific, for patients on conservative treatment (low-protein, high-energy, and reduced electrolyte concentration) or on RRT (high-protein, high-energy – 1.5 g and 2 kcal/ml – and reduced content of potassium and phosphate). Uncomplicated AKI patients, with low–moderate catabolism, unable to achieve full nutritional requirements with food, can be treated with ONS to increase nutrient intake. With severe hypercatabolism, nutritional support by enteral nutrition should be initiated within 24 hours. Standard formulas are generally adequate, but dialysis-specific formulas may be used when electrolyte control is a problem. Enteral nutrition, even though preferable to parenteral nutrition, is not always possible, especially in some sicker patients; furthermore, nutrition requirements, especially for protein, may not be reached. Total parenteral nutrition (TPN) should be considered in those patients without a functioning gut or to supplement inadequate feeding by the enteral route. ESPEN guidelines suggest the use of standard parenteral nutrition formulas, which are considered adequate for most patients. In cases of electrolyte problems, three-in-one electrolyte-free or customised formulas can be used. Products enriched with glutamine, arginine, nucleotides, or omega-3 fatty acids (immune-modulating formulas) are not recommended, since clear benefits have not been confirmed.
14.4 Chronic kidney disease and diabetic kidney disease
Rationale and goals of nutritional therapy
The goals of medical nutrition therapy in CKD and diabetic kidney disease (DKD) are multiple and at times conflicting (Box 14.3). Medical nutrition therapy requires knowledge of: factors involved in renal failure progression, causes of malnutrition, the presence of PEM, other risk factors and complications, and nutrient requirements, according to the disease type and stage. Dietary prescription may be difficult to understand and follow for many patients. The motivation and education of patients and their families are key factors in fostering dietary compliance.
Definition of CKD
CKD in the pre-dialysis phase of conservative treatment is characterised by a progressive decline in renal function and is defined and classified in stages, according to the NKF KDOQI guidelines (Box 14.4). Stages 3–5 are identified by GFR alone, whereas the definition of stages 1 and 2 additionally requires the presence of structural abnormalities or of persistent proteinuria, albuminuria, or haematuria.
The UK national service framework for renal services has adopted the KDOQI classification of CKD, but stage 3 has been divided in two subgroups: 3A and 3B, with GFR of 45–59 and 30–44 ml/min/1.73 m2, respectively.
The GFR is calculated from the creatinine clearance according to different formulas, such as, for example, the Cockcroft–Gault formula or the Modification of Diet in Renal Disease formula.
Progression of CKD is defined as a decline in GFR of more than 5 ml/min/1.73 m2 within 1 year, or more than 10 ml/min/1.73 m2 within 5 years.
Definition of DKD
Diabetes mellitus is at present the greatest single cause of CKD worldwide. DKD can develop in subjects with either type 1 or type 2 diabetes and involves 20–30 % of diabetic patients. The criteria for DKD, according to the KDOQI guidelines and clinical practice recommendations for diabetes and CKD, are shown in Box 14.5.
- Delay the progression of CKD or DKD.
- Reduce uraemic symptoms.
- Prevent/control PEM.
- Prevent or treat other nutritionally related complications (cardiovascular diseases; mineral and bone disorders).
- Kidney damage for a period > 3 months, with or without decreased GFR, manifested by either structural abnormalities of the kidneys (shown by ultrasound scanning or other radiological tests, or kidney biopsy) or blood or urine markers of kidney damage, such as persistent microalbuminuria, proteinuria, or haematuria.
- GFR < 60 ml/min/1.73 m2 for a period > 3 months, with or without kidney damage, irrespective of diagnosis.
- Stage 1: normal or increased GFR (>90 ml/min/1.73 m2) with evidence of kidney damage.
- Stage 2: mild GFR reduction (60–89 ml/min/1.73 m2) with evidence of kidney damage.
- Stage 3: moderate GFR reduction (30–59 ml/min/1.73 m2).
- Stage 4: severe GFR reduction (15–29 ml/min/1.73 m2).
- Stage 5: ESRF, established renal failure (GFR < 15 ml/min/1.73 m2) or dialysis.
It is recommended that patients are screened for DKD 5 years after the diagnosis of type 1 diabetes mellitus, and from the time of first diagnosis in type 2 diabetes.
Nutritional factors involved in the progression of CKD or DKD
Protein intake
Dietary proteins induce haemodynamic and structural changes in the kidney, mediated by mechanisms such as increased secretion of hormones (glucagon, growth hormone, corticosteroids, insulin-like growth factor (IGF)), increased synthesis of angiotensin II, prostaglandins, and nitric oxide, activation of growth factors and complement fractions, induction of cytokine synthesis, and higher production of reactive oxygen species. Protein intake restriction may delay progression to ESRD. Before RRT became widely available, protein-restricted diets (so called ‘nephro diets’, such as the Giordano–Giovannetti diet) were life-prolonging and able to reduce some ESRF symptoms.
- Microalbuminuria: albumin/creatinine ratio (ACR) between 30 and 300 mg/g in a spot urine sample or 30 and 300 mg/24 hours in a 24-hour urine collection, associated with diabetic retinopathy or type 1diabetes of at least 10 years’ duration.
- Macroalbuminuria: ACR > 300 mg/g or > 300 mg/24 hours.
The effectiveness of an LPD in slowing the progression of kidney disease was first shown in animal models. It was then extensively investigated in CKD patients using either an LPD of about 0.6 g/kg ideal body weight (IBW)/day, in earlier stages of failure, or an LPD or a very low-protein diet (VLPD) of about 0.3 g/kg/day, supplemented with essential amino acids or their ketoanalogues, in later stages.
The role of protein restriction in reducing the rate of loss of renal function in progressive renal failure however is not fully defined. Furthermore, protein restriction may increase the risk of PEM. Compliance may be poor and the regimens may interfere with the patient’s quality of life. Some randomised studies, including the large Modification of Diet in Renal Disease (MDRD) study, reported a small or moderate beneficial effect on GFR slowing in patients with advanced renal failure. In patients with early renal failure on an LPD, a 28% reduction of GFR worsening was found, in comparison with patients maintained on a normal protein diet. Vegetable protein has been shown to be more effective in slowing the progression of kidney disease than animal protein, suggesting a possible role for the protein quality. Beneficial effects of protein restriction were reported in diabetic patients with DKD (see later). Present guidelines on the management of CKD suggest a moderate protein restriction in later phases of CKD and an earlier restriction in DKD (see later).
Stay updated, free articles. Join our Telegram channel

Full access? Get Clinical Tree


