- The World Health Organization (WHO) has declared obesity the largest global chronic health problem in adults, which by 2025 will emerge as a more serious world problem than malnutrition.
- In 2008, 1.5 billion adults, aged 20 and older, were overweight. Of these, over 200 million men and nearly 300 million women were obese. Nearly 43 million children under the age of five were overweight in 2010. Around 65% of the world’s population lives in countries where overweight and obesity kills more people than underweight.
- Many factors contribute to the development of overweight and obesity, including energy intake and expenditure, genetic factors, endocrine disorders, environmental factors, psychosocial influences, and other factors to a greater or lesser extent.
- The hazards of excess body weight have been clearly established by epidemiological and clinical studies, highlighting the need for careful diagnosis and effective treatment programmes.
- A multidimensional approach involving politicians, medical and health professionals, as well as industry, communities, and individuals is necessary to successfully tackle the obesity pandemic.
- The most effective treatment in the long term is, and will be, obesity prevention.
4.1 Introduction
Obesity was introduced into the International Classification of Diseases (ICD-9 code 278.0) in the 1950s. However, in the twenty-first century it has already reached epidemic proportions and it will be the leading cause of death and disability in this century worldwide, thus threatening to reverse many of the health gains achieved in recent decades. Surprisingly, obesity is often neglected, being frequently not even thought of as a serious, life-threatening chronic disease.
Definitions and classification
The widely used clinical term ‘obesity’ derives from the Latin ob, for ‘on account of’, and esum, meaning ‘having eaten’. Strictly speaking, obesity is not defined as an excess of body weight but of body fat, to the extent that health may be adversely affected. Despite this important difference, medical criteria for the diagnosis of overweight and obesity do not rely on the measurement of adiposity. By convention set out in international guidelines, overweight and obesity are arbitrarily defined on the basis of the body mass index (BMI) or Quetelet’s index (Table 4.1). The index is calculated by dividing the individual’s weight (expressed in kilograms) by the square of his or her height (expressed in metres). A graded classification is valuable in diagnosing individuals, establishing meaningful comparisons of weight status within and between populations, identifying intervention priorities, and providing a firm basis for evaluating treatments and interventions. Although BMI is widely used as a simple surrogate measure of body fat and has been shown to correlate closely with adiposity, it does not provide an exact description of body composition. The principal limitation of BMI as a measure of body fat is that it does not distinguish fat mass from fat-free mass.
Table 4.1 WHO classification of overweight and obesity in adults according to body mass index (BMI). © WHO (2000).
| Classification | BMI (kg/m2) | Risk of comorbidity |
| Underweight | <18.5 | Lowa |
| Normal range | 18.5–24.9 | Average |
| Overweight | 25.0–29.9 | Increased |
| Obesity | ≥30.0 | |
| Class I Class II Class III (morbid) | 30.0–34.9 35.0–39.9 ≥40.0 | Moderate Severe Very severe |
a Low for the noncommunicable diseases associated with obesity, but there is increased mortality due to cancer and infectious diseases.
The classification of overweight and obesity in children and adolescents is especially complicated by their continually changing height and body composition. During these developmental periods, the changes often take place at different rates and times in diverse populations, making agreement over the diagnosis of overweight and obesity in children and adolescents difficult to establish. Paediatricians in the USA have classically used the 85th and 95th centiles of BMI for age and sex based on US nationally representative survey data as cut-off points to identify overweight and obesity. However, by choosing percentile values, any public health analyses and comparison purposes are minimised due to the fact that cut-off points vary between populations and over time. A standard definition for child overweight and obesity cut-off points for BMI based on international data and linked to the widely accepted adult cut-off points of 25 and 30 kg/m2 has been established, which is more practical and allows comparisons.
The scale of the problem
The obesity epidemic rolls on, without signs of abatement (see Public Health Nutrition in this series). The World Health Organization (WHO) has declared obesity the largest global chronic health problem in adults, emerging as a more serious world problem than malnutrition. Throughout this chapter, the term ‘malnutrition’ refers to under-nutrition. In 2008, 1.5 billion adults, aged 20 and older, were overweight. Of these, over 200 million men and nearly 300 million women were obese. Approximately 65% of the world’s population lives in countries where overweight and obesity kill more people than underweight. While in 1980, 6% of men and 8% of women in Britain were clinically obese, by 1998 those figures had ballooned to 17% of men and 21% of women, and by 2003 the numbers had increased to 22% of men and 24% of women (Figure 4.1). About a fifth of the population was obese and nearly two-thirds of men and over a half of women in England were either overweight or obese. In 2007, the government-commissioned Foresight report predicted that if no action were taken, 60% of men, 50% of women, and 25% of children would be obese by 2050. The extrapolation of current trends indicates that by 2015, 36% of males and 28% of females will be obese, while by 2025, these figures will rise to 47% and 36%, respectively. The growth of obesity in England reflects a worldwide trend. In 1991, 12.0% of US adults were clinically obese (defined as a BMI ≥30.0 kg/m2). By 2000, that figure had grown to 19.8%, representing a 65% increase in a decade. In 1999, an estimated 61% of US adults were overweight or obese, along with 13% of children and 14% of adolescents. In recent decades, the percentages of children and adolescents who are overweight have nearly doubled and almost trebled, respectively. Disparities in overweight and obesity prevalence exist in many segments of the population, based on race and ethnicity, gender, age, and socioeconomic status. In general, the prevalence is higher in women who are members of racial and ethnic minority populations and in those with a lower family income.
Economic impact and global burden
‘Economic evaluation of healthcare’ is the generic term referring to the various methods used to make the costs and benefits associated with any change in health service delivery explicit, while burden- and cost-of-illness studies estimate the absolute amount of resources used in treating a disease over a given period. Unfortunately, the consequences of overweight and obesity are more far-reaching than mere aesthetic problems (Tables 4.2 and 4.3). Excess body weight puts patients at a higher risk of heart disease, hypertension, diabetes mellitus, dyslipidaemia, stroke, osteoarthritis, sleep apnoea, certain cancers, and other serious associated diseases. The problems linked to obesity cause an estimated 18 million sick days and 30 000 deaths a year in the UK. The Foresight Committee estimated that the direct healthcare costs for the treatment of obesity and its consequences were between £991 and 1124 million in 2002, equating to 2.3–2.6% of NHS expenditure (McPherson et al., 2007). An estimate of lost earnings attributable to obesity was £2.3–3.6 billion per year, accounting for an annual total of 45 000 lost working years. Subsequent work suggests that the total impact of obesity on employment may be as much as £10 billion (McCormack & Stone, 2007). In 2000, the total direct and indirect costs attributed to overweight and obesity amounted to US$117 billion in the US. The medical care costs of obesity in the USA are staggering, totalling about US$147 billion in 2008.
Figure 4.1 Increase in the prevalence of obesity in the UK since 1980 and the estimated figures for 2015–2050.
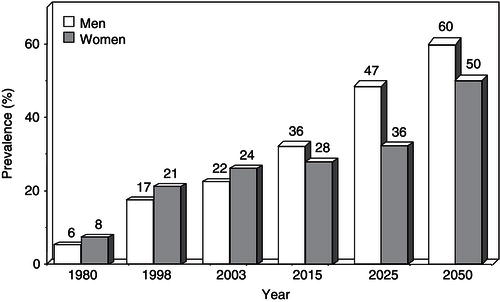
Table 4.2 Reported economic costs of obesity. Adapted from Caterson et al. (2004) © Informa Healthcare.
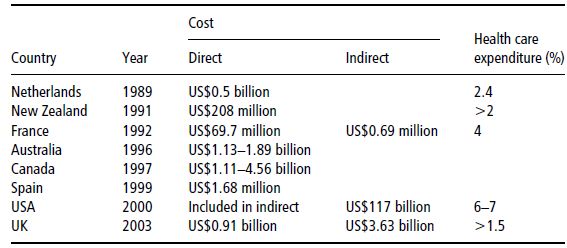
Table 4.3 Diseases used in studies of costs of obesity, and the relative risks (RR) utilised. From Catersonet al. (2004) © Informa Healthcare.
| Frequency of use | Disease | RR range |
| Invariably | Type 2 diabetes mellitus | 2.9–27.6 |
| Frequently | Hypertension | 2.5–4.3 |
| Coronary heart disease | 1.7–3.5 | |
| Gallbladder disease | 1.9–10 | |
| Cancer | 1.2–1.5 | |
| Often | Dyslipidaemia | 1.4–1.5 |
| Stroke | 1.1–3.1 | |
| Osteoarthritis | 1.8 | |
| Occasionally | Gout | 2.5 |
| Venous thrombosis | 2.4 |
In addition to the serious life-threatening diseases associated with obesity, a range of debilitating conditions, such as osteoarthritis, respiratory difficulties, gallbladder disease, infertility, psychosocial problems, and so on, which lead to reduced quality of life and disability, are extremely costly in terms of both absence from work and use of health resources, accounting for approximately 9.4% of US healthcare expenditures (Finkelstein et al., 2009). Overweight and obesity are the fifth leading risk for global deaths. At least 2.8 million adults die each year as a result of being overweight or obese. In addition, 44% of the diabetes burden, 23% of the ischaemic heart disease burden, and between 7 and 41% of certain cancer burdens are attributable to overweight and obesity. Importantly, the risk increases throughout the range of moderate and severe overweight for both men and women in all age groups.
4.2 Aetiology
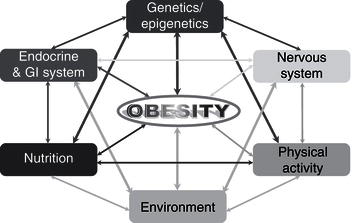
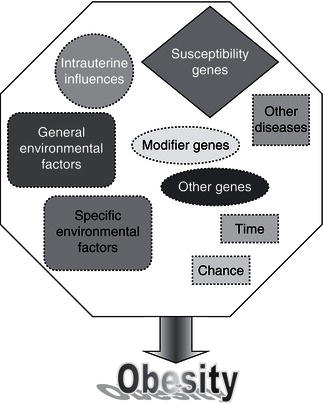
Remarkable new insights into the mechanisms controlling body weight are providing an increasingly detailed framework for a better understanding of the pathogenesis underlying weight gain. Key peripheral signals have been linked to hypothalamic neuropeptide release, and the anatomic and functional networks that integrate these systems have begun to be elucidated. Obesity is a multifactorial disease influenced by both genetic and environmental factors (Figure 4.2). Since obesity has reached epidemic proportions, the epidemiological triad of host, agent, and environment can be used to consider causal factors.
The agent, by definition, is energy imbalance, where energy intake exceeds energy expenditure. This thermodynamic mismatch is determined by both genetic and environmental components.
In the epidemiological triad, features of the host affect obesity in ways that are not well understood. Some individuals appear to be more susceptible than others to weight gain. Genetic factors impinge on appetite, food choices, endocrinology, metabolism, activity, and how the body fine-tunes the balance between energy intake and expenditure. In recent years an alphabet soup of genes has been found to influence everything from food intake to how fat is stored in the body.
The third entity that facilitates an epidemic is the environment, by bringing the susceptible host and the agent together. Environmental factors include our increasingly sedentary lifestyles, as well as social and cultural values. Evidence for a genetic component to obesity is multiple and includes twin studies, adoption studies, familial aggregation, complex segregation analysis, monogenic syndromes, and gene variants that affect the obese phenotypes. Quantitating the exact genetic contribution to a predisposition to obesity has proved difficult. Great progress has been made in understanding the molecular mechanisms underlying phenotypes of altered body weight, adiposity, and fat distribution.
Figure 4.2 Schematic representation of the multifactorial factors influencing the development of obesity (GI: gastrointestinal).
The energy-balance equation
Energy-balance regulation is an extremely complex process, comprising multiple interacting homeostatic and behavioural pathways aimed at maintaining constant energy stores. It is now evident that body-weight control is achieved through highly integrated interactions between nutrient selection, organoleptic influences, and endocrine responses to diet, as well as being influenced by genetic and environmental factors. The brain is known to play a critical role in maintaining whole-body energy balance by regulating energy intake and expenditure in accordance with afferent and efferent signals. Regulation of body weight was once considered a simple feedback control system, in which the hypothalamus modulated food intake to compensate for fluctuations in body weight. The existing body of evidence has fostered the transition from the classic ‘lipostat’ to a multifactorial model, including factors emerging from several different organs.
From an evolutionary point of view, animals feed to satisfy their immediate caloric and nutritional requirements from meal to meal, but also to allow energy and nutrients to be stored in anticipation of high energy demands or seasonal food shortages. Thus, food intake control involves the integration of external environmental cues with multiple internal physiological signals, as well as external social elements and hedonic influences. An obese phenotype, which ultimately expresses a heterogeneous group of conditions with multiple causes, can only occur when energy intake exceeds energy expenditure for an extended period of time. The sustained energy-balance displacement incontrovertibly leads to changes in body energy stores.
Table 4.4 Main influences affecting the human appetite system.
| Influence | Examples |
| Cognitive | Restraint, emotions, previous experiences, conditioned associations |
| Sociocultural | Religious beliefs, education, tradition, learned experiences, economy-acquisition level |
| Gustatory | Palatability, learned/innate preferences, food-specific satiety, nutrient-associated sensory stimuli, cephalic phase events, taste-receptor density |
| Neuroendocrine | Orexigenic and anorexigenic peptides, entero-insular axis, adipostatic signals, sympathetic/parasympathetic balance |
| Gastrointestinal | Nutrient composition, water content, energy density, digestibility, pH, osmolarity, peptidic/hormonal/neural release, stomach size, mechanical distension, emptying rate, absorption |
| Metabolic | Nutrient partitioning/flux, nutrient–genotype interactions, hepatic metabolism |
| Behavioural | Age, sex, socioeconomic status, occupation, meal patterns, physical-activity level, pathophysiology/developmental stage |
Energy intake
The amount of food consumed represents a major contributor to the control of body weight and consequently to obesity development. The biobehavioural food intake control system includes orosensory, gastrointestinal, circulating, nutritional, metabolic, and central influences, which interact to elicit facilitatory or inhibitory signals. The main food and nutrient influences affecting the human appetite system are summarised in Table 4.4. Multiple systems, ranging from elaborated cognitive influences to purely chemical signals, work at different levels to maintain a functional cascade of sequential physiological events in order to regulate hunger and satiety. Feeding patterns, including the amount, kind, and composition of food consumed, are governed by a pleiad of influences from quite diverse anthropological spheres.
With the identification of leptin, research into appetite control has progressed at a phenomenal rate (see Chapter 3 in Nutrition and Metabolism in this series). A complex network of synchronous, redundant, and counterbalancing peptide signals has been identified. These interactions are mainly mediated in the hypothalamus, where orexigenic and anorexigenic signals regulate feeding behaviour via effects on hunger and satiety (Table 4.5). The means by which the body strives to defend fat stores in the face of large variations in day-to-day energy intake and expenditure is a topic of paramount biomedical importance. In this sense, it can be stated that not all peptides are ‘equal’, which implies that the adaptive responses to weight gain and loss are critical and have evolved differentially over time based on teleological reasons. Thus, the efficiency of the peptides and systems aimed at defending the organism against starvation is more important than the anorexigenic pathways.
Progress in understanding the contribution of energy intake to the aetiology of obesity has been seriously confounded by underreporting, averaging about 30% of energy consumption in obese subjects. Whether this phenomenon takes place consciously or subconsciously has not been established. Several causes may underlie underreporting, ranging from changes in eating habits subsequent to the pressure of recording food intake to underestimation of portion size and inadequate knowledge of food composition, as well as forgetfulness. In addition, individual macronutrients are known to exert different effects on eating behaviour as a consequence of their diverse satiating ability.
Based on experiments with manipulated foods and retrospective analyses of dietary records, protein has been suggested to be the most satiating macronutrient, while fat appears to have the weakest effect, which provides support for subjects readily over-eating in response to high-fat foods. However, other factors such as energy density have also to be taken into consideration, since under conditions of isoenergetically dense diets, the high-fat hyperphagia does not occur. The role played by sensory preferences for particular food groups in association with obesity has also been addressed, but the high intersubject variability may mask any potential obese–lean differences. Initially, some epidemiological studies suggested that individuals who reported eating a greater number of small meals had a lower relative weight than those eating fewer but large meals. A review of the literature failed to find any significant association between eating frequency and obesity development.
Table 4.5 Hormones, neurotransmitters,and peptides implicated in food intake control.
| Orexigenic | Anorexigenic |
| Agouti-related protein (AGRP) | Amylin |
| Beacon | Alpha-melanocyte-stimulating hormone (α-MSH) |
| Cerebellin 1 | Bombesin |
| Dynorphin | Brain-derived neurotrophic factor (BDNF) |
| Endocannabinoids | Calcitonin-gene related peptide (CGRP) |
| Gamma-aminobutyric acid (GABA) | Cholecystokinin |
| Galanin | Ciliary neurotrophic factor (CNTF) |
| Glucocorticoids | Cocaine- and amphetamine-related transcript (CART) |
| Ghrelin | Corticotropin-releasing hormone (CRH) |
| Growth hormone-releasing hormone (GHRH) Insulin | Enterostatin Gastrin-releasing peptide (GRP) |
| Interleukin 1 receptor antagonist | Glucagon |
| Melanin-concentrating hormone (MCH) | Glucagon-like peptide 1 and 2 (GLP-1, GLP-2) |
| Motilin | Histamine |
| Neuropeptide Y (NPY) | Interleukin 1, interleukin 2 |
| Noradrenaline (α2 receptor) | Leptin |
| Opioid peptides (β-endorphin) | Neurotensin |
| Orexins/hypocretins | Norepinephrine (β receptor) |
| Oxytocin | |
| Oxyntomodulin | |
| Peptide YY3–36 | |
| Pituitary adenylate cyclase-activated peptide (PACAP) | |
| Prolactin-releasing peptide | |
| Serotonin | |
| Somatostatin | |
| Thyrotropin-releasing hormone (TRH) | |
| Tumour necrosis factor alpha (TNFα) | |
| Urocortin | |
| Xenin |
Energy expenditure
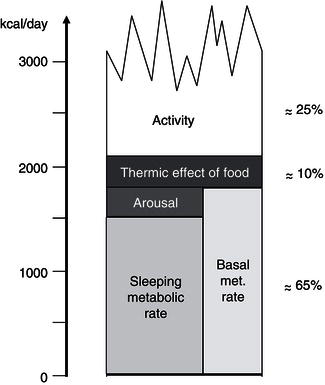
Total energy expenditure (TEE) reflects the sum of three major components: basal metabolic rate (BMR), thermogenesis, and physical activity (Figure 4.3). BMR represents 60–75% of the TEE in sedentary people; it is the energy required to maintain the basic physiological functions such as respiration, circulation, cellular homeostasis, and tissue regeneration. BMR is measured under highly standardised conditions, including determination early in the morning, with the subject at complete rest, in a thermoneutral environment, and after an overnight fast. Approximately 80% of the interindividual variance in BMR can be accounted for by age, fat-free mass, and gender. Potential mechanisms for the remaining variance can be attributed to differences in sympathetic nervous-system activity and skeletal muscle metabolism. Although this leaves some scope for subjects with a relatively low BMR to be predisposed to obesity development, BMR studies have conclusively shown that obese individuals have an increased BMR relative to their lean counterparts.
The thermogenesis compartment comprises the heat production specifically generated for body-temperature maintenance (thermoregulatory thermogenesis), the obligatory heat loss associated with the absorption, transport, and metabolism of recently ingested food (diet-induced thermogenesis, DIT), and the heat production switched on in order to dissipate excess dietary energy as heat (adaptive thermogenesis or luxus consumption). In humans, due to the large body size and subsequent low surface area : volume ratio, thermoregulatory thermogenesis is usually of minor importance. In addition, clothing and heating have minimised the thermogenic challenge of cold stress. Until recently it was assumed that only vestigial amounts of brown adipose tissue (BAT) were present in adulthood. But since 2000, positron emission tomography (PET) studies have clearly shown that BAT is present mainly in the cervical, supraclavicular, axillary, and paravertebral regions of adult humans, providing support for its potential relevance in whole-body energy homeostasis (Frühbeck et al., 2009). The prevalence of active BAT in adults can be estimated only indirectly, but it is thought to be present in at least about 10% of the general population. Recent studies have detected BAT in 3.1% of the men and 7.5% of the women indicating a sexual dimorphism. Nonetheless, prevalence data vary considerably, ranging from as much as 80% in women with breast cancer to 50% in a teenage population. The amount of BAT is inversely correlated with BMI, especially in older people. Furthermore, the probability of detecting active BAT regions is inversely associated with increasing age, suggesting an age-related decline in thermogenesis and energy expenditure. BAT activity is acutely enhanced by cold exposure and stimulated by the sympathetic nervous system. However, it should be borne in mind that statistical association does not imply causality, especially in such a multifactorial biological process as energy-balance regulation. The DIT, also termed postprandial thermogenesis, is mostly obligatory, but does also contain a so-called ‘facultative’ fraction, which is non-obligatory and is stimulated by the sympathetic nervous activity.
The capacity for facultative thermogenesis has been suggested to explain the differential propensity to weight gain during periods of overfeeding. Under carefully controlled experimental conditions and with rigorous determination techniques, any significant role for this energy compartment in the modulation of energy balance during overfeeding has been discarded. However, evidence that the best predictor of interindividual differences in fat gain during over-eating is the so-called non-exercise activity thermogenesis (NEAT) has been provided. Besides the calorie expenditure of activities of daily living, NEAT encompasses the energy costs of all nonvolitional muscle activity, such as muscle tone, posture maintenance, and fidgeting. Interestingly, changes in NEAT have been reported to account for differences in fat storage between individuals, suggesting that as humans over-eat, activation of NEAT dissipates excess energy to preserve leanness, and that failure to activate NEAT may lead to weight gain. Since thermogenesis accounts for only a fraction of TEE (about 10%), the potential for a significant contribution in humans is relatively small, though not negligible.
The most variable component of energy expenditure is represented by physical activity, which may account for 20–50% of TEE. This consists of the sum of all gross muscular work involved in body displacement – including all minor movements – as well as in performing physical work. The ratio of TEE : BMR gives an index of the activity of an individual: the physical activity level (PAL). In humans, the freedom to undertake exercise and everyday lifestyle physical activities accounts for a further high interindividual variability in this energy fraction. Physical work can be divided into weight-independent and weight-dependent activities. Consequently, the energy cost of weight-bearing exercises is highly correlated with body mass and is therefore much higher in obese individuals. Moreover, activity can be further divided according to whether it is essentially obligatory or discretionary. In modern societies, mechanisation has replaced most manual labour. Therefore, leisure-time physical activity is gaining a dominant role in determining energy expenditure. In this respect, the general secular trend towards less-active lifestyles in affluent countries appears as the major contributor to the obesity epidemic.
Genetic factors
Although the search for genes responsible for human obesity has experienced outstanding advances, the genetic explanation for, or susceptibility to, obesity in the vast majority of patients has not been identified. In some rare cases of severe childhood-onset obesity, single gene defects have been accounted for. Further evidence for a genetic component to obesity is derived from twin studies, adoption studies, familial aggregation, complex segregation analysis, monogenic syndromes, and gene variants that affect the obese phenotypes. Quantitating the exact genetic contribution to a predisposition to obesity has proved difficult. Great progress has been made in understanding the molecular mechanisms underlying phenotypes of altered body weight, adiposity, and fat distribution by creating transgenic animal models. A role of utmost importance for genetic factors in body-weight regulation seems difficult to reconcile with the burgeoning of human obesity in the past decades. Available evidence supports the notion that obesity is an oligenic disease, whose expression can be modulated by numerous polygenic modifier genes interacting with each other and with environmental factors such as food choices, physical activity, and smoking (Figure 4.4).
Genetic epidemiology
Genetic epidemiology studies are useful for addressing specific questions pertaining to the extent of familial aggregation in obesity, the relative contribution of nongenetic versus genetic factors, paternal versus maternal transmission, the contribution of shared genetic and environmental factors to covariation among phenotypes, and so on. Monozygotic (MZ) twins share 100% of their genes, while dizygotic (DZ) twins twins share on average half of them. Therefore, twin studies allow for separation of the genetic component of variance. Nonetheless, twins may also share common environmental influences, thus masking the real genetic component. Heritability estimates for BMI derived from twin studies typically cluster between 50 and 80%. The correlations of MZ twins reared apart provide a direct estimate of the genetic effect, given that members of the same pair were not placed in similar environments, that behavioural characteristics were different, and that intrauterine factors did not affect long-term variation in BMI. The heritability of BMI under these circumstances would be in the range of 40–70%.
Adoption studies represent a useful tool for quantifying the contribution of common environmental effects as the adoptive parents and their offspring (and adopted siblings) are exposed to the same environmental sources of variation, while the adoptees and biological parents share only genetic sources of variance. It has to be taken into consideration, however, that selective and late placement in the adoptive home may result in inflated common environmental estimates (translating to reduced heritability estimates) if the placement is based in part on genetic similarity between the biological and adoptive parents. Heritability estimates for the BMI tend to cluster around 30%, with all the remaining variance attributable to nonshared individual environmental factors.
Comparison of resemblance in pairs of spouses, parents, children, brothers, and sisters, including sometimes MZ and DZ twins, for body weight, BMI, and selected skinfold thicknesses, has been approached in family studies. As would be expected, the highest familial correlation appears among MZ twins (0.73), while the lowest is among spouses (0.13). In an intermediate position are the parent–offspring, sibling, and DZ twin correlations, with 0.22, 0.28, and 0.27, respectively. In the Quebec Family Study, based on 1698 members and 409 families, and including nine types of relatives by descent or adoption, a total transmissible variance across generations for BMI of about 35%, but a genetic effect of only 5%, was observed. It can be concluded that the heritability of obesity phenotypes is highest with twin studies, intermediate with nuclear family data, and lowest when derived from adoption data. When several different types of relatives are used jointly in the same design, the heritability estimates typically cluster around 25–40% of the age- and gender-adjusted phenotype variance. In addition, they always tend to be slightly higher for fat-distribution phenotypes than for overall body fat, reaching a value of about 50% for abdominal visceral fat.
In segregation analysis, the phenotype is assumed to be influenced by the independent and additive contributions from the major gene effect, a multifactorial background due to polygenes, and a unique environmental component (residual). An overview of the segregation analysis studies for obesity phenotypes provides evidence for the segregation of a recessive locus with a frequency of about 0.2 and accounting for 35–45% of the variance, with a multifactorial component accounting for 40–45% of the variance. Taken together, the several different existing segregation studies quite consistently indicate that body fat and abdominal visceral fat are influenced by the segregation of a recessive locus, explaining up to about 65% of the variance, in addition to a multifactorial component, accounting for 20–40% of the residual variance. These observations provide evidence for the existence of a subset of obese families in which some genes appear to be more important than others in the genetic aetiology of obesity.
Another interesting topic is the genetic covariation between obesity and comorbidities. Multivariate genetic studies try to address whether or not, and to what extent, the associations between overweight and its associated comorbidities share common genetic and/or environmental aetiologies. In this regard, the Quebec Family Study examined the hypothesis of a shared genetic basis between measures of body fat and other traits of the metabolic syndrome, showing that adiposity and glucose and insulin concentrations are influenced by specific genetic and environmental factors. Furthermore, shared genetic and environmental factors were shown to contribute to the common variance ranging from 5 to 25% between indicators of body fat and insulin within individuals. The obtained results illustrated that there is a shared genetic basis between the two traits, with a bivariate heritability estimate of about 10%. Other studies have investigated the cross-trait familial resemblance between measures of body fat and cardiovascular elements (blood pressure, cholesterol, triglycerides, waist-to-hip ratio, etc.).
In summary, the multivariate genetic studies strongly support the presence of familial aggregation in the clustering of obesity and most of its comorbidities, with family studies showing a common familial basis for the covariation between insulin and body fat, adiposity distribution, blood pressure, lipidaemia, and high-density lipoprotein (HDL) fractions, as well as HDL particle size. Nevertheless, the shared genetic variance between body-fat phenotypes and circulating concentrations of cholesterol and lipoproteins may be lower than for other manifestations of the metabolic syndrome.
Molecular epidemiology
The identification of genes and mutations predisposing to obesity has been principally based on linkage and association studies with candidate genes. Both strategies rely on the principle of co-inheritance of adjacent DNA markers. Linkage studies analyse the cosegregation between a marker locus and a trait within families, whereas association studies test in the population for the cooccurrence of an allele at a marker locus and a trait in unrelated individuals. Candidate genes can be selected on the basis of several approaches:
- Observed influence of the trait in animal models – candidate genes by mutation.
- Known chromosomal locations physiologically or metabolically relevant for the obesity phenotype – functional candidate genes.
- Position in a region of the genome – positional candidate genes, near a Mendelian obesity syndrome, within a quantitative trait locus (QTL) homologous to a locus linked to obesity in animal models or identified through human genome-wide scans.
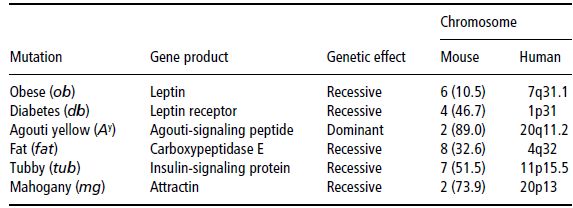
Single gene-mutation mouse models
So far, a small number of single genes with spontaneous mutations have been observed to be responsible for mouse models of obesity. These mutations are listed in Table 4.6. Most human linkage and association studies of the cloned genes from obesity mouse models have yielded negative results, with only a small number of cases of human obesity related to the specific mutations mentioned. Nevertheless, these candidate genes have been extremely useful in providing more insight into the molecular basis of human body-weight control. This is extraordinarily evident in the case of leptin, and how it has contributed to the unravelling of new pathways in the regulation of food intake and energy balance.
Table 4.6 Single-gene mutations of mouse models of obesity and their corresponding chromosomal regions in the human genome.
Functional candidate genes
Potentially, candidate genes can be defined on the basis of an impact on body mass, adiposity, fat distribution, food intake, satiety signals, energy expenditure, diet-induced thermogenesis, physical activity, nutrient partitioning, and comorbidities, among other things. The last update of the human obesity gene map was published in 2006. It reports the number of genes and DNA sequence variations known to be associated and/or linked with obesity-related phenotypes, together with the exact chromosomal locations of the genes (Rankinen et al., 2006). As of October 2005, 176 human obesity cases due to single-gene mutations in 11 different genes had been reported and 50 loci related to Mendelian syndromes relevant to human obesity had been mapped to a genomic region, and causal genes or strong candidates have been identified for most of these syndromes. There are 244 genes that, when mutated or expressed as transgenes in a mouse, result in phenotypes that affect body weight and adiposity. The number of human obesity QTLs derived from genome scans continues to grow, with 253 QTLs for obesity-related phenotypes from 61 genome-wide scans. A total of 52 genomic regions harbour QTLs supported by two or more studies. The number of studies reporting associations between DNA sequence variation in specific genes and obesity phenotypes has also increased considerably, with 426 findings of positive associations with 127 candidate genes. A promising observation is that 22 genes are each supported by at least five positive studies. Among them, those showing replications in 10 studies or more include PPARG, ADRB3, ADRB2, LEPR, GNB3, UCP3, ADIPOQ, LEP, UCP2, HTR2C, NR3C1, and UCP1. It is worth noting that the obesity gene map shows putative loci on all chromosomes except Y. Unfortunately, the Web site devoted to the Human Obesity Map is no longer available.
Positional candidate genes
Positional candidate genes of obesity are considered those whose position in the human genome maps to a chromosomal region containing genes or loci that could influence obesity. Undoubtedly, Mendelian syndromes of obesity represent a good example of positional candidate genes. Although it has been observed that overweight and obesity run in families, most cases do not segregate in families according to a clear pattern of Mendelian inheritance. Nonetheless, some rare Mendelian disorders with obesity as a clinical feature have been described; these are summarised in Table 4.7. Prader–Willi syndrome is the most common of the listed disorders, with an estimated prevalence of 1 in 25 000. For many of the listed syndromes, the specific genetic or molecular defect remains unknown.
Most of the disorders listed share some other clinical features in addition to obesity, such as mental retardation, delayed growth and maturation, hypogonadism, or dysmorphic characteristics such as facies and those affecting the limbs, making them difficult to distinguish and sometimes leading to misclassifications. In this sense, the Laurence–Moon and the Bardet–Biedl syndromes have long been considered a single entity (Laurence–Moon–Bardet–Biedl syndrome) because of the presence of mental retardation, hypogenitalism, and pigmentary retinopathy in both. However, the Laurence–Moon syndrome cannot be considered an obesity syndrome, since obesity is not present in all cases, while it is a characteristic feature of the Bardet–Biedl syndrome. Similarly, the Carpenter syndrome resembles the Summitt syndrome, but obesity is only developed in older patients in the former.
Table 4.7 Disorders with Mendelian inheritance in humans which have obesity as a clinical feature. NA, not available.
| Inheritance | Disorder | Mapping |
| Autosomal dominant | Achondroplasia | 4p16.3 |
| Adiposis dolorosa (Dercum disease) | NA | |
| Albright hereditary osteodystrophy AHO AHO2 | 20q13.3 15q11–q13 | |
| Posterior polymorphous corneal dystrophy | 20p11.2 | |
| Morgani–Stewart–Morel syndrome | NA | |
| Momo syndrome | NA | |
| Prader–Willi syndrome | 15q11.2–q12 | |
| Angelman syndrome | 15q11.2 | |
| Ulnar-mammary Schnizel syndrome | 12q24.1 | |
| Familial partial lipodystrophy type 2 type 3 type 4 | 1q22 3p25 15q26 | |
| Insulin-resistance syndrome (Rabson–Mendenhall syndrome) | 19p13.3–p13.2 | |
| Thyroid hormone-resistance syndrome | 3p24.2 | |
| Polycystic ovarian syndrome (PCOS1) | 19p13.2 | |
| Autosomal recessive | Alström syndrome | 2p13 |
| Bardet–Biedl syndrome BBS1 BBS2 BBS3 BBS4 BBS5 BBS6 BBS7 BBS8 BBS9 BBS10 BBS11 BBS12 BBS13 BBS14 BBS15 | 11q13 16q21 3q11.2 15q22.3–23 2q31.1 20p12 4q27 14q31.3 7p14 12q21.2 9q33.1 4q27 17q22 12q21.32 2p15 | |
| Berardinelli–Seip congenital lipodystrophy type 1 type 2 type 3 type 4 | 9q34 11q13 7q31.1 17q21.2 | |
| Biemond syndrome | NA | |
| Cohen syndrome | 8q22.2 | |
| Carbohydrate-deficient glycoprotein syndrome t Ia | 16p13 | |
| Fanconi–Bickel syndrome | 3q26.1–26.2 | |
| Cushing disease | NA | |
| Macrosomia adiposa congenita | NA | |
| Pickwickian syndrome | NA | |
| Urban–Rogers–Meyer syndrome | NA | |
| Short stature–obesity syndrome | NA | |
| Summitt syndrome | NA | |
| X-linked | Börjeson–Forssman–Lehman syndrome | Xq26.3 |
| Choroideremia with deafness and obesity | Xq21.1 | |
| Mehmo syndrome | Xp22.13–p21.1 | |
| Chudley-McCullough syndrome | NA | |
| Wilson–Turner syndrome | Xp21.1–q22 | |
| Simpson–Golabi–Behmel syndrome SGBS1 SGBS2 | Xq26.1 Xp22 |
Furthermore, positional candidate genes of obesity can be identified from genomic scans with a set of evenly spaced genetic markers covering the entire genome. Box 4.1 lists the first nine relevant genome-wide scans of obesity carried out, while Table 4.8
Related posts:

Stay updated, free articles. Join our Telegram channel

Full access? Get Clinical Tree


