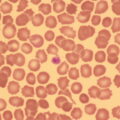
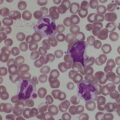
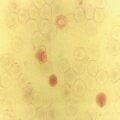
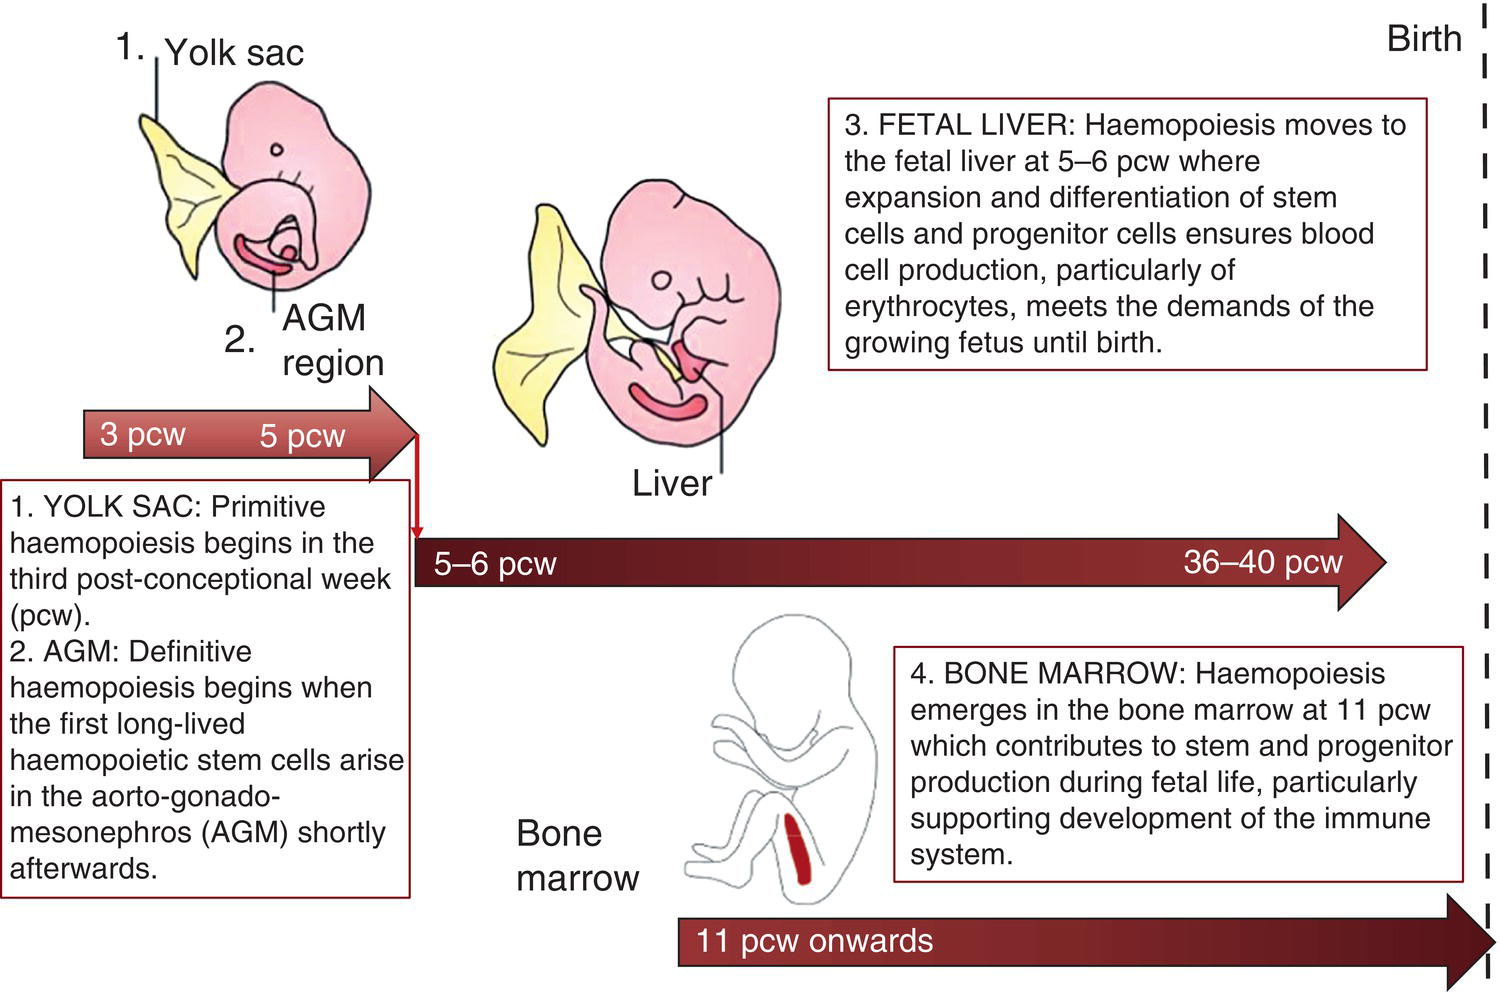
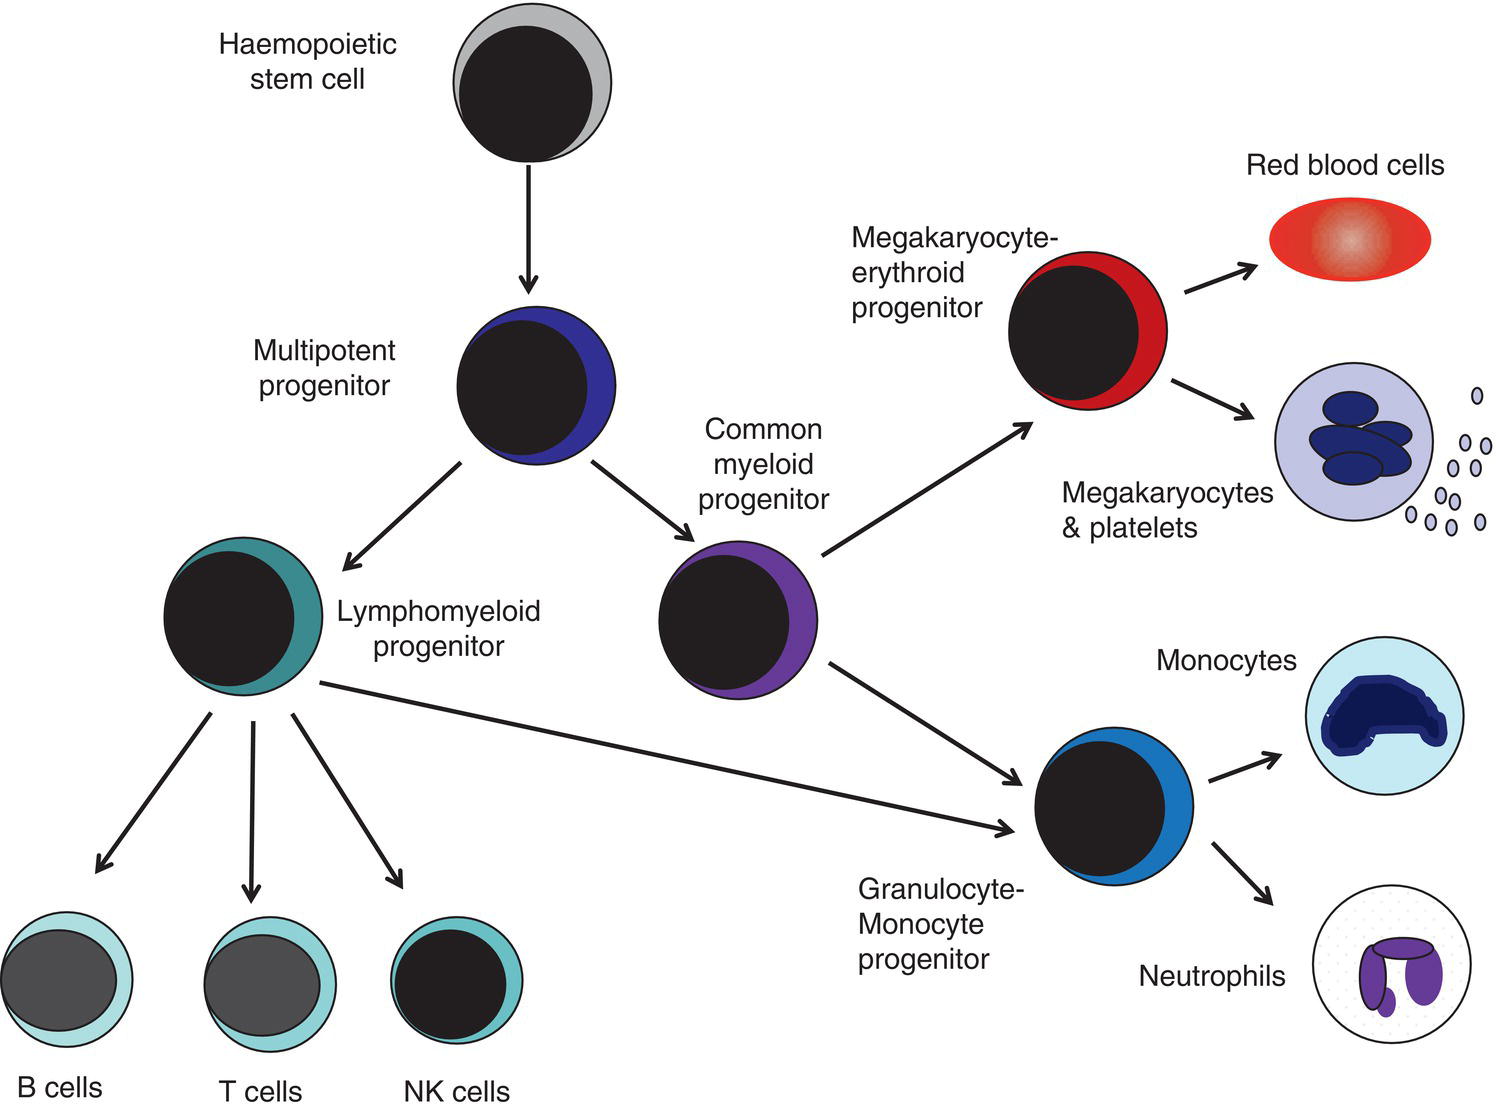
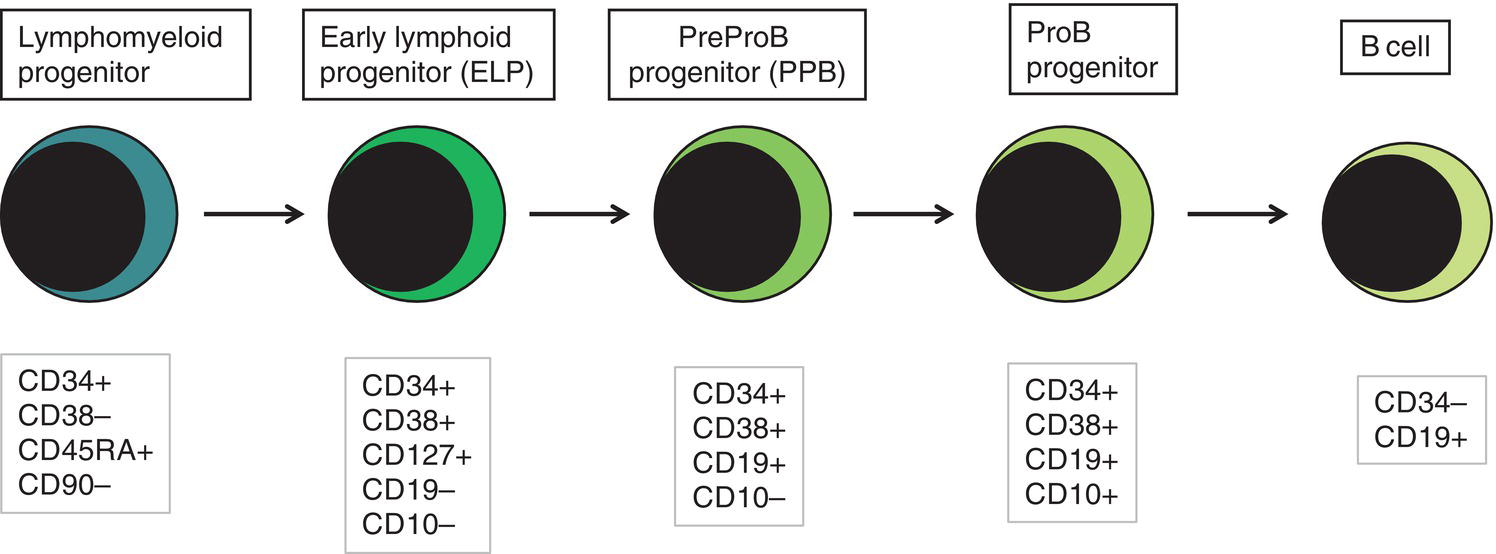
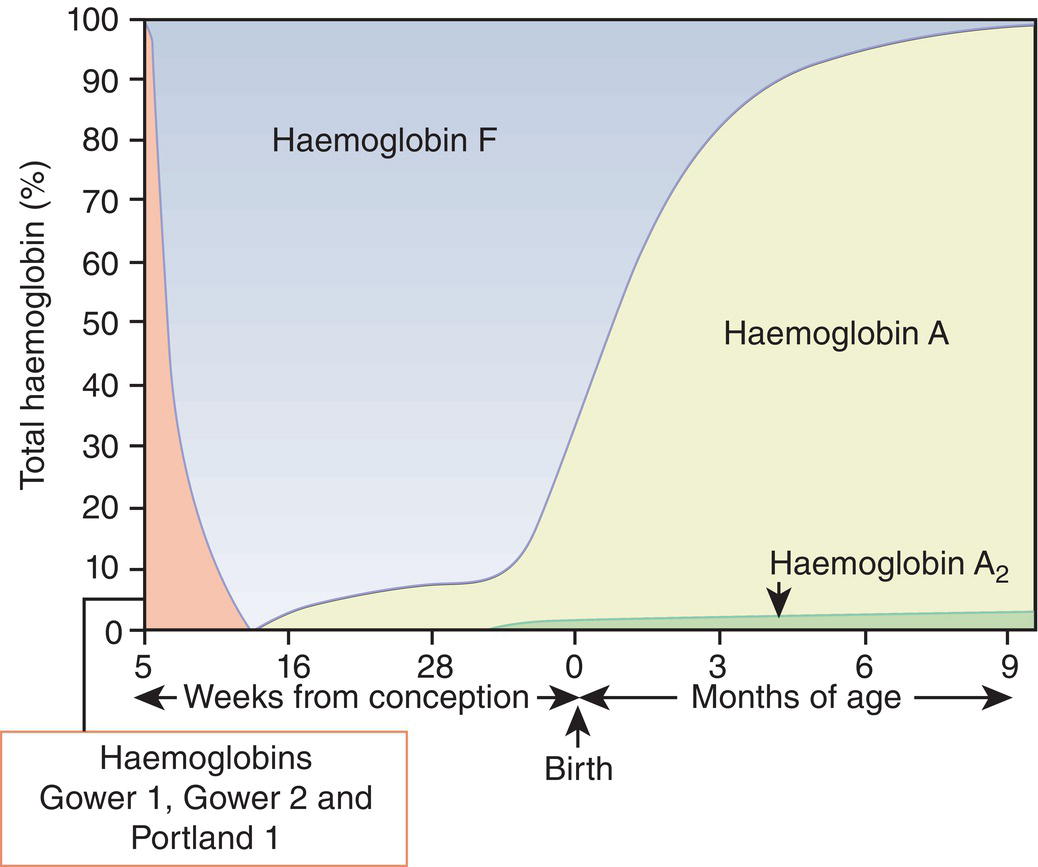
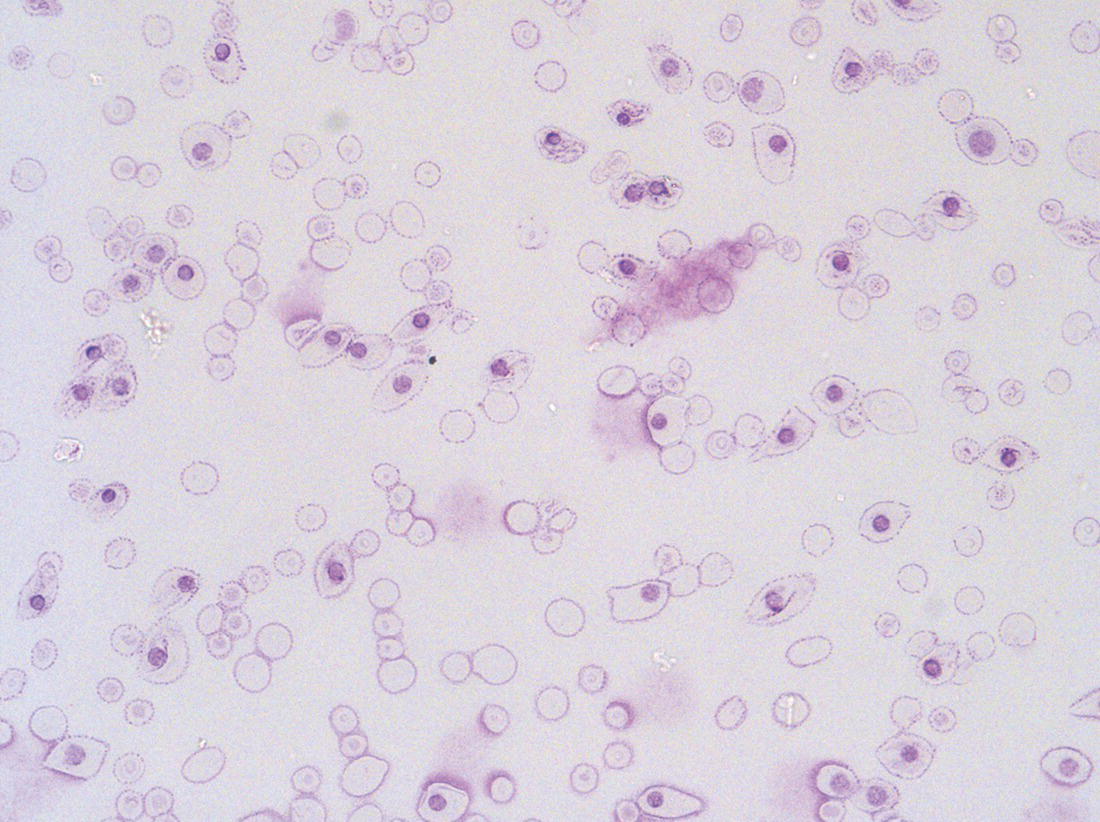
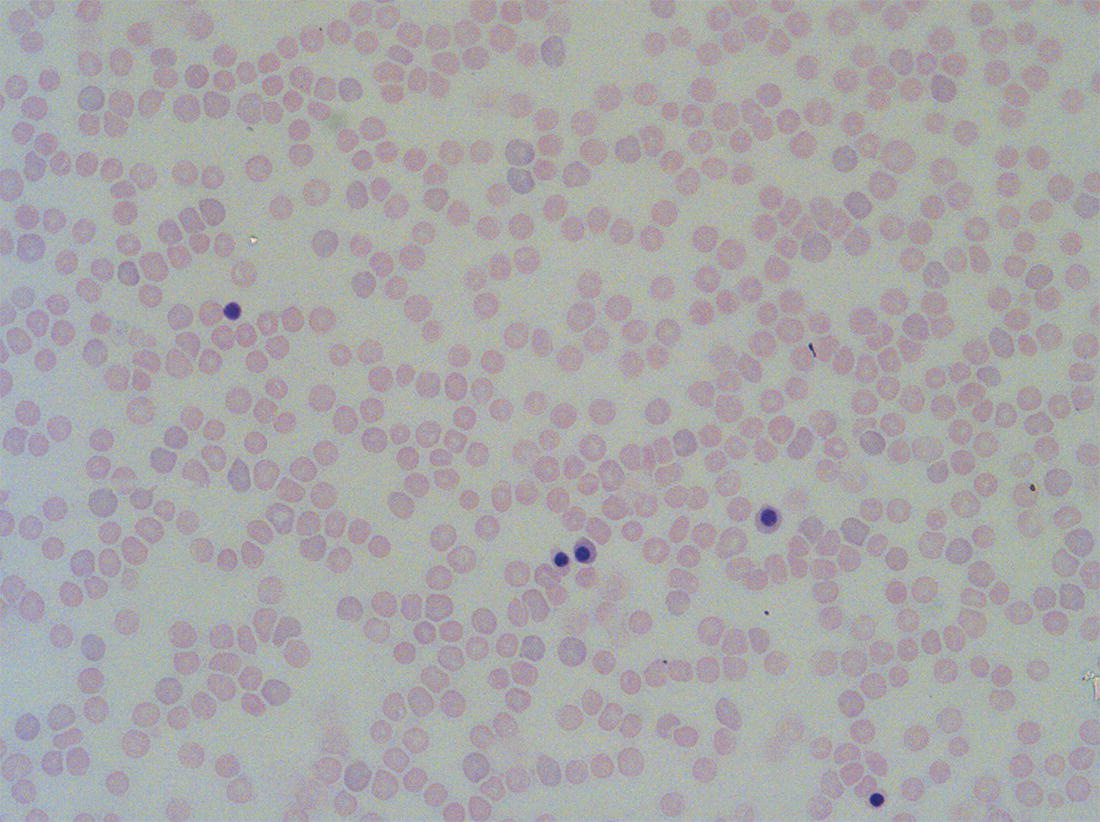
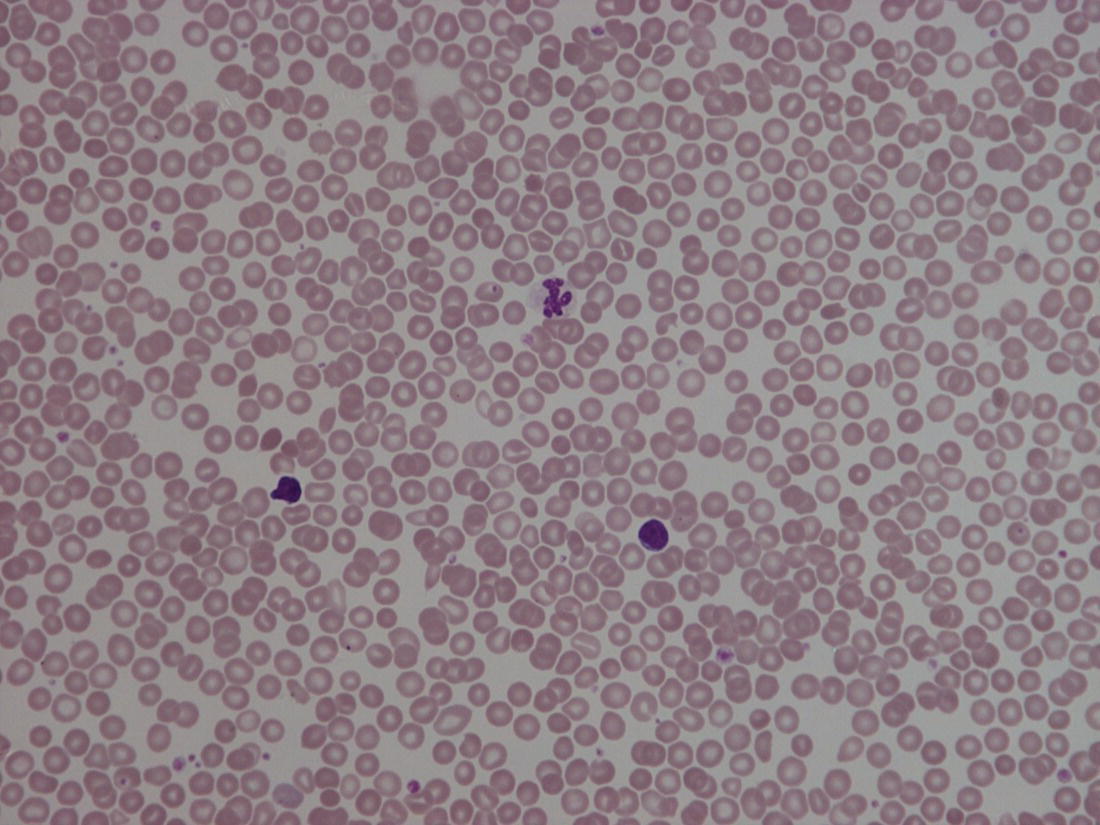
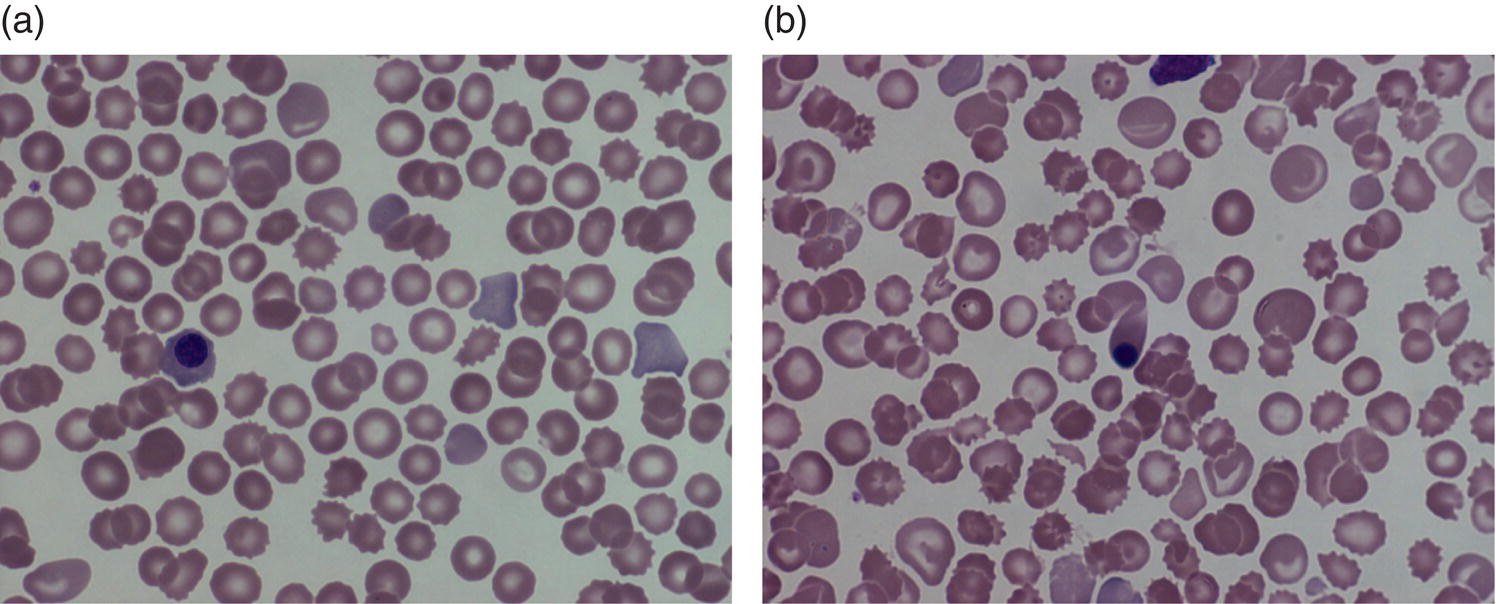
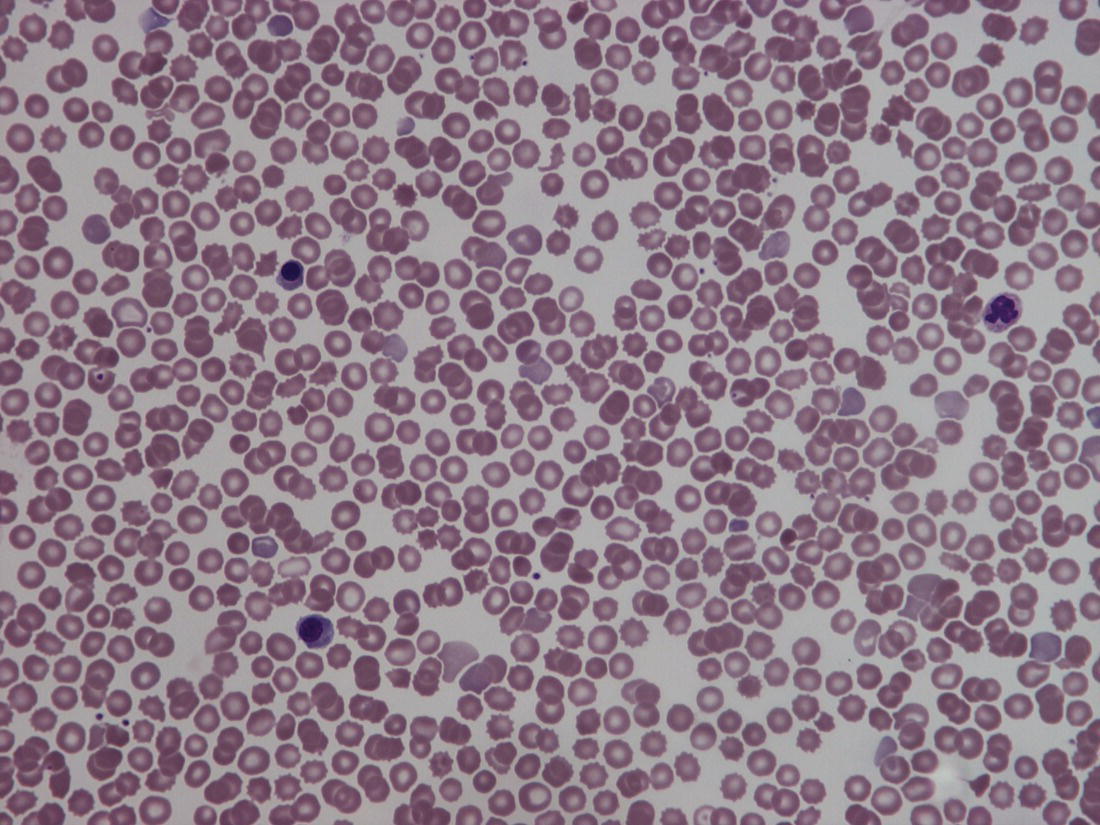
Haemopoiesis is the process that ensures life‐long production of haemopoietic cells. In newborn infants the process has many distinct features that differ from those in older children and adults. These differences reflect both the ontogeny of haemopoiesis during fetal development and the unique interaction between the fetus and mother, as well as the effects of birth itself. The sequential changes in the sites and regulation of haemopoiesis during development also help to explain the natural history of many neonatal haematological problems. Haemopoiesis in humans begins in the yolk sac between 2 and 3 weeks post‐conception (Fig. 1.1).1,2 This is known as primitive haemopoiesis. Studies in other species, particularly in mice, indicate that the predominant cell types produced in the yolk sac are erythroid cells and macrophages.2,3 While megakaryocytes and lymphoid cells may also be yolk sac‐derived, the current consensus of opinion is that true, long‐lived haemopoietic stem cells (HSC) arise from a region of specialised endothelium (‘haemogenic’ endothelium), which is localised to the ventral wall of the dorsal aorta in a region known as the aorto‐gonado‐mesonephros (AGM).4–6 In humans, haemopoiesis begins in the AGM at around 5 weeks post‐conception and is known as definitive haemopoiesis.6–8 Haemopoiesis in the aortic wall is only transient, presumably because this region lacks the necessary physical space and specialised microenvironment to support expansion and differentiation of the HSC and progenitor populations required to meet the needs of the growing fetus. By 6 weeks post‐conception, HSC and progenitor cells have migrated to the fetal liver,8,9 which remains the main site of blood cell production throughout fetal life10,11 and AGM haemopoiesis ceases. The first signs of haemopoiesis in the bone marrow are evident from around 11 weeks post‐conception.8,12 Although fetal bone marrow is able to give rise to cells of all lineages, it is becoming clear that the predominant cell types produced in the bone marrow are B lymphocytes and their progenitor cells together with granulocytes, monocytes and their progenitors. Although erythropoiesis and megakaryopoiesis take place in the fetal bone marrow from the end of the first trimester, most red blood cell and megakaryocyte production takes place in the fetal liver until shortly before term.8 Thus, for preterm infants, the liver is the main haemopoietic organ at and shortly after birth; this is likely to be a contributory factor in a number of disorders, including the haematological abnormalities seen in neonates with Down syndrome (see pages 154–160 and 206). Fig. 1.1 Ontogeny of human haemopoiesis in embryonic and fetal life. AGM, aorto‐gonado‐mesonephros; pcw, post‐conceptional week. Based on references 1 and 2. Major advances in the immunological and molecular tools available to analyse haemopoietic stem and progenitor cells have allowed us to build up a much clearer picture of the process of haemopoiesis in fetal life and how this differs from adult life. Fetal HSC, like adult HSC, are the cells at the top of the haemopoietic hierarchy (Fig. 1.2). When HSC divide, they do so either through a process of ‘self‐renewal’, where they generate more HSC (sometimes referred to ‘symmetric cell division’), or through asymmetric division during which one of the two daughter cells differentiates into progenitor cells, which in turn generate the mature cells of all the haemopoietic lineages (Fig. 1.2).9 Studies in mice, and more recently in humans, indicate that fetal HSC are markedly different from those in adult bone marrow.913–16 Elucidating the nature of the differences between fetal and adult HSC, and the molecular mechanisms that underpin these differences, is likely to help our understanding of many of the haematological problems that affect neonates and potentially open up new approaches to treatment. For example, the need for rapid expansion of haemopoietic cells to meet the needs of the growing fetus means that the numbers of fetal HSC have to increase more rapidly than at any other time of life. Furthermore, since HSC are responsible for life‐long haemopoiesis, this process of HSC expansion needs to be precisely regulated to prevent either uncontrolled proliferation (and the risk of haematological malignancy) on the one hand or HSC ‘exhaustion’ (and the risk of bone marrow failure) on the other. These properties are thought to underlie the particular prevalence of certain haematological diseases in fetal and neonatal life, including Diamond–Blackfan anaemia and juvenile myelomonocytic leukaemia.17 Fig. 1.2 A simplified scheme of the fetal haemopoietic stem and progenitor cell hierarchy showing the differentiation of multipotent and committed progenitor cells from haemopoietic stem cells. Details of the fetal‐specific pathway of B lineage progenitor differentiation are shown in Fig. 1.3. Based on reference 9. There are differences both in the intrinsic properties of the HSC and in the regulatory signals produced by the haemopoietic microenvironment during fetal life.16 One of the characteristic intrinsic differences in fetal HSC is the increased proportion of HSC that are actively cycling and undergoing a process of ‘self‐renewal’ that results in expansion of the pool of long‐lived HSC in fetal life.18 This behaviour of fetal HSC contrasts dramatically with adult HSC which are largely quiescent cells that enter the cell cycle infrequently.9,16,18 The amplification in fetal HSC numbers probably takes place mainly in fetal liver rather than in the bone marrow,16,19 which may explain why so many haematological disorders in neonates are accompanied by hepatomegaly. A second characteristic of fetal HSC is that they are primed to give rise to a higher proportion of erythroid and megakaryocytic progenitors compared with adult HSC, reflecting the requirement of the fetus for large numbers of red blood cells and the importance of adequate numbers of platelets to maintain vascular integrity.9,17 Finally, fetal HSC exhibit different sensitivity to and dependence upon haemopoietic growth factors, such as insulin‐like growth factors, compared with adult cells20,21 and a different pattern of mature cell output.9,16,18 Reflecting this, fetal HSC also have unique gene expression programmes,1315–17,22–26 which have recently been shown to be important in the leukaemic transformation events that lead to infant acute lymphoblastic leukaemia (ALL).27 The different types of haemopoietic progenitor cell present in fetal life are shown in Figs 1.2 and 1.3. The overall scheme of differentiation of HSC is similar in fetal and adult life. However, recent studies have identified fetal‐specific lymphoid progenitors, including early lymphoid progenitors (ELP) and PreProB progenitors that may be important not only to rapidly boost B cell production during the second trimester, but also to act as targets of leukaemic transformation in infant and childhood ALL.927–29 ELP are found very early in fetal life (from around 6 weeks post‐conception in the fetal liver and from around 11 weeks post‐conception in bone marrow) but are very rare in adult haemopoietic tissues.29 They are defined both by their immunophenotype (CD34+CD127+CD19−CD10−) and their ability to generate B, T and NK cells as well as a small number of myeloid cells.8,29 PreProB progenitors are one of two types of committed B progenitor cell in fetal life; they lack expression of the CD10 molecule and, like ELP, are very rare in adult bone marrow. By contrast, the second type of B progenitor, the ProB progenitor, is CD10+ and is the main, or sole, type of B progenitor found in adult bone marrow.29 It is likely that ProB progenitors lie downstream of PreProB in B lymphoid differentiation and, consistent with this, they have been shown to have undergone complete VH‐DH‐JH rearrangement of their immunoglobulin heavy chain (IgH) loci, in contrast to ELP and PreProB progenitors, which show only partial (DH‐JH) IgH rearrangement.8 The reasons for the existence of two types of B progenitor and a unique ELP cell in fetal life are unknown but it suggests that there are two pathways of fetal B cell production which may have different physiological roles. Fig. 1.3 Immunophenotypically defined progenitor populations along the B cell differentiation trajectory in the human fetus. The cell surface markers used to define these populations are shown below each cell type. Based on reference 9. Normal erythropoiesis, the production of red blood cells, is crucial to early embryonic and fetal development. Most of our knowledge about the cells and genes involved in this process derives either from mouse models or from inherited anaemias, particularly in children. Almost all the characteristic features of red blood cells are different in the fetus and the newborn compared with their adult counterparts. These differences are even greater in preterm neonates and are directly relevant to our understanding of neonatal anaemias. The differences in erythropoiesis during fetal development are summarised in Table 1.1 and those that are important for our understanding of neonatal anaemias are discussed below. Table 1.1 Features of fetal and neonatal red cells compared with adult red cells 2,3‐DPG, 2,3‐diphosphoglycerate; NADPH, nicotinamide adenine dinucleotide phosphate; PFK, phosphofructokinase. The principal cytokine responsible for regulating erythropoiesis in the fetus and newborn, as in adults, is erythropoietin (EPO).30 Since EPO does not cross the placenta, EPO‐mediated regulation of fetal erythropoiesis is predominantly under fetal control. The liver is the main site of EPO production in the fetus31 and the only stimulus to production under physiological conditions is hypoxia with or without anaemia (reviewed in reference 32). Little or no EPO is produced under normoxic conditions, but hypoxia very rapidly triggers expression by up to 200‐fold within 30 minutes, at least in hepatocyte cell lines.33 This explains the high EPO levels in fetuses of mothers with diabetes mellitus or hypertension and in those with intrauterine growth restriction (IUGR) or cyanotic congenital heart disease;34 EPO is also increased in fetal anaemia of any cause, including haemolytic disease of the fetus and newborn (HDFN). This, and the switch of EPO production from fetal liver to the neonatal kidney, may in part explain the physiological delay in triggering the production of new red blood cells, which is often not evident until the second month of life, even in healthy babies. The rates of haemoglobin synthesis and red blood cell production fall dramatically immediately after birth and remain low for the first 2 weeks of life, probably in response to the sudden increase in tissue oxygenation at birth.35 In healthy neonates the physiological rise in red cell production starts several weeks later, so that by 3 months of age a healthy infant, whatever the period of gestation at birth, should be able to produce up to 2 ml of packed red blood cells every day.35 Studies in preterm neonates have estimated that over the first 2 months of life the maximal rate of red blood cell production may be closer to 1 ml/day. This is based on the observation that preterm babies receiving therapeutic EPO are unable to maintain their haemoglobin if more than 1 ml of blood per day is venesected for diagnostic purposes but can do so where sampling losses are less than this.36 The gestation‐related changes in globin chain synthesis in the human embryo, fetus and neonate have been studied in detail and are summarised in Fig. 1.4.37 The first haemoglobins, known as embryonic haemoglobins, are synthesised from approximately 2 or 3 weeks post‐conception, predominantly in the blood islands of the yolk sac, by the erythroblasts and red blood cells generated there. There are three embryonic haemoglobins (see Table 1.1). ζ or α globin, encoded by adjacent genes in the α globin locus on chromosome 16, combine with ε or γ globin, encoded by genes in the β globin locus on chromosome 11, to produce haemoglobin Gower 1 (ζ2ε2), haemoglobin Gower 2 (α2ε2) and haemoglobin Portland (ζ2γ2). During normal human development, synthesis of embryonic haemoglobins is transient and largely restricted to yolk sac‐derived erythroblasts which are larger than those generated once definitive haemopoiesis starts in the AGM and fetal liver (Figs 1.5 and 1.6) and express different transcription factor and epigenetic programmes. From 4 or 5 weeks post‐conception, erythroblasts and red blood cells contain mainly haemoglobin F (α2γ2), which remains the principal haemoglobin throughout fetal life. The factors that control the switch from primitive to definitive erythropoiesis are not yet clear due to the difficulties in studying this process at such an early stage of development. Understanding more about the mechanisms which normally silence expression of ζ globin would potentially open up new ways of treating α thalassaemia major,38 an important cause of fetal and early neonatal death (see Chapter 2). Fig. 1.4 Diagrammatic representation of the sites and rates of synthesis of different haemoglobins in the embryonic and fetal periods and during infancy. From Bain (2020)37. Fig. 1.5 First trimester (8 weeks) fetal blood film showing the large size of the erythroblasts (compare with Fig. 1.6) typical of those derived from the yolk sac. These erythroblasts contain mainly embryonic globins. Note the high proportion of red cells that are nucleated and the absence of white blood cells. May–Grünwald–Giemsa (MGG), ×40 objective. Fig. 1.6 Second trimester (14 weeks) fetal blood film showing typical erythroblasts derived from definitive haematopoiesis. These erythroblasts contain mainly fetal haemoglobin. Note the smaller size of the erythroblasts and the higher proportion of enucleated red cells compared with the first trimester (Fig. 1.5). MGG, ×40. The production of adult haemoglobin (haemoglobin A; α2β2) begins during the second trimester and remains at low levels until 30–32 weeks post‐conception, when haemoglobin A production starts to increase concomitantly with a fall in haemoglobin F production. The net result is an average haemoglobin F in term babies of 70–80% and haemoglobin A of 25–30%.39,40 After birth, haemoglobin F falls, to approximately 2% by the age of 12 months, with a corresponding increase in haemoglobin A. The molecular control of this change from haemoglobin F to haemoglobin A is termed globin switching. In recent years, there has been considerable research into the genes involved in globin switching (e.g. BCL11A) in order to identify strategies to delay or reverse this physiological switch after birth and so maintain haemoglobin F production for children affected by severe β globin disorders such as sickle cell disease or thalassaemia major.41,42 The timing of globin switching depends on post‐conceptional age rather than postnatal age. In fact, in term babies there is little change in haemoglobin F in the first 15 days after birth, but in preterm babies who are not transfused, haemoglobin F may remain at the same level for the first 6 weeks of life before haemoglobin A production starts to increase. This delay in haemoglobin A production (i.e. the switch from γ globin production to β globin production) can make the diagnosis of β globin disorders in the neonatal period difficult, particularly in preterm infants. This is in contrast to α globin disorders, which are almost invariably evident at birth since α globin chains are essential for the production of all but the very earliest embryonic haemoglobins (see Fig. 1.4 and Table 1.1). Neonatal red blood cells, particularly in preterm babies, have a shorter lifespan than adult red blood cells. Red cell lifespan is inversely proportional to gestational age at birth. Studies over 50 years ago using isotopically labelled red blood cells estimated red blood cell lifespans for preterm infants at 35–50 days, compared with 60–70 days for term infants and 120 days for healthy adults.35 More recent estimates, using mathematical modelling and transfusion of autologous cord blood cells, have also calculated the red cell lifespan in preterm neonates to be approximately 50 days.43 The reasons for a lower red cell lifespan in neonates, although not fully understood, are thought to include the many biochemical and functional differences in the membrane of neonatal versus adult red blood cells (see Table 1.1). Known differences between neonatal and adult red blood cells include increased resistance to osmotic lysis, increased mechanical fragility, increased total lipid content with an altered lipid profile, increased insulin‐binding sites and reduced expression of blood group antigens such as A, B and I.35 Together these differences translate into the characteristic morphological differences seen in neonatal blood films, particularly in preterm neonates (Figs 1.7–1.9), and are associated with accelerated red cell membrane loss44 leading to reduced red cell lifespan. Indeed, the distinctive geometry of neonatal red blood cells and the membrane deformability of some of the irregularly shaped cells have been compared to the properties of red blood cells in the inherited red cell membrane disorders.45 Fig. 1.7 Normal blood film at term. MGG, ×40. Fig. 1.8 Normal preterm red cells at different gestational ages: (a) baby born at 28 weeks’ gestation showing echinocytes, polychromatic macrocytes and one nucleated red blood cell (NRBC); (b) baby born at 25 weeks’ gestation showing numerous echinocytes, echinocytic fragments and one NRBC. Note that anisocytosis and poikilocytosis is greater at 25 weeks than at 28 weeks. MGG, ×100. Fig. 1.9 Blood film of a normal preterm baby (born at 28 weeks’ gestation) showing a degree of erythroblastosis. MGG, ×40. There are major differences between the metabolism of fetal or neonatal red blood cells and that of adult red blood cells. These differences affect not only the functional properties of the red cells of healthy fetuses and neonates but also the clinical impact of inherited and acquired red cell disorders. Both the glycolytic pathway and the pentose phosphate pathway are affected (see Table 1.1). Overall, glycolysis and glucose consumption are lower in neonatal red blood cells than in adult red blood cells. This occurs despite the increased activity of most glycolytic pathway enzymes, such as glucose‐6‐phosphate dehydrogenase (G6PD), pyruvate kinase and lactate dehydrogenase (LDH), and is thought to be the result of reduced phosphofructokinase activity. Neonatal red cells also have less ability to generate the reduced form of nicotinamide adenine dinucleotide phosphate (NADPH) via the pentose phosphate pathway and have lower levels of glutathione peroxidase than adult red blood cells. The net result is that neonatal red blood cells are more susceptible than adult cells to oxidant‐induced injury.46 In addition, neonatal red blood cells have a lower level of methaemoglobin reductase (about 60% of that in adult red blood cells). Methaemoglobin levels are therefore slightly higher in neonates than in adults (mean 4.3 g/l in preterm neonates, 2.2 g/l in term neonates and 1.1 g/l in adults).35 Neonates are also more likely to develop methaemoglobinaemia because they are susceptible to the toxic effects of chemicals, such as nitric oxide and local anaesthetics, that oxidise haemoglobin‐derived iron more rapidly than the maximal possible rate of methaemoglobin reduction (see Chapter 2, Case 2.7). Although stores of iron are adequate at birth in term babies born to well‐nourished mothers, this is not always the case in preterm neonates. This is because the majority of fetal total body iron is stored during the third trimester. Estimates have shown that total body iron increases from 35–40 mg at 24 weeks’ gestation to 225 mg at term, with the result that preterm neonates, especially those with IUGR, are born with lower iron stores than term neonates.47,48 These amounts of iron are equivalent to 6 months iron store for a term neonate49 but only around 2 months for extremely preterm neonates unless they are given supplementary iron. In addition, preterm neonates have an increased requirement for iron both because of their rapid growth rate and because of frequent phlebotomy.50,51 Therefore, preterm neonates generally develop iron deficiency after 2–4 months if the recommended daily intakes are not maintained.52 Administration of iron supplements to preterm babies leads to a slightly higher haemoglobin concentration (Hb) and improved iron stores, thereby reducing the risk of subsequent iron deficiency anaemia.53 The recommended iron intake of preterm infants with a birthweight of 1500–2000 g is 2 mg/kg/day from 2 to 4 weeks of life using iron‐containing human milk fortifier or preterm formula milk and/or iron supplements until at least 6 months of age.54 For very low birthweight neonates, a higher daily iron intake (2–3 mg/kg/day) is usually recommended, starting at 2 weeks of age.54 The regulation of iron status in the neonate, even in those who are born extremely preterm, has recently been shown to depend on the action of hepcidin, erythroferrone (ERFE), ferroportin and EPO, as in adults.55,56 Thus, hepcidin falls when iron deficiency develops, facilitating increased iron absorption, while hepcidin is upregulated when iron stores are sufficient, triggering degradation of the iron exporter ferroportin, which results in inhibition of iron absorption and mobilisation.57 Like serum ferritin, hepcidin levels increase with gestational age and in parallel with the increasing iron stores.58 Hepcidin and pro‐hepcidin levels in term and preterm infants vary in response to inflammation, infection and red blood cell transfusion.59–61 ERFE, an erythroid hormone, acts as a direct suppressor of hepcidin expression in the liver in response to EPO. Little is known about the role of ERFE in regulating iron metabolism in neonates but some preliminary data suggest that although the components of the EPO–ERFE–hepcidin–ferroportin axis are present in neonates,55 ERFE‐mediated suppression of hepcidin is impaired, at least in preterm neonates.62 Typical normal values for red cell variables in the fetus and neonate are shown in Tables 1.2 and 1.3.63–68 At birth, the Hb in term infants is high (140–215 g/l), which compensates for the low oxygen concentration in the fetus. The range of normal values for Hb and haematocrit have been updated to reflect the changes in neonatal medicine, including the lower limit of gestation of neonates admitted for neonatal intensive care. Jopling et al. published the results of a retrospective study of archived laboratory measurements of Hb and haematocrit from approximately 25 000 neonates analysed on the same equipment in a single group of hospitals between 2002 and 2008.69 They found an approximately linear increase in both Hb and haematocrit between 22 weeks’ and 40 weeks’ gestation calculated from samples collected within 6 hours of birth. In contrast to adults, no differences in Hb or haematocrit were seen between male and female neonates. Table 1.2 Impact of gestational age at birth on the principal blood count parameters in healthy neonates* * Values for Hb, Hct, MCV and MCH are based on reference ranges in Christensen et al.63 Values for leucocytes and NRBCs are based on reference ranges in references 64–67 and our own hospital laboratory data (unpublished); values for peripheral blood blast cells and platelets are based on Roberts et al.68 Hb, haemoglobin concentration; Hct, haematocrit; MCH, mean cell haemoglobin; MCV, mean cell volume, NRBC, nucleated red blood cell. Table 1.3 Impact of postnatal age on Hb and Hct values in healthy term and preterm neonates* * Values are based on reference ranges in Christensen et al. 2009.63 Hb, haemoglobin concentration; Hct, haematocrit; In the absence of red cell transfusion, the Hb and haematocrit fall over the first few weeks of life due to the physiological reduction in red blood cell production. In term babies, the average Hb falls from 180 g/l at birth to 140 g/l at the age of 4 weeks,69 reaching a nadir of around 100 g/l at 2 months of age. Studies of healthy preterm infants carried out almost 50 years ago reported a more rapid fall in Hb than in term babies, reaching a mean of 65–90 g/l at 4–8 weeks postnatal age (reviewed in reference 35). However, these differences are difficult to interpret because of the variable clinical course of preterm infants and the effects of red cell transfusion, particularly in neonates of less than 26 weeks’ gestation at birth. More recently, data from non‐transfused neonates have confirmed the lower Hb nadir in preterm neonates, with a mean Hb 28 days after birth of approximately 105 g/l in neonates with a gestational age at birth of 29–36 weeks and 130 g/l for term neonates.69 The mean cell volume (MCV) of red blood cells in healthy neonates at birth is higher than that in older children and adults and is inversely proportional to gestational age (Table 1.2).63,68 The average MCV of a term neonate is about 105 fl, while extremely preterm neonates with a gestational age of less than 26 weeks typically have an MCV averaging about 120 fl.63 Similarly, the mean cell haemoglobin (MCH) at birth is higher in preterm neonates than in term neonates, averaging 40 pg in a preterm neonate of less than 26 weeks’ gestation and about 36 pg in a term neonate.63 The MCV, but not MCH, has been reported to be significantly lower in black preterm compared with white preterm neonates, although this may reflect a higher prevalence of α thalassaemia trait in these neonates as this was not specifically investigated.70 In contrast to the MCV and MCH, the mean cell haemoglobin concentration (MCHC) does not change significantly during gestation70 and, unlike in older children, changes in MCHC are not very useful for diagnostic purposes in neonates. In term babies, the MCV and MCH fall slowly over the first few weeks of life, with a lower limit of normal of 77 fl and 26 pg, respectively.63 The same pattern is seen in preterm neonates although the high frequency of red cell transfusions means that reliable data are not available. Two newly available automated red cell parameters generated as part of a full blood count, MicroR and HYPO‐He, have recently been evaluated in neonates.71 In adult red blood cells, MicroR provides an automated measure of the percentage of red blood cells with an MCV of <60 fl and HYPO‐He measures the percentage of red blood cells with an MCH of <17 pg. Bahr and colleagues created new reference ranges for neonates based on analysis of more than 11 000 blood counts and used them to show that a combination of MicroR and HYPO‐He was more sensitive than MCV/MCH in identifying iron deficiency at birth.71 Further validation of these results in prospective studies and assessment of the impact of gestational age will be needed to determine the value of these new parameters in the diagnosis of neonatal iron deficiency and anaemia. The reticulocyte count falls rapidly after birth as erythropoiesis declines. In term babies it then starts to increase at 7–8 weeks of age, reaching 35–200 × 109/l (1–1.8%) at 2 months of age; in preterm babies it increases at 6–8 weeks of age.35 Neonatal reticulocytes, like mature neonatal red blood cells, have a larger volume and lower Hb than adult reticulocytes.35 Manual reticulocyte counts have now largely been replaced by automated reticulocyte counts based on cell size and ribonucleic acid (RNA) content. Automated reticulocyte counts also provide a measure of the fraction of reticulocytes with the highest RNA content (Immature Reticulocyte Fraction [IRF]), which has been used in neonates to determine whether or not there is increased erythropoietic activity, for example in response to EPO treatment or as a diagnostic aid to haemolysis.72–74 Normal ranges for the numbers of circulating nucleated red blood cells (NRBC) in neonates have been compiled by Christensen et al.66 and are generally higher in preterm neonates (2–3 × 10⁹/l) than in term neonates (about 1 × 10⁹/l) (see Table 1.2). Although modern analysers are increasingly able to generate accurate absolute NRBC counts, a useful guide from examination of blood films is that the presence of up to 5 NRBC/100 white blood cells in a term baby and up to 25 NRBC/100 white blood cells in a preterm baby can be considered normal for the first 1–2 days of life. In fact, there seems to be no difference between results obtained when the manual and automated methods are compared.75 The number of NRBC in the peripheral blood falls rapidly over the first week of life and these cells are no longer seen after the second week of life. By contrast, circulating erythroblasts are increased in a variety of conditions in neonates and their presence can therefore be useful diagnostically because they usually indicate increased erythropoiesis driven either by anaemia or by chronic intrauterine hypoxia, for example due to IUGR (Table 1.4 and Fig. 1.10). It should be noted that NRBC also appear in the peripheral blood as part of a leucoerythroblastic picture, most typically in response to acute perinatal hypoxia (Fig. 1.11).76,77 Even in freshly taken samples, the morphology of neonatal red blood cells is distinctly different to that of adult cells.35,78 The most typical morphological feature that differs from what is observed at other times of life is the presence of echinocytes (see Fig. 1.8). In healthy neonates, the proportion of echinocytes in blood films made from samples collected during the first week of life is inversely proportional to gestational age at birth. Echinocytes gradually disappear from the peripheral blood film over the first few weeks of life so that even very preterm neonates will have few circulating echinocytes by 4 weeks of age (Fig. 1.12). This, together with the universal presence of echinocytes in very preterm neonates, strongly suggests that the changes reflect the unique differences in the cell membrane and metabolism of fetal red blood cells. Indeed, echinocytes are not a useful indicator of red cell pathology in neonates. Instead, other morphological indicators of red cell pathology, such as spherocytes, elliptocytes, target cells and occasionally acanthocytes, are a more reliable diagnostic guide (see Chapter 2). Table 1.4 Causes of increased numbers of circulating nucleated red blood cells (erythroblasts) in term and preterm neonates
1
The full blood count and blood film in healthy term and preterm neonates
Introduction
Brief outline of the ontogeny of haemopoiesis
Properties of fetal haemopoietic stem and progenitor cells
Fetal haemopoietic stem cells
Fetal haemopoietic progenitor cells
Red blood cell production and development in the fetus and neonate
Haemoglobin production
Embryonic haemoglobins (globin chains)
Gower 1 (ζ2ε2)
Gower 2 (α2ε2)
Portland (ζ2γ2)
Fetal haemoglobin (globin chains)
Fetal haemoglobin (α2γ2)
Adult haemoglobins (globin chains)
Haemoglobin A (α2β2) lower
Haemoglobin A2 (α2δ2) considerably lower
Red cell membrane
Gives resistance to osmotic lysis
Altered expression of receptors (e.g. insulin)
Increased lipid content and altered phospholipid profile
More prone to oxidative damage
Altered glucose transport
Weak expression of A, B and I blood group antigens
Increased variation in red cell shape (poikilocytosis)
Red cell ‘pocks’ due to hyposplenism
Red cell metabolism
Glycolytic pathway
Increased glucose consumption
Altered enzyme levels, e.g. low 2,3‐DPG and PFK
Pentose phosphate pathway
Increased susceptibility to oxidant‐induced injury
Lower level of glutathione peroxidase
Reduced ability to generate NADPH
Erythropoietin production in the fetus and neonate
Haemoglobin synthesis and red blood cell production in the fetus and newborn
Red blood cell lifespan and the red blood cell membrane in the fetus and neonate
Red blood cell metabolism in the fetus and neonate
Iron metabolism in the fetus and neonate
Normal values for red blood cell parameters in the fetus and neonate
Haemoglobin concentration and red blood cell indices
Gestation at birth
Term (≥37 weeks)
30–36 weeks
26–29 weeks
<26 weeks
Erythropoiesis
Hb (g/l)
140–215
130–215
115–200
115–185
Hct (l/l)
0.43–0.65
0.40–0.42
0.30–0.58
0.30–0.57
MCV (fl)
98–115
100–117
103–130
104–133
MCH (pg)
32.5–39
33.5–40.5
33.5–43
34.5–44.5
NRBC
/100 WBC
≤5
≤25
≤25
≤25
×109/l
<1.0
1.0–2.0
2.0–3.0
2.0–3.0
Leucocytes (×10 9 /l)
Neutrophils
0–72 hours
3.0–28.0
1.0–25.0
1.0–25.0
1.0–25.0
72–240 hours
2.7–13.0
1.0–12.5
1.3–15.3
1.3–15.3
Monocytes
0.45–3.3
0.20–2.50
0.2–2.20
0.2–2.50
Eosinophils
0.12–1.20
0.06–1.10
0.03–0.90
0.01–0.80
Lymphocytes
3.0–11.0
3.0–11.0
2.5–11.0
3.0–12.0
Blast cells (%)
<5
<8
<8
<8
Platelet count (×10 9 /l)
140–450
140–450
140–450
140–450
Postnatal age
Birth
2 weeks
4 weeks
Gestation at birth 35–42 weeks
Hb (g/l)
140–215
110–180
100–170
Hct (l/l)
0.43–0.65
0.32–0.55
0.27–0.48
Gestation at birth 29–34 weeks
Hb (g/l)
130–215
100–170
80–135
Hct (l/l)
0.40–0.42
0.30–0.48
0.24–0.42
Reticulocytes and circulating nucleated red blood cells
Red blood cell morphology
Response to anaemia: haemolytic disorders
Haemolytic disease of the newborn (especially due to anti‐D and anti‐c)
α thalassaemia major (occasionally, haemoglobin H disease)
Severe congenital dyserythropoietic anaemia (e.g. due to KLF1 mutations)
Rare severe red cell enzyme deficiencies (e.g. pyruvate kinase deficiency or glucose phosphate isomerase deficiency)
Rare severe red cell membranopathies (e.g. hereditary stomatocytosis or autosomal recessive hereditary spherocytosis)
Response to anaemia: blood loss (mainly acute)
Fetomaternal haemorrhage
Placental abruption
Large cephalohaematoma
Haemorrhage into major organs, e.g. liver
Twin‐to‐twin transfusion (donor twin)
Response to hypoxia
Chronic in utero hypoxia:
Intrauterine growth restriction
Maternal hypertension
Maternal diabetes mellitus
Down syndrome (mechanism unclear)
Acute perinatal hypoxia:
Hypoxic ischaemic encephalopathy (leucoerythroblastic)
Neoplasms Related posts:
![]()
Stay updated, free articles. Join our Telegram channel

Full access? Get Clinical Tree

 Get Clinical Tree app for offline access