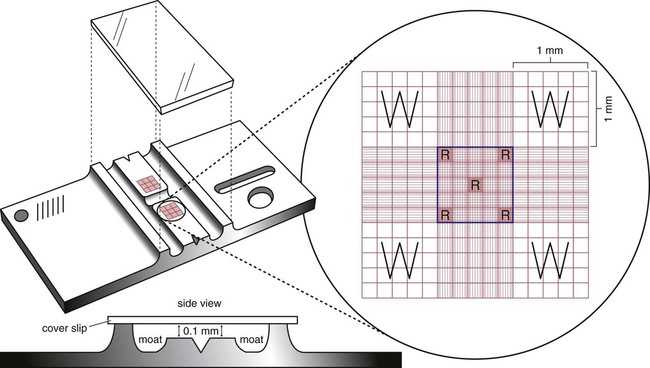
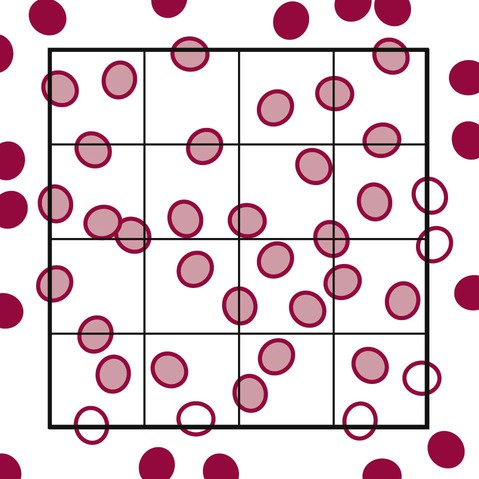
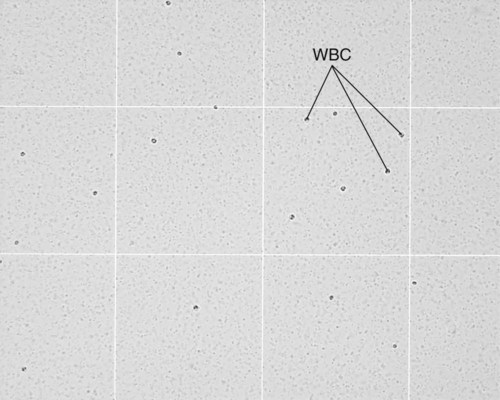
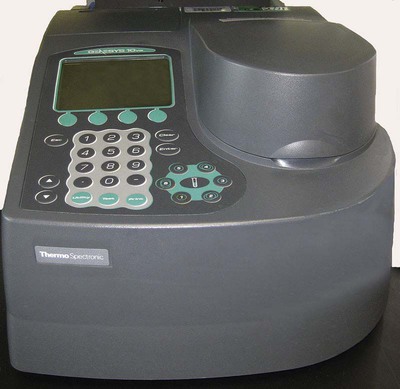
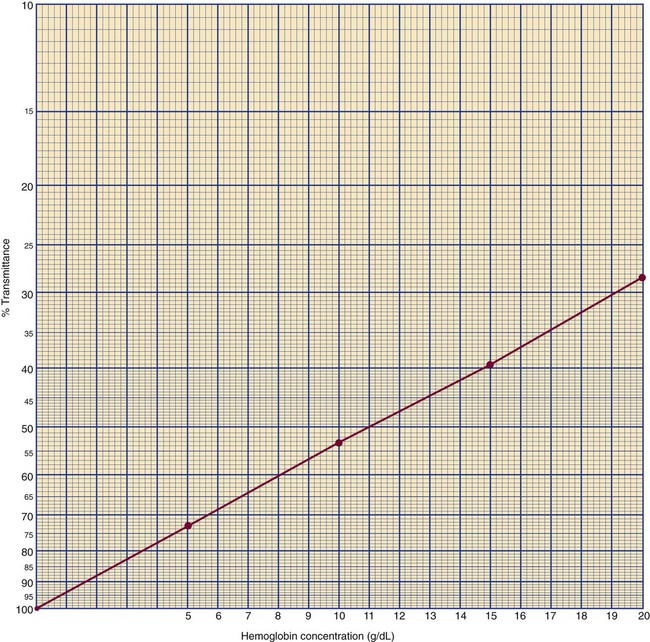
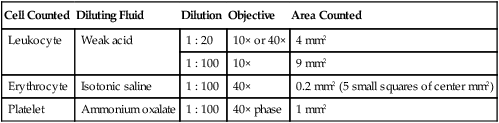
After completion of this chapter, the reader will be able to: 1. State the dimensions of the counting area of a Neubauer ruled hemacytometer. 2. Describe the performance of manual cell counts for leukocytes, erythrocytes, and platelets, including types of diluting fluids, typical dilutions, and typical areas counted in the hemacytometer. 3. Calculate dilutions for cell counts when given appropriate data. 4. Calculate hemacytometer cell counts when given numbers of cells, area counted, and dilution. 5. Describe the principle of cyanmethemoglobin assay for determination of hemoglobin. 6. Calculate the values for a standard curve for cyanmethemoglobin determination when given the appropriate data. Plot values and use the standard curve to determine hemoglobin values. 7. Describe the procedure for performing a microhematocrit. 8. Identify sources of error in routine manual procedures discussed in this chapter and recognize written scenarios describing such errors. 9. Calculate the rule of three and erythrocyte indices (mean cell volume, mean cell hemoglobin, and mean cell hemoglobin concentration) when given appropriate data. 10. Classify erythrocytes according to size and hemoglobin content, using results of red blood cell (RBC) indices. 11. Describe the principle and procedure for performing a manual reticulocyte count and the clinical value of the test. 12. Calculate the relative, absolute, and corrected reticulocyte values and a reticulocyte production index. 13. Interpret the results of reticulocyte calculations to evaluate the degree of bone marrow erythropoiesis. 14. Describe the procedure for performing Westergren erythrocyte sedimentation rates (ESRs). 15. State the diagnostic value of ESRs. 16. Correct white blood cell (WBC) counts for the presence of nucleated RBCs. 17. Describe the aspects of establishing a point-of-care testing program, including quality management and selection of instrumentation. 18. Discuss the advantages and disadvantages of point-of-care testing as they apply to hematology tests. 19. Describe the principles of common instruments used for point-of-care testing for hemoglobin level, hematocrit, WBC counts, and platelet counts. Although most routine cell-counting procedures in the hematology laboratory are automated, it may be necessary to use manual methods when counts exceed the linearity of an instrument, when an instrument is nonfunctional and there is no backup, in remote laboratories in Third World countries, or in a disaster situation when testing is done in the field. Although the discussion in this chapter concerns whole blood, body fluid cell counts are also often performed using manual methods. Chapter 17 discusses the specific diluents and dilutions used for body fluid cell counts. Chapter 39 discusses automated cell-counting instrumentation in detail. The heart of the manual cell count is the hemacytometer, or counting chamber. The most common one is the Levy chamber with improved Neubauer ruling. It is composed of two raised surfaces, each in the shape of a 3-mm × 3-mm square (total area 9 mm2) separated by an H-shaped moat. As shown in Figure 14-1, this large square is made up of nine 1-mm × 1-mm squares, and each of the white blood cell (WBC) squares is divided further into 16 squares with the center square subdivided into 25 smaller squares. Each of these smallest squares is 1. Clean the hemacytometer and coverslip with alcohol and dry thoroughly with a lint-free tissue. 2. Make a 1 : 20 dilution, placing 25 mcL of well-mixed blood into 475 mcL of weak acetic acid solution in a small test tube. 3. Cover the tube and mix by inversion. 4. Allow the dilution to sit for 10 minutes to ensure that the red blood cells (RBCs) have lysed. The solution will be clear once lysis has occurred. Leukocyte counts should be performed within 3 hours of dilution. 5. Mix again by inversion and fill a plain microhematocrit tube. 6. Charge both sides of the hemacytometer by holding the microhematocrit tube at a 45-degree angle and touching the tip to the coverslip edge where it meets the chamber floor. 7. After charging the counting chamber, place it in a moist chamber (Box 14-1) for 10 minutes before counting the cells to give them time to settle. Care should be taken not to disturb the coverslip. 8. While keeping the hemacytometer in a horizontal position, place it on the microscope stage. 9. Lower the condenser on the microscope and focus by using the low-power (10×) objective lens. The cells should be distributed evenly in all of the squares. 10. For a WBC 1 : 20 dilution, count all of the cells in the four corner squares, starting with the square in the upper left-hand corner (see Figure 14-1). Cells that touch the top and left lines should be counted; cells that touch the bottom and right lines should be ignored (Figure 14-2). See Figure 14-3 for the appearance of WBCs in the hemacytometer under the microscope. 11. Repeat the count on the other side of the counting chamber. The difference between totals for the two sides should be less than 10%. A greater variation could indicate an uneven distribution, which requires that the procedure be repeated. 12. Average the two sides. Using the average, calculate the WBC count using the first of the two equations given earlier. 1. The hemacytometer and coverslip should be cleaned properly before they are used. Dust and fingerprints may cause difficulty in distinguishing the cells. 2. The diluting fluid should be free of contaminants. 3. If the count is low, a greater area may be counted (e.g., 9 mm2) to improve accuracy. 4. The chamber must be charged properly to ensure an accurate count. Uneven flow of the diluted blood into the chamber results in an irregular distribution of cells. If the chamber is overfilled or underfilled, the chamber must be cleaned and recharged. 5. After the chamber is filled, allow the cells to settle for 10 minutes before counting. 6. Any nucleated erythrocytes (NRBCs) present in the sample are not lysed by the diluting fluid. The NRBCs are counted as WBCs because they are indistinguishable when seen on the hemacytometer. If five or more NRBCs per 100 WBCs are discovered on the differential, the WBC count must be corrected for these cells. This is accomplished by using the following formula: Report the result as the “corrected” WBC count. 7. The accuracy of the manual WBC count can be assessed by performing a WBC estimate on the peripheral blood smear (see Chapter 15). Boxes 14-2 and 14-3 show another method of WBC estimation. A phase-contrast microscope is used in the reference method for performing a manual platelet count. Platelets are adhesive to foreign objects and to each other, which makes it difficult to count them. They also are small and can be confused easily with dirt. In this procedure, whole blood, with EDTA as the anticoagulant, is diluted with 1% ammonium oxalate, which lyses the nonnucleated erythrocytes. The platelets can be counted with the use of a phase-contrast microscope as described by Brecher and Cronkite.1 1. Make a 1 : 100 dilution, placing 20 mcL of well-mixed blood into 1980 mcL of ammonium oxalate in a small test tube. 2. Mix the dilution thoroughly and charge the chamber. (Note: A special thin flat-bottomed counting chamber is used for phase platelet counts.) 3. Place the charged hemacytometer in a moist chamber (see Box 14-1) for 15 minutes to allow the platelets to settle. 4. Platelets are counted using the 40× objective lens. The platelets have a diameter of 2 to 4 µm and appear round or oval, displaying a light purple sheen when phase-contrast microscopy is used. The shape and color help distinguish the platelets from highly refractile dirt and debris. “Ghost” RBCs often are seen in the background. 5. Count the 25 small squares in the center square of the grid (see Figure 14-1). The area of this center square is 1 mm2. Each side of the hemacytometer should be counted, and the difference between the totals should be less than 10%. 6. Calculate the number of platelets per liter by using the first equation given earlier. For example, if 200 platelets were counted in the entire center square, 7. Platelet counts should be verified by performing an estimate on the Wright-stained peripheral blood smear (see Chapter 15). 1. Inadequate mixing and poor collection of the sample can cause the platelets to clump on the hemacytometer. If the problem persists after redilution, a new sample is needed. A finger-stick sample is less desirable because of the adhesive quality of the platelets. 2. Dirt in the pipette, hemacytometer, or diluting fluid may cause the counts to be inaccurate. 3. If fewer than 50 platelets are counted on each side, the procedure should be repeated by diluting the blood to 1 : 20 using calibrated pipettes. If more than 500 platelets are counted on each side, a 1 : 200 dilution should be made. The appropriate dilution factor should be used in calculating the results. 4. If the patient has a normal platelet count, the red cell area (see Figure 14-1) may be counted. Then, the area is 0.2 mm2 on each side. 5. The phenomenon of “platelet satellitosis” may occur when EDTA anticoagulant is used. This refers to the adherence of platelets around neutrophils, producing a ring or satellite effect (see Figure 15-1). Using sodium citrate as the anticoagulant should correct this problem. Because of the dilution in the citrate tubes, it is necessary to multiply the obtained platelet count by 1.1 for accuracy (see Chapter 15). Manual erythrocyte counts are rarely performed because of the inaccuracy of the count and questionable necessity. Use of other, more accurate manual RBC parameters, such as the microhematocrit and hemoglobin concentration, is desirable. Table 14-1 contains information on performing manual erythrocyte counts. TABLE 14-1 Manual Cell Counts with Most Common Dilutions, Counting Areas The primary function of hemoglobin within the erythrocyte is to carry oxygen to and carbon dioxide from the tissues. The cyanmethemoglobin (hemoglobincyanide) method for hemoglobin determination is the reference method approved by the Clinical and Laboratory Standards Institute.2 The absorbance of the cyanmethemoglobin at 540 nm is directly proportional to the hemoglobin concentration. Sulfhemoglobin is not converted to cyanmethemoglobin; it cannot be measured by this method. Sulfhemoglobin fractions of more than 0.05 g/dL are seldom encountered in clinical practice, however.3 1. Create a standard curve, using a commercially available cyanmethemoglobin standard. a. When a standard containing 80 mg/dL of hemoglobin is used, the following dilutions should be made: b. Transfer the dilutions to cuvettes. Set the wavelength on the spectrophotometer (Figure 14-4) to 540 nm and use the blank to set to 100% transmittance. c. Using semilogarithmic paper, plot percentage transmittance on the y-axis and the hemoglobin concentration on the x-axis. The hemoglobin concentrations of the control and patient samples can be read from this standard curve (Figure 14-5). d. A standard curve should be set up with each new lot of reagents. It also should be checked when alterations are made to the instrument (e.g., bulb change). 2. Controls should be run with each batch of specimens. Commercial controls are available. 3. Using the patient’s whole blood anticoagulated with EDTA or heparin or blood from a capillary puncture, make a 1 : 251 dilution by adding 0.02 mL (20 mcL) of blood to 5 mL of cyanmethemoglobin reagent. The pipette should be rinsed thoroughly with the reagent to ensure that no blood remains. Follow the same procedure for the control samples. 4. Cover and mix well by inversion or using a vortex mixer. Let stand for 10 minutes at room temperature to allow full conversion of hemoglobin to cyanmethemoglobin. 5. Transfer all of the solutions to cuvettes. Set the spectrophotometer to 100% transmittance at the wavelength of 540 nm, using cyanmethemoglobin reagent as a blank. 6. Using a matched cuvette, continue reading the patient samples and record the percentage transmittance. 7. Determine the hemoglobin values of the control samples and the patient samples from the standard curve. General reference ranges can be found on the inside cover of this text. 1. Cyanmethemoglobin reagent is sensitive to light. It should be stored in a brown bottle or in a dark place. 2. A high leukocyte count (greater than 20 × 109/L) or a high platelet count (greater than 700 × 109/L) can cause turbidity and a falsely high result. In this case, the solution can be centrifuged and the supernatant measured. 3. Lipemia also can interfere. A false result can be corrected by adding 0.01 mL of the patient’s plasma to 5 mL of the cyanmethemoglobin reagent and using this solution as the reagent blank.
Routine and Point-of-Care Testing in Hematology
Manual and Semiautomated Methods
Manual Cell Counts
Equipment
Hemacytometer
 or 0.04 mm2. A coverslip is placed on top of the counting surfaces. The distance between each counting surface and the coverslip is 0.1 mm; the total volume is 0.9 mm3. Hemacytometers and coverslips must meet the specifications of the National Bureau of Standards, as indicated by the initials “NBS” on the chamber. When the dimensions of the hemacytometer are thoroughly understood, the area counted can be changed to facilitate the counting of specimens with extremely low or high counts.
Procedure
Sources of Error and Comments
Platelet Count
Procedure
Sources of Error and Comments
Erythrocyte Counts
Cell Counted
Diluting Fluid
Dilution
Objective
Area Counted
Leukocyte
Weak acid
1 : 20
10× or 40×
4 mm2
1 : 100
10×
9 mm2
Erythrocyte
Isotonic saline
1 : 100
40×
0.2 mm2 (5 small squares of center mm2)
Platelet
Ammonium oxalate
1 : 100
40× phase
1 mm2
Hemoglobin Determination
Principle
Procedure
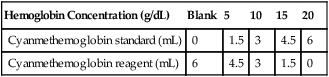
Hemoglobin Reagent
Hemoglobin Concentration (g/dL)
Blank
5
10
15
20
Cyanmethemoglobin standard (mL)
0
1.5
3
4.5
6
Cyanmethemoglobin reagent (mL)
6
4.5
3
1.5
0
Sources of Error and Comments
Related posts:
![]()
Stay updated, free articles. Join our Telegram channel

Full access? Get Clinical Tree


Routine and Point-of-Care Testing in Hematology: Manual and Semiautomated Methods