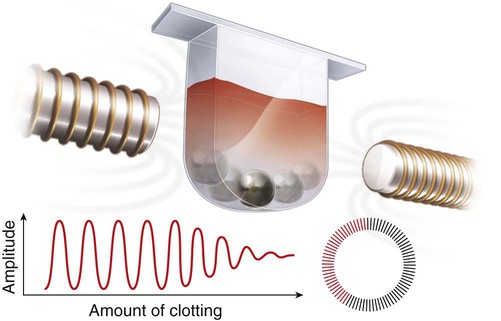
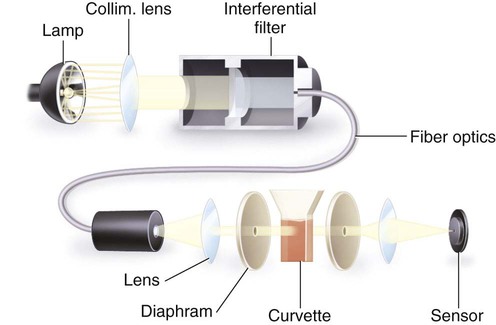
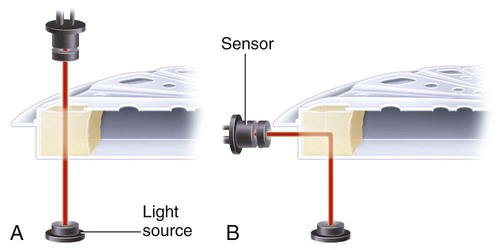
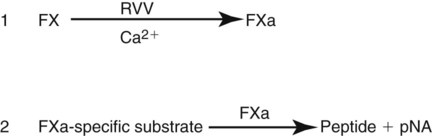
After completion of this chapter, the reader will be able to: 1. Describe testing methodologies previously considered as specialized that are now routinely available on coagulation analyzers. 2. Identify testing applications for various coagulation analyzers. 3. Explain the methods of clot detection used by each type of coagulation analyzer presented. 4. List common instrument flags that alert operators to specimen and instrument problems. 5. Describe the advantages and disadvantages of each method of clot detection. 6. Distinguish the characteristics of manual, semiautomated, and automated coagulation analyzers. 7. Identify key performance characteristics that should be evaluated when selecting the most appropriate coagulation analyzer for an individual laboratory setting. 8. Explain the purpose of incorporating platelet function testing analyzers into the routine coagulation laboratory. 9. Develop a model plan of action for objective evaluation of coagulation analyzers for purchase. 10. Explain the main purpose of point-of-care coagulation testing. 1. Should the operator report the test results as shown? 2. What action should the operator take to address the lipemia flagging of this specimen? 3. Would you expect this patient to be at risk for bleeding based on these test results? The coagulation laboratory is an ever-changing environment populated by automated analyzers that offer advances in both volume and variety of tests.1 Hardware and software innovations provide for random access testing with multitest profiles. In the past, the routine coagulation test menu consisted of prothrombin time (PT) with the international normalized ratio (INR), partial thromboplastin time (PTT, activated partial thromboplastin time), fibrinogen, thrombin time, and D-dimer assays. More specialized testing was performed in tertiary care institutions or reference laboratories employing medical laboratory scientists with specialized training. With the introduction of new instrumentation and test methodologies, coagulation testing capabilities have expanded significantly, so that many formerly “specialized” tests can be performed easily by general medical laboratory staff. New instrumentation has made coagulation testing more standardized, consistent, and cost effective. Automation has not advanced, however, to the point of making coagulation testing foolproof or an exact science. Operators must develop expertise in correlating critical test results with the patient’s diagnosis or condition when monitoring antithrombotic therapy. Good method validation of procedures, cognitive ability, and theoretical understanding of the hemostatic mechanism are still required to ensure the accuracy and validity of test results so that the physician can make an informed decision about patient care. Except for point-of-care testing and platelet aggregometry, citrated plasma (usually platelet-poor plasma, plasma with a platelet count of less than 10,000/mcL) has now replaced whole blood in coagulation instruments, although the principle of interval to clot formation lives on.1,2 Plasma coagulation testing traces its roots to Gram, who in 1920 added calcium chloride to anticoagulated plasma at 37° C. He measured the increasing viscosity of the blood during fibrin monomer polymerization, a principle used today in thromboelastography (TEG) and sonar clot detection, laying the groundwork for the most commonly ordered coagulation tests in current use, the PT and PTT.3 Subsequent twentieth-century developments include manual loops, electromechanical clot detection using a movable lead (BBL Fibrometer) or rolling steel ball (Diagnostica Stago ST-4), and photo-optical clot detection (Coag-A-Mate, originally manufactured by General Diagnostics, Chapel Hill, N.C.). Nephelometers, first developed in 1920, measure 90-degree light dispersion in a colloidal suspension. As plasma clots, a change in light scatter can be measured over time, and this principle is in common use today. Current coagulation instruments apply many of the clot detection principles of these early analytical systems. They either observe for the clot formation (optical, nephelometric devices) or they detect the clot by “feel” (mechanical, viscosity-based devices). Although the principles remain the same, the instruments have been enhanced to eliminate variations in pipetting and end-point detection. They also allow multiple analyses to be performed simultaneously on a single specimen.4 Fully automated analyzers provide pipetting systems that automatically transfer reagents and test plasma to reaction vessels and measure the end point without operator intervention (Table 47-1). Multiple specimens can be tested simultaneously. Automated coagulometers are expensive, and laboratory staff require specialized training to operate and maintain them. Regardless of technology, all semiautomated and automated analyzers offer better coagulation testing accuracy and precision than visual methods. TABLE 47-1 Levels of Coagulation Automation Instrument methodologies are classified into five groups based on the end-point detection principle: Historically, coagulation instruments were limited to a single type of end-point detection system each, mechanical or photo-optical. Photo-optical instruments operated at a fixed wavelength between 500 nm and 600 nm and could be used only for clot detection. Later instruments could also read at 405 nm to perform chromogenic assays. Although this change made it possible to automate advanced coagulation protocols, it required laboratories to purchase and train staff on multiple analyzers if they wanted to offer the wider range of coagulation testing capabilities. Since 1990, instrument manufacturers have successfully incorporated multiple detection methods into single analyzers, which allows a laboratory to purchase and train on only one instrument while still providing specialized testing capabilities implemented by multiple operators.4 Another mechanical clot detection method employs a magnetic sensor that monitors the movement of a steel ball within the test plasma. Two moving ball principles are used. In the first, an electromagnetic field detects the oscillation of a steel ball within the plasma-reagent solution. As fibrin strands form, the viscosity starts to increase, slowing the movement (Figure 47-1). When the oscillation decreases to a predefined rate, the timer stops, indicating the clotting time of the plasma. This methodology is found on all Diagnostica Stago analyzers. Photo-optical (turbidometric) coagulometers detect a change in plasma optical density (OD, transmittance) during clotting. Light of a specified wavelength passes through plasma, and its intensity (OD) is recorded by a photodetector. The OD depends on the color and clarity of the sample and is established as the baseline. Formation of fibrin strands causes light to scatter, allowing less to fall on the photodetector and thus generating an increase in OD. When the OD rises to a predetermined variance from baseline, the timer stops, indicating clot formation. Because the baseline OD is subtracted from final OD, effects of lipemia and icterus are minimized. Many optical systems employ multiple wavelengths that discriminate and filter out the effects of icterus and lipemia. Many automated and semiautomated coagulation instruments developed since 1970 use photo-optical clot detection (Figure 47-2). Nephelometry is a modification of photo-optical end-point detection in which 90-degree or forward-angle scatter, rather than OD, is measured. A light-emitting diode produces incident light at approximately 600 nm and a photodetector detects variations in light scatter at 90 degrees (side scatter) and at near 180 degrees (forward-angle scatter). As fibrin polymers form, side scatter and forward-angle scatter rise (Figure 47-3).4,5 The timer stops when scatter reaches a predetermined intensity, and the interval is recorded. Nephelometry was first applied to immunoassay. As antigen-antibody complexes (immune complexes) precipitate, the resulting turbidity scatters incident light.6 In reactions in which the immune complexes are known to be too small for detection, the antibodies are first attached to microlatex particles. In coagulation, coagulation factor immunoassays employ specific factor antibodies bound to latex particles. Nephelometry provides a quantitative, but not functional, assay of coagulation factors. Nephelometry is often employed in complex automated coagulometers because it allows both clot-based assay and immunoassay. Nephelometry-style analyzers can be used to produce high-volume multiple-assay coagulation profiles. Chromogenic (synthetic, amidolytic) methodology employs a colorless synthetic oligopeptide substrate conjugated to a chromophore, usually para-nitroaniline (pNA). Chromogenic analysis is a means for measuring specific coagulation factor activity, because it exploits the factors’ enzymatic (protease) properties. The oligopeptide is a series of amino acids whose sequence matches the natural substrate of the protease being measured.7 Protease cleaves the chromogenic substrate at the site binding the oligopeptide to the pNA, freeing the pNA. Free pNA is yellow; the OD of the solution is proportional to protease activity and is measured by a photodetector at 405 nm. In some instances a fluorescent conjugate is used; this method is called fluorogenic. • Direct chromogenic measurement: OD is proportional to the activity of the substance being measured, for instance, coagulation control protein C activity. • Indirect chromogenic measurement: The protein or analyte being measured inhibits a reagent enzyme that has activity directed toward the synthetic substrate. The change in OD is inversely proportional to the concentration or activity of the substance being measured; for example, heparin in the anti–factor Xa assay. The principle used in instruments marketed by the DiaPharma Group, Inc. (West Chester, Ohio) to perform chromogenic factor X assay is shown in Figure 47-4. Immunologic assays are the newest assays available in coagulation laboratories and are based on antigen-antibody reactions similar to those used in nephelometry as described previously. Latex microparticles are coated with antibodies directed against the selected analyte (antigen). Monochromatic light passes through the suspension of latex microparticles. When the wavelength is greater than the diameter of the particles, only a small amount of light is absorbed.8 When the coated latex microparticles come into contact with their antigen, however, the antigen attaches to the antibody and forms “bridges,” which causes the particles to agglutinate. As the diameter of the agglutinates increases to the wavelength of the monochromatic light beam, light is absorbed. The increase in light absorbance is proportional to the size of the agglutinates, which in turn is proportional to the antigen level. The introduction of new coagulation methodologies has improved testing capabilities in the coagulation laboratory. Refinement of these methodologies has allowed the use of synthetic substrates and measurements of single proenzymes, enzymes, and monoclonal antibodies, which increases the ability to recognize the causes of disorders of hemostasis and thrombosis.8
Coagulation Instrumentation*
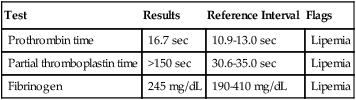
Case Study
Test
Results
Reference Interval
Flags
Prothrombin time
16.7 sec
10.9-13.0 sec
Lipemia
Partial thromboplastin time
>150 sec
30.6-35.0 sec
Lipemia
Fibrinogen
245 mg/dL
190-410 mg/dL
Lipemia
Historical Perspective
Clot End-Point Detection Principles
Level
Description
Examples
Manual
All reagents and specimens are transferred manually by the operator. Temperature is maintained by a water bath or heat block; external measurement by operator may be required. End point is determined visually by the operator. Timer is initiated and stopped by the operator.
Tilt tube
Wire loop
Semiautomated
All reagents and specimens are transferred manually by the operator. Instrument usually contains a device for maintaining constant 37° C temperature. Analyzer may internally monitor temperature. Instrument has mechanism to initiate timing device automatically on addition of final reagent and mechanism for detecting clot formation and stopping the timer.
Fibrometer
STart 4
Cascade M-4
Cascade-M
BFT-II
KC1
KC4
Automated
All reagents are automatically pipetted by the instrument. Specimens may or may not be automatically pipetted. Analyzer contains monitoring devices and internal mechanism to maintain and monitor constant 37° C temperature throughout testing sequence. Timers are initiated and clot formation is detected automatically.
CoaLab
STA-R Evolution
STA Compact and Compact CT
Sysmex CA-CA-530, CA-560, CA-1500, CA-7000
BCS XP
Electromechanical End-Point Detection
Photo-optical End-Point Detection
Nephelometric End-Point Detection
Chromogenic End-Point Detection
Immunologic Light Absorbance End-Point Detection
Oncohema Key
Fastest Oncology & Hematology Insight Engine