Abstract
We review the evidence that proliferative breast disease increases the risk of breast cancer. Results from six cohorts give consistent estimates of these risks. The combined estimate of the relative risk associated with proliferative disease without atypia is 1.65 with a 95% confidence interval (CI) of 1.5 to 1.9. The relative risk of breast cancer associated with atypical hyperplasia is 4.19 (95% CI 3.7–4.7). Estimates of the cumulative absolute risk of invasive breast cancer in the Nashville Breast Cohort and the Mayo Clinic Cohort are also given. These risks are remarkably consistent and average about 25% in the 25 years after a diagnosis of atypical hyperplasia. The chapter also reviews the evidence on how age, a family history of breast cancer, and proliferative breast disease interact to affect breast cancer risk. The risks associated with fibroadenoma and radial scar are also reviewed, as are the effects of time since diagnosis and the risk of hormone replacement therapy in women with a history of proliferative disease.
Keywords
breast pathology, breast neoplasms pathology/prevention and control, risk assessment, atypical hyperplasia, proliferative disease without atypia
The histology of benign breast biopsies is highly variable, and biopsied tissue may range from physiologically normal at one extreme to in situ carcinoma at the other. It thus made sense to subdivide these lesions into biologically meaningful categories and to attempt to determine the cancer risk associated with these different categories. This task has proved to be difficult because the studies must be large, and numerous classification schemes have been proposed to address this question. Many of the authors of these schemes have performed concurrent studies in which the malignant potential of benign lesions was judged by the frequency of their association with breast carcinoma in the same biopsy. The problem with such studies is that it is impossible to infer whether the implicated benign lesions are true precursor lesions for cancer, markers of risk elevation, or themselves a consequence of the malignancy. Thus to prove that a benign lesion increases a woman’s risk of breast cancer, it is necessary to establish a temporal relationship between the occurrence of the benign lesion and the later development of breast cancer. Several investigators have performed such studies, most notably investigators from the Mayo Clinic, the Harvard Medical School, the Henry Ford Health System, the Albert Einstein College of Medicine (studying women from Toronto, Canada; Portland, Oregon, United States; and London, United Kingdom), Vanderbilt University (studying the Nashville Breast Cohort), and the Breast Cancer Detection Demonstration Project. All these studies used Page’s histologic classification scheme for breast disease.
The other major challenge with studies of premalignant breast disease is establishing reproducible and biologically meaningful diagnoses. The Nashville Breast Cohort investigators approached this problem with extensive pretesting and devised a preliminary classification scheme that could distinguish between fine differences in breast morphology and cytology and yet be reproducible. This classification scheme was first evaluated in 1978. After revision, it was then applied to more than 10,000 benign breast biopsies, and follow-up was obtained from a suitable sample of the biopsied women. Relative risk estimates associated with the different benign lesions were derived and compared. Our published benign disease categories represent groupings of lesions that are associated with consistent and clinically meaningful levels of cancer risk. These categories and the cancer risks associated with them have been endorsed by the College of American Pathologists. The results of our studies are discussed in the next two sections. The relationship between our results and those of other investigators is described subsequently.
Nashville Breast Cohort Studies
At Vanderbilt, we initially evaluated 10,366 consecutive benign breast biopsies performed between 1950 and 1968 at three hospitals in Nashville, Tennessee. These analyses indicated that 70% of women who undergo biopsy revealing benign breast tissue are not at increased risk for breast cancer. The remaining 30% of the 10,000 evaluated biopsies contained proliferative lesions. These lesions are characterized by at least moderate epithelial hyperplasia and are associated with an approximately twofold increase in risk of breast cancer. The lesions within this disease category include, most prominently, hyperplasia of usual type (ductal) of moderate and florid degree, as well as sclerosing adenosis and papillomas. Mild hyperplasia of usual type is excluded from the proliferative disease category because it is not associated with increased risk of cancer and thus is not considered a disease. Clinical correlates of proliferative disease are unproven except for dense mammographic patterns that are positively correlated with the presence of proliferative disease.
The proliferative lesions can be further dichotomized into those with and without atypia. The former (atypical hyperplasia [AH]) are characterized by meeting some but not all the criteria needed for a diagnosis of carcinoma in situ. These lesions had a prevalence of 4% in the premammographic era and today are diagnosed in approximately 10% of mammographically detected benign lesions. They are associated with a fourfold to fivefold increase in breast cancer risk. There are two morphologically distinct subtypes of AH: atypical lobular hyperplasia (ALH) and atypical ductal hyperplasia (ADH) (see Chapter 8 ). However, women with these lesions have roughly comparable breast cancer risks. Minor differences include a shorter average period between biopsy and invasive carcinoma diagnosis for ADH (8 years) than for ALH (12 years). There are also differences in the age distribution, with both types predominating in the perimenopausal period but with ALH even less common in younger and older women. Proliferative disease without atypia (PDWA) was associated with a 60% increase in risk of breast cancer (1.6 times) compared with women from the Third National Cancer Survey and was associated with a 90% increase (1.9 times) compared with women without such changes from our study. The Nashville Breast Cohort currently contains 12,693 women, 708 of whom have developed invasive breast cancer over a median of 20 years of follow-up. Follow-up is available on 430 women with AH and 3941 women with PDWA. Our estimates of the relative risk of invasive breast cancer in this cohort associated with PDWA and AH are 1.58 (95% confidence interval [CI] 1.3–1.9) and 3.56 (95% CI 2.8–4.6), respectively.
Mayo Clinic Studies
The results of the Nashville Breast Cohort have been replicated by several authors, most notably by our studies at the Mayo Clinic. The Mayo Clinic Cohort consists of 13,485 women who were diagnosed with benign breast disease and who were followed for a median of 15.8 years. Of these women, 4311 and 711 had PDWA or AH, respectively, diagnosed from their entry biopsy. On follow-up, 1273 breast cancers have developed. The relative risks for PDWA was 1.94 (95% CI 1.78–2.12), whereas that for AH was 4.18 (95% CI 3.53–4.90). These findings are remarkably consistent with those of the Nashville Breast Cohort. The Mayo studies also found that the diagnoses of ADH and ALH were associated with similar levels of breast cancer risk. In the Mayo cohort, the relative risk of breast cancer was 3.93 (95% CI 3.0–5.1) in women with ALH and was 4.76 (95% CI 3.7–6.0) in women with ADH.
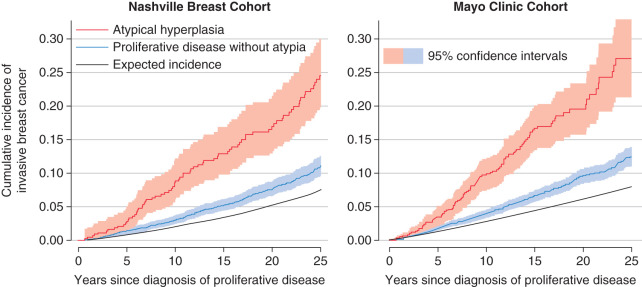
Fig. 20.1 shows the cumulative incidence of invasive breast cancer in women from the Nashville or Mayo breast cohorts whose entry biopsies contained AH or PDWA. For reference, the black curves in this figure show the cumulative incidence of invasive breast cancer for women from the Surveillance, Epidemiology and End Results (SEER) data. These curves estimate breast cancer incidence in women from the general population whose age and year of biopsy was similar to that of study subjects. The Atlanta and Iowa SEER registries were used for the Nashville and Mayo cohorts, respectively. Ninety-five percent confidence bands on these curves show a marked and significant difference between the cancer risks associated with AH and PDWA. The increase in cumulative breast cancer incidence is approximately linear over the first 25 years following the patient’s initial diagnosis.
Other Studies
Page’s histologic classification scheme has been evaluated in four other studies in addition to those of Nashville and Mayo Clinic patients. Dupont and colleagues studied women who underwent benign biopsy as part of the Breast Cancer Detection Demonstration Project. Page was not consulted during the pathology review of this study, although he did review his classification scheme with the study pathologists before their reading any of the slides. Collins and colleagues studied women from Harvard’s Nurse’s Health Study, and Kabat and colleagues studied the combined risk among cohorts of women from three cities, as noted earlier: Toronto, Canada; Portland, Oregon; and London, United Kingdom. Worsham and colleagues studied women from an ethnically diverse cohort of women from Detroit, Michigan. Figs. 20.2 and 20.3 show the relative risks of breast cancer for women with PDWA and AH, respectively. The area of the gray boxes surrounding the relative risk estimates in these figures is proportional to the information content of these studies (larger boxes imply greater precision in the risk estimates). The horizontal black lines give 95% CIs. These studies have overlapping confidence intervals within each diagnostic category and are consistent. The combined relative risk for breast cancer associated with AH is 4.19 (95% CI 3.71–4.74), whereas the relative risk associated with PDWA is 1.65 (95% CI 1.46–1.86). The fact that six groups of pathologists have found similar levels of breast cancer risk associated with these lesions supports the reproducibility and credibility of these findings.
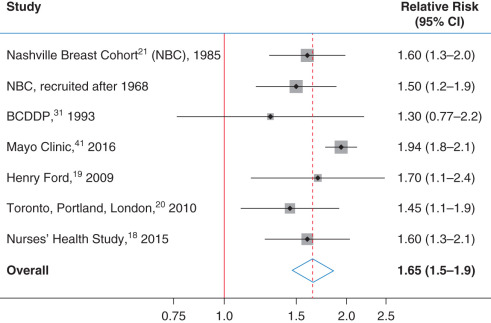
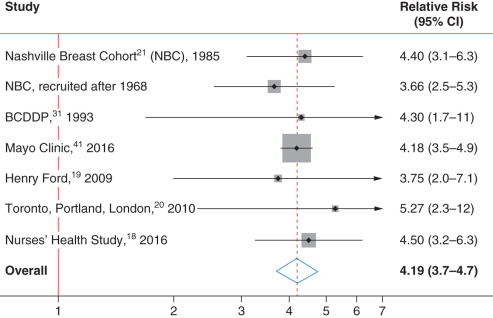
Before the distinction of PDWA and AH as distinct histologic categories, all patients in our study cohorts would have been diagnosed as having fibrocystic disease. It is clear from Figs. 20.1, 20.2, and 20.3 that this term has little prognostic value and should be replaced by more precise terminology.
Marshall and colleagues have also studied the difference in risk of breast cancer between women with ALH and ADH in the Harvard-based Nurses’ Health Study. The estimate of the relative risk of breast cancer in women with ALH was 5.3 (95% CI 2.7–10.4), whereas for women with ADH this risk was 2.4 (95% CI 1.3–4.5). Although the estimated risk was higher for women with ALH than with ADH, the CIs are wide, and these estimates are not significantly different. The researchers also observed a higher estimated relative risk for premenopausal women with ALH than for postmenopausal women with ALH. Overall, the Nashville, Mayo Clinic, and Harvard cohorts provide consistent estimates of the breast cancer risks associated with AH and its subtypes. On the basis of data available through 1998, the College of American Pathologists Consensus Conference stated that women with PDWA had a slight elevation in risk ranging from 1.5 to 2 times that of the general population; women with AH had a moderately increased relative risk ranging from 4.0 to 5.0.
Extent of Atypical Hyperplasia
Table 20.1 is adapted from Hartmann and colleagues and Collins and colleagues and shows the effect of extent of atypia on breast cancer risk. In reading this and subsequent tables, it is important to bear in mind that the estimated relative risks may differ from their true values because of chance by the amount indicated in the 95% CIs. Hartmann and coworkers have found that the risk of breast cancer in women with AH increases as the number of foci of atypia increases. Women with only one focus had a risk of breast cancer that was 3.19 (95% CI 2.46–4.07) times that of the general population. This relative risk increased to 5.53 (95% CI 3.95–7.53) and 7.61 (95% CI 5.36–10.5) in women with two foci or three or more foci, respectively. Collins and colleagues found a similar trend that was not statistically significant. This lack of significance may have been due to insufficient power. Degnim and colleagues have published a joint paper by the Mayo Clinic and Vanderbilt groups that combines the data from both cohorts to address this question.
| Study | Patient Group | No. of Women | No. Cancers a | Relative Risk | 95% Confidence Interval | p for Trend |
|---|---|---|---|---|---|---|
| Mayo Clinic | ||||||
| SEER women from Iowa | 1 (reference) | <.001 | ||||
| Foci of atypical hyperplasia | ||||||
| 1 | 410 | 65 | 3.19 | (2.5−4.1) | ||
| 2 | 161 | 40 | 5.53 | (4.0−7.5) | ||
| ≥3 | 133 | 37 | 7.61 | (5.4−10) | ||
| Nurses’ Health Study | ||||||
| Nonproliferative lesions | 1 (reference) | .22 | ||||
| Foci of atypical hyperplasia | ||||||
| 1 | 37 | 66 | 3.8 | (2.4−6.1) | ||
| 2 | 26 | 42 | 4.5 | (2.6−7.7) | ||
| ≥3 | 56 | 74 | 5.3 | (3.5−8.1) | ||
Age, Family History, and Proliferative Disease
Table 20.2 is adapted from Dupont and Page. The p values given in these tables are with respect to the null hypothesis that the true relative risk equals 1. The table shows the effect of family history, calcification, and age on the risk of breast cancer in women with and without proliferative disease. The interaction between proliferative disease and age at biopsy is particularly interesting. Women with proliferative disease have approximately twice the risk of breast cancer compared with women of similar age from the general population regardless of whether they are in the premenopausal, perimenopausal, or postmenopausal age group. In contrast, the relative risk of breast cancer falls with increasing age in patients lacking proliferative disease, with postmenopausal patients having about one-third the risk of postmenopausal women in general. This result suggests that women undergoing age-related involution whose breasts lack any hyperplastic activity may be at reduced risk of developing breast cancer. Radisky and colleagues found that breast cancer risk diminished with increasing involution in the entry biopsy of study subjects. Women whose terminal ductal lobular units (TDLUs) were 26% to 50% and 51% to 75% involuted had breast cancer relative risks of 0.50 (95% CI 0.33−0.76) and 0.16 (95% CI 0.10−0.26), respectively, compared with women whose TDLUs were 0% to 25% involuted.
| No. of Women | No. of Cancers | Relative Risk a | 95% Confidence Interval | p | |
|---|---|---|---|---|---|
| All women | 3303 | 134 | 1.5 | 1.3–1.8 | <.0001 |
| Proliferative disease | 1925 | 103 | 1.9 | 1.6–2.3 | <.0001 |
| No proliferative disease | 1378 | 31 | 0.89 | 0.62–1.3 | .51 |
| Family history b | 369 | 26 | 2.5 | 1.7–3.7 | <.0001 |
| No family history | 2934 | 108 | 1.4 | 1.2–1.7 | .0007 |
| Proliferative disease and | |||||
| Family history | 234 | 22 | 3.2 | 2.1–4.9 | <.0001 |
| No family history | 1691 | 81 | 1.7 | 1.4–2.2 | <.0001 |
| Calcification | 359 | 23 | 2.4 | 1.6–3.6 | <.0001 |
| No calcification | 1566 | 80 | 1.8 | 1.5–2.3 | <.0001 |
| Age c 20–45 | 1205 | 57 | 1.9 | 1.5–2.5 | <.0001 |
| Age 46–55 | 563 | 35 | 1.9 | 1.3–2.6 | .0002 |
| Age >55 | 157 | 11 | 2.2 | 1.2–4 | .007 |
| No proliferative disease and | |||||
| Family history | 135 | 4 | 1.2 | 0.43–3.1 | .78 |
| No family history | 1243 | 27 | 0.86 | 0.59–1.3 | .43 |
| Calcification | 174 | 4 | 0.80 | 0.30–2.1 | .66 |
| No calcification | 1204 | 27 | 0.90 | 0.62–1.3 | .59 |
| Age 20–45 | 1025 | 23 | 0.99 | 0.66–1.5 | .96 |
| Age 46–55 | 247 | 7 | 0.83 | 0.40–1.8 | .63 |
| Age >55 | 106 | 1 | 0.30 | 0.04–2.2 | .21 |
| Family history and | |||||
| Cysts | 246 | 21 | 3 | 1.9–4.5 | <.0001 |
| No cysts | 123 | 5 | 1.6 | 0.65–3.7 | .32 |
| No family history and | |||||
| Cysts | 1808 | 73 | 1.5 | 1.2–1.9 | .0008 |
| No cysts | 1126 | 35 | 1.2 | 0.88–1.7 | .23 |
Stay updated, free articles. Join our Telegram channel

Full access? Get Clinical Tree


