Relationship between Metabolic Control and Long-Term Complications of Diabetes
David M. Nathan
For what a man had rather were true, he more readily believes.
—Roger Bacon, 1450
The relationship between metabolic control and development of long-term complications of diabetes mellitus was one of the most contentious issues in medicine (1,2,3,4,5). Whether intensive forms of diabetes therapy, which have as their goal the achievement of near-normal glycemia, would prevent the development and/or ameliorate the progression of diabetes-associated complications (the only testable question in humans) was answered only in the previous decade. This chapter reviews the history of the debate and the human studies that shed light on this relationship. The important clinical trials that finally resolved the debate, including the Diabetes Control and Complications Trial and the United Kingdom Prospective Diabetes Study, are reviewed in detail (6,7).
HISTORY
Although the recognition of diabetes mellitus itself has a venerable history (8), the recognition and description of diabetic complications is relatively new. The first description of retinopathy in diabetes was recorded only 100 years ago (9), and both the occurrence and character of retinal lesions in relation to diabetes were the subject of active debate as recently as 60 years ago (10). The classic lesions of diabetic glomerulosclerosis were described less than 70 years ago (11).
The major reason for the previous lack of clinical appreciation of diabetic complications is related to their dependence on duration of diabetes, the most potent known risk factor for complications (12,13,14,15,16,17,18). In the preinsulin era, the limited life span of patients after they developed type 1 diabetes precluded the development of long-term complications. Eight years after the introduction of insulin, diabetic children were described as having “invulnerable” eyes and a future of “limitless hope” (19). Twenty years after insulin became available, however, the results of long-term survival with insulin therapy were noted to include retinopathy, nephropathy, and peripheral and cardiovascular disease (20,21,22). In a prescient set of observations made more than 50 years ago, Dolger noted that duration of diabetes appeared to be more important than age at onset or type of therapy; that all patients whose diabetes was of sufficient duration developed retinal lesions; that approximately 50% developed proteinuria; and that complications developed in patients whose long-term metabolic control was judged to be good as well as in those whose metabolic control was poor (22). On the other hand, retrospective studies suggested that children with “adequately” controlled diabetes were not vulnerable to growth retardation, cataracts, or retinal hemorrhages (23). Thus, the debate regarding the effects of metabolic control on long-term complications was born.
The history of type 2 diabetes and long-term complications is even murkier. Until the recent extension of the human life span and accompanying increase in the prevalence of obesity led to a dramatic increase in the prevalence of type 2 diabetes (24), type 2 diabetes was a relatively rare disease. Moreover, elderly patients with type 2 diabetes rarely survived the 10 to 20 years after onset of diabetes that are necessary for the development of clinically significant complications. Major advances in general medical care, and especially in cardiac care, now have allowed older patients with type 2 diabetes to live longer. This
increased life expectancy has unmasked the risks of long-term complications in type 2 diabetes, much as insulin therapy did for type 1 diabetes. Type 2 diabetes is now widely recognized as a cause of duration-dependent complications similar to those in type 1 diabetes (14,16,25,26,27). Although the frequency of retinopathy and nephropathy is relatively lower in type 2 than in type 1 diabetes, the 10-fold-greater prevalence of type 2 diabetes makes it the major contributor to vision loss and renal failure secondary to diabetes in the United States (26,28). The association of type 2 diabetes and elevated levels of blood glucose with microvascular complications has been recognized implicitly in the definition of blood glucose criteria for the diagnosis of type 2 diabetes, which are predicated on those glucose levels that are accompanied by microvascular complications (29).
increased life expectancy has unmasked the risks of long-term complications in type 2 diabetes, much as insulin therapy did for type 1 diabetes. Type 2 diabetes is now widely recognized as a cause of duration-dependent complications similar to those in type 1 diabetes (14,16,25,26,27). Although the frequency of retinopathy and nephropathy is relatively lower in type 2 than in type 1 diabetes, the 10-fold-greater prevalence of type 2 diabetes makes it the major contributor to vision loss and renal failure secondary to diabetes in the United States (26,28). The association of type 2 diabetes and elevated levels of blood glucose with microvascular complications has been recognized implicitly in the definition of blood glucose criteria for the diagnosis of type 2 diabetes, which are predicated on those glucose levels that are accompanied by microvascular complications (29).
MAJOR ISSUES
Several major questions should be framed before a critical examination of the data are undertaken. The occurrence of retinopathy, nephropathy, and neuropathy as long-term, diabetes-specific complications of all types of diabetes is clear. As noted previously, the diagnostic criteria for type 2 diabetes include glucose levels selected specifically because of the risk they impart for development of long-term complications, specifically retinopathy. (The profound hyperglycemia and absolute requirement for insulin in type 1 diabetes make diagnostic glucose criteria generally unnecessary.) Persons whose glucose levels are elevated but who are not vulnerable to diabetes-specific complications are not considered diabetic but are described nosologically as having impaired glucose tolerance or impaired fasting glucose (“pre-diabetes”) (29). Thus, the association of hyperglycemia with certain long-term complications is incorporated into the clinical definition of diabetes, and a glucose threshold for the development of specific complications is implicit in the accepted definition of type 2 diabetes.
The glucose hypothesis, that is, that the long-term complications of diabetes are a consequence of hyperglycemia, is a natural, albeit potentially fallacious, outgrowth of these observations. Although diabetes of diverse etiologies is defined as being related to both hyperglycemia and long-term complications, the conclusion that one leads to the other, although attractive, is not necessarily true. A primary question, therefore, is what relationship exists between the level of hyperglycemia and the occurrence or development of complications.
Even if the relationship between different levels of hyperglycemia and complications is established and delineated, association does not necessarily impute causation. More important, even if hyperglycemia results in the development or progression of complications, the practical questions of whether control of glucose levels will prevent or reverse complications, the extent and duration of the effect, and the costs of such control must be answered.
Important subsidiary questions include the following: (a) Will all diabetes-specific complications respond similarly to changes in glucose level? (b) Is the timing of intervention important, that is, is treatment effective only if instituted before the development of any complications (primary prevention) or is it also effective after the development of complications (secondary intervention)? (c) Does maintenance of a specific glucose level prevent or ameliorate any or all complications? (d) Will different methods (e.g., exogenous administration of insulin vs. pancreatic transplantation) of achieving more normal glycemia have similar effects on complications? (e) Will long-term complications in type 1 and type 2 diabetes respond similarly to therapy? (f) Will nonspecific macrovascular complications, the severity and frequency of which are increased in diabetes, be affected by therapies directed at achieving glucose levels closer to physiologic values?
STUDIES IN ANIMAL MODELS AND OBSERVATIONAL STUDIES IN HUMAN DIABETES
Retinopathy
ANIMAL STUDIES
Although none of the animal models of diabetes and its complications are sufficiently similar to human diabetes to provide more than suggestive evidence, they overwhelmingly support the premise that therapies that normalize blood glucose levels can prevent and/or ameliorate retinopathy, nephropathy, and neuropathy. The animal models fall into three different groups. In one model, animals with chemically induced (with alloxan or streptozotocin) diabetes are treated with insulin with the goal of achieving either tight or loose control of blood glucose levels (30,31). In another model, animals are pancreatectomized and treated with pancreatic or isolated islet cell transplantation (32,33). Finally, animals with genetic diabetes and various degrees of glycemia have been studied (34). Most studies have demonstrated efficacy of intensive therapy aimed at maintaining glucose levels close to the physiologic range in preventing complications. The ability of intensive diabetes therapy to affect complications once they have been initiated is arguable.
Studies by Engerman et al. of dogs with alloxan-induced diabetes are the most compelling of the animal studies (30,31). The diabetic dogs developed microaneurysms and pericyte loss similar to those seen in diabetic humans, changes not generally found in nondiabetic dogs. In an early study, therapy with two daily injections of isophane insulin (NPH insulin) with the goal of aglycosuria (“good control”) was initiated soon after the dogs were made diabetic (30). Good control was shown to be associated with fewer microaneurysms than was therapy with one daily injection of isophane insulin (“poor control”) over a 5-year period. A later study demonstrated that if dogs with alloxan-induced diabetes were treated with the poor-control regimen for 2.5 years followed by the good-control regimen for 2.5 years, they developed an intermediate number of microaneurysms, suggesting that secondary intervention was not as effective as primary prevention (31). Of note, severe hypoglycemia resulted in the deaths of several dogs in “good control.”
HUMAN STUDIES
Type 1 Diabetes
Early studies that examined the relationship of retinopathy to glucose control used relatively insensitive measures of retinopathy and nonquantitative, imprecise measures of chronic glycemia. Knowles reviewed 47 studies of glucose control and development of complications conducted before 1964 and concluded that the studies were hampered by the absence of quantitative methods of evaluating long-term glucose control and complications and by a poor appreciation of clinical-trial methodology (35). In the modern era, nondilated ophthalmoscopy has given way to seven-field stereoscopic fundus photography and fluorescein angiography, and sporadic blood glucose measurements and semiquantitative measures of glycosuria have been supplanted by assays of glycosylated hemoglobin (HbA1c).
Although lacking in these modern innovations, the noninterventional, longitudinal study of Pirart deserves mention, if only for its magnitude (36). Pirart followed a large (4,400)
cohort of patients with early- and late-onset diabetes for as long as 25 years. He noted that retinopathy, nephropathy, and neuropathy were more common in patients with a higher glycemic index, a value derived from intermittent measurements of blood and urine glucose levels and other factors. The high attrition rate over time, the lack of objective measures of complications and glycemia, and the possibility that complications led to worsened glucose control—rather than vice versa—detract from this study.
cohort of patients with early- and late-onset diabetes for as long as 25 years. He noted that retinopathy, nephropathy, and neuropathy were more common in patients with a higher glycemic index, a value derived from intermittent measurements of blood and urine glucose levels and other factors. The high attrition rate over time, the lack of objective measures of complications and glycemia, and the possibility that complications led to worsened glucose control—rather than vice versa—detract from this study.
In the modern era, the population-based, observational Wisconsin Epidemiologic Study of Diabetic Retinopathy (WESDR) examined diabetic residents of Wisconsin over time using measurements of HbA1c and seven-field stereoscopic fundus photography. Follow-up over 4 years included more than 90% of the original subjects and revealed a striking association between the incidence of any retinopathy, progression of retinopathy, progression to proliferative retinopathy (37), macular edema (38), and vision loss (39) and the level of HbA1c at baseline. The relationship between levels of HbA1c and retinopathy was continuous; no threshold within the diabetic range for HbA1c with regard to risk of retinopathy was noted. The observed associations remained after the comparisons were controlled for duration of diabetes, age, and baseline retinopathy. Although WESDR subjects were not strictly categorized as having type 1 or type 2 diabetes, the separation by age at onset (<30 years vs. ≥30 years) effectively provided populations of subjects with predominantly type 1 or type 2 diabetes. Other observational studies have confirmed these findings in more-selected type 1 populations (40,41,42,43) and have suggested that higher glycemic levels are a risk factor for the development of proliferative retinopathy (18,41,43).
Type 2 Diabetes
An association between retinopathy and glycemia similar to that for type 1 diabetes has been demonstrated for type 2 diabetes. Both the WESDR (14) and a study of type 2 diabetes in an aging population (55–75 years old) (16) showed that the relative risk of developing retinopathy increases as the level of HbA1c increases (Fig. 48.1). Putative risk factors for diabetic retinopathy, other than the level of glycemia, include hypertension (44), pregnancy (45), a family history of diabetic retinopathy (46), and possibly hypercholesterolemia (47), but probably not smoking (48).
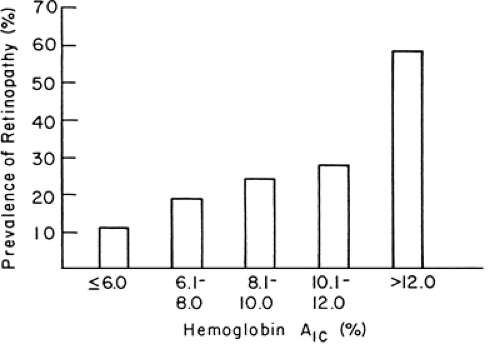 Figure 48.1. Association between mean glucose level as measured by level of glycosylated hemoglobin (HbA1c) and presence of retinopathy in older patients (55 to 75 years) with type 2 diabetes. (Copyright © 1986 American Diabetes Association. From Nathan DM, Singer DE, Godine JE, et al. Retinopathy in older type II diabetics: association with glucose control. Diabetes 1986;35:797–801. Reprinted with permission from the American Diabetes Association.) |
Nephropathy
ANIMAL STUDIES
Although glomerular lesions in several animal models of diabetes are similar to those seen in diabetic nephropathy in humans, the time course of the development of the lesions is difficult to compare with that in human diabetes. In addition, the contribution of other factors that play important roles in the genesis of human diabetic nephropathy cannot be evaluated in these models. As with retinopathy, studies of nephropathy in animal models can lend support to, but cannot prove, the glucose hypothesis.
Studies in animal models appear to demonstrate that nephropathy can be prevented or even reversed when diabetic animals are treated with pancreatic transplantation or with intensive insulin therapy. Rats with streptozotocin-induced diabetes develop mesangial thickening with immunoglobulin deposition within 6 to 9 months of diabetes onset (32). Successful islet transplantation can prevent the development of such lesions or lead to stabilization and some improvement in established lesions concurrent with normalization of glucose levels (32). Several fundamental problems apply to this model. First, diabetic rats develop a renal lesion (mesangial expansion) that differs from the early lesion of human nephropathy (glomerular basement membrane expansion) and do not develop end-stage renal failure. Second, other potentially important variables that might predict or influence development of nephropathy in humans (e.g., hypertension) cannot be studied in animal models. Third, rats in which transplants of pancreatic islet cells do not succeed in correcting glucose levels also show improvements in renal results (32). Despite these objections, studies in other animal models such as the BB/W (spontaneously diabetic) rat (49) and uninephrectomized, alloxan-treated dog (50) tend to support the role of glucose control in the genesis of nephropathy.
HUMAN STUDIES
Diabetic nephropathy poses several different problems, when compared with retinopathy, regarding the analysis of its association with glucose levels and of the effects of intensive therapy on its development and course. The natural history of diabetic nephropathy, although duration-dependent, extends over many more years than retinopathy before clinical expression becomes evident (51,52). Generally, a minimum of 12 years but usually 15 to 18 years of type 1 diabetes is required before the development of clinical-grade (dipstick-positive, i.e., ≥500 mg per 24 hours) proteinuria, the first incontrovertible sign of developing end-stage renal disease. After the development of clinical-grade proteinuria, a mean of 5 years is required for the decline in creatinine clearance, that terminates in end-stage renal disease, to begin (53). Thus, compared with the time course of diabetic retinopathy, for which signs will appear in 50% of individuals within 5 to 7 years of diabetes onset, the time course for the development of clinical nephropathy (dipstick-positive proteinuria), when it occurs, is much prolonged, requiring a duration of diabetes of approximately 15 years.
With the reluctance to perform kidney biopsies early in the course of diabetes for documentation of microscopic changes in the glomerulus and the less-than-perfect correlation between microscopic changes and clinical course, surrogate markers of evolving nephropathy have tentatively been identified. “Incipient” nephropathy, as demonstrated by microalbuminuria (generally >20–30 mg and <300 mg of urinary albumin per 24 hours), has been identified in retrospective studies of type 1 (54,55,56,57) and type 2 (58) diabetes as a predictor or marker for the development of end-stage renal disease. Unfortunately, microalbuminuria can vary considerably in individuals over time, with levels fluctuating from abnormal to normal values. Therefore, a urinary
albumin excretion rate of greater than 20 μg per minute (>28 mg per 24 hours) but less than 200 μg per minute (<288 mg per 24 hours) in at least two of three urine collections within a 6-month period has been suggested as a definition of “persistent” microalbuminuria (59). In addition, microalbuminuria may not be a predictor of nephropathy unless hypertension and a decreasing glomerular filtration rate also are present (60). Microalbuminuria can reverse in as many as 58% of affected persons, with lower levels of glycosylated hemoglobin, lower systolic pressure, and lower levels of cholesterol and triglycerides independently associated with regression (61). Finally, most of the data indicating an association between microalbuminuria and nephropathy are retrospective in nature. Whether any intervention that affects this presumed marker for nephropathy also will affect the long-term course of nephropathy has yet to be demonstrated conclusively. Despite these limitations, changes in microalbuminuria have been used as renal endpoints in many controlled trials.
albumin excretion rate of greater than 20 μg per minute (>28 mg per 24 hours) but less than 200 μg per minute (<288 mg per 24 hours) in at least two of three urine collections within a 6-month period has been suggested as a definition of “persistent” microalbuminuria (59). In addition, microalbuminuria may not be a predictor of nephropathy unless hypertension and a decreasing glomerular filtration rate also are present (60). Microalbuminuria can reverse in as many as 58% of affected persons, with lower levels of glycosylated hemoglobin, lower systolic pressure, and lower levels of cholesterol and triglycerides independently associated with regression (61). Finally, most of the data indicating an association between microalbuminuria and nephropathy are retrospective in nature. Whether any intervention that affects this presumed marker for nephropathy also will affect the long-term course of nephropathy has yet to be demonstrated conclusively. Despite these limitations, changes in microalbuminuria have been used as renal endpoints in many controlled trials.
There are several reasons to suspect that the association between glucose control and nephropathy may be more complex than that with retinopathy. The occurrence of nephropathy in no more than 40% of patients with type 1 diabetes and 25% of patients with type 2 diabetes suggests that variables other than glycemia are operant. Hypertension and family history of hypertension (62), smoking (63), and hyperlipidemia (64) have been suggested as possible mediators of nephropathy.
Type 1 Diabetes
The association between levels of glycemia and nephropathy has not been as clearly delineated as that for retinopathy. Although the Pirart study (36) demonstrated an association between the derived glycemic index and an increase in creatinine level over time, cross-sectional or longitudinal studies using objective measurements of glycemia and proteinuria are rare and have not consistently revealed such an association. Only one longitudinal study has demonstrated an association between mean levels of glycosylated hemoglobin, measured over 7 years, and risk of microalbuminuria in type 1 diabetes (65). Although this association persisted when age and duration of diabetes were taken into account, measurements of microalbuminuria at baseline, blood pressure, and other possible confounders were not considered in the analysis.
Potential reasons for the difficulty in establishing a relationship between glycemia and nephropathy, if such a relationship exists, are numerous. First, the development of renal failure may influence glycemic control in a number of ways (e.g., alterations in sensitivity to insulin and development of hypertension and effects of antihypertensive medications on glycemia). Second, uremia, anemia, and transfusions may interfere with or influence the accuracy of measurements of glycosylated hemoglobin. Finally, and most importantly, given the long duration of diabetes necessary before the development of renal failure, it is possible that infrequent measurements of glycosylated hemoglobin, representing a relatively brief period of exposure, may not be predictive of the development of nephropathy. The most convincing data come from the follow-up of long-term clinical trials, such as the DCCT.
Neuropathy
Diabetic neuropathy is protean in nature, with distal, symmetrical, somatosensory neuropathy, autonomic neuropathy, and mononeuropathies. Although electrophysiologic measures of nerve conduction have been available for more than 40 years, their questionable relevance to symptomatic clinical diabetic neuropathy has made the study of glucose control and neuropathy problematic. For example, the early observation that insulin treatment of new-onset type 1 diabetes reversed the slowed motor nerve conduction within 6 weeks in asymptomatic patients supported an acute effect of hyperglycemia on nerve conduction and cast doubt on the role of electrophysiologic testing (66). The absence of histologic data (e.g., sural nerve biopsy) in the vast majority of studies has been a major impediment to our understanding of diabetic neuropathy. A weak association between glycemia and motor and sensory nerve conduction has been documented in type 1 (67) and type 2 (68) diabetes.
CLINICAL TRIALS
Type 1 Diabetes
Although of interest, cross-sectional and longitudinal observational studies can at best only indicate associations between glycemic control (and other confounders) and complications. Randomized, controlled clinical trials examine the effects of treatments designed to achieve near-normal glucose control on the development and progression of complications and can establish causality. The introduction and refinement of methods for self-monitoring of blood glucose levels and of intensive therapies, such as continuous subcutaneous insulin infusion (CSII) with pumps and multiple daily injection (MDI) regimens (69), provided the opportunity to test whether such therapies would have salutary effects. Four well-designed randomized studies (70,71,72,73) set the stage for the larger and comprehensive Diabetes Control and Complications Trial (DCCT) (6,74). The first four clinical trials included the multicenter study by the Kroc Collaborative Study Group (70) and studies by the Steno Study Group (71), the Oslo group (72), and the Stockholm Diabetes Intervention Study group (73). All of these trials were secondary intervention studies, including only subjects with retinal lesions at baseline. In addition, the mean duration of diabetes was relatively long. The duration of the trials ranged from 8 to 60 months and included 30 to 100 subjects. (By contrast, the DCCT studied 1,441 subjects with a mean follow-up of 6.5 years.) The total number of patient-years of study was less than 800 in the four previous secondary intervention trials combined. The total number of patient-years for the secondary-intervention component of the DCCT was almost 5,000 at study end in 1993. Except for the Oslo study, which included two intensive-treatment groups, the studies compared subjects with type 1 diabetes randomly assigned to conventional treatment with subjects randomly assigned to CSII (Kroc and Steno) or
MDI (Stockholm). In all the studies the groups receiving intensive treatment maintained significantly lower levels of glycosylated hemoglobin than did those receiving standard treatment (Fig. 48.2). The results of the Kroc (70), Steno (71,75), and Oslo (72,76) studies were similar with regard to retinopathy. In the first 6 to 12 months, a transient worsening of retinopathy occurred in the patients receiving intensive treatment. Only the Stockholm Diabetes Study demonstrated a beneficial effect of intensive therapy over time (73).
MDI (Stockholm). In all the studies the groups receiving intensive treatment maintained significantly lower levels of glycosylated hemoglobin than did those receiving standard treatment (Fig. 48.2). The results of the Kroc (70), Steno (71,75), and Oslo (72,76) studies were similar with regard to retinopathy. In the first 6 to 12 months, a transient worsening of retinopathy occurred in the patients receiving intensive treatment. Only the Stockholm Diabetes Study demonstrated a beneficial effect of intensive therapy over time (73).
Related posts:

Stay updated, free articles. Join our Telegram channel

Full access? Get Clinical Tree


