Epidemiology of Diabetes Mellitus
James H. Warram
Andrzej S. Krolewski
SOME USEFUL DEFINITIONS
Prevalence, Incidence Rate, and Cumulative Incidence
The number of persons in a particular place at a particular time who have diabetes (e.g., in Massachusetts on July 1, 2001) is a frequently cited statistic. Expressed as a proportion, this number is commonly called the prevalence rate or, preferably, prevalence, so it is not confused with the incidence rate, which is defined below. The prevalence in Massachusetts is the accumulation of persons who acquired diabetes before July 1, 2001, but the size of this collection depends on not only the frequency of new cases but also on how long these persons remain alive to be counted. For example, a marked increase in the prevalence of insulin-dependent diabetes followed the discovery of insulin, although we have no evidence that the number of new cases that developed each year increased.
To express diabetes frequency in a manner suitable for drawing conclusions regarding etiology of the disease, we use the incidence rate. The incidence rate is calculated by dividing the number of new cases of diabetes in Massachusetts residents during the 12 months of 2001, for example, by the number of nondiabetic individuals residing in Massachusetts during that year. Typically, the incidence rate is expressed as the number of new cases per 100,000 persons observed for a year (called person-years).
When an incidence rate is calculated according to a characteristic such as age, sex, or race, the results are referred to as a specific rate. The age-specific incidence rate of diabetes varies enormously across the normal life span, and populations typically have different age distributions. Meaningful comparisons among populations must therefore be based on a particular age-specific rate or, for simplicity, on a summary of age-specific rates determined by a technique that gives each population the same age distribution (2). This produces age-adjusted or age-standardized rates. Alternatively, one can compare populations that have different age structures by calculating the cumulative incidence of diabetes at specific ages in each population.
Cumulative incidence or cumulative risk of diabetes is calculated from the age-specific incidence rate by use of life-table methods (2). One begins with an arbitrary number of births (e.g., 1,000 births) and applies the age-specific incidence rate to the number of persons who remain unaffected after each successive year of age. By accumulating the cases from previous ages, one obtains the proportion of the original 1,000 children born who would be affected by each successive age in a population. By extending this process to the whole life span, one obtains the lifetime risk of diabetes. In a specific instance, the prevalence of diabetes at a certain age may be a reasonable estimate of cumulative incidence at that age. For example, type 2 diabetes-related mortality before the age of 55 years is negligible. Therefore, the prevalence of type 2 diabetes in the age group 45 through 54 years is a reasonable estimate of the cumulative incidence at age 50 years. However, at older ages, prevalence typically underestimates cumulative incidence of diabetes because persons with early onset of the disease may have died.
DIFFERENCES IN DISTRIBUTION OF TYPE 1 AND TYPE 2 DIABETES
The incidence rate is the most informative measure of the frequency of diabetes in a population for the study of etiologic factors. For the computation of the incidence rate, new cases of diabetes must be recognized and counted. Type 1 diabetes is easily recognized, and virtually all new cases are ascertained in a society with access to medical care. Recognition of new cases of type 2 diabetes, however, depends on the severity of symptoms, diagnostic activity of the medical-care system, and the choice of diagnostic criteria (3).
Data on the incidence rate of diabetes in Rochester, Minnesota, as ascertained through medical-care institutions, show how the incidence rate of type 1 diabetes varies according to age (Table 20.1) (4,5). Among the nondiabetic population of Rochester, type 1 diabetes developed in 7 to 27 individuals per 100,000 per year—depending on the age group being counted. The risk increases during the first and second decades of life, levels off during the third and fourth decades, and increases again thereafter, suggesting that there are two peaks of occurrence of type 1 diabetes, one centered in the second decade and the other in the sixth and seventh decades. The incidence rate of type 2 diabetes increases steadily with age (Table 20.1), with an almost 100-fold increase from early childhood to old age.
TABLE 20.1. Age-Specific Incidence Rates of Type 1 and Type 2 Diabetes per 100,000 Person-Years in Rochester, 1960 through 1969 | |||||||||||||||||||||||||||||||||
|---|---|---|---|---|---|---|---|---|---|---|---|---|---|---|---|---|---|---|---|---|---|---|---|---|---|---|---|---|---|---|---|---|---|
| |||||||||||||||||||||||||||||||||
The sets of age-specific incidence rates can be summarized as cumulative incidence rates (i.e., the cumulative risk in a cohort of individuals followed from birth and exposed to the age-specific rates). For the age-specific rates in Table 20.1, the cumulative risk by age 70 years would be 1% for type 1 diabetes and 11% for type 2 diabetes.
EPIDEMIOLOGY OF TYPE 1 DIABETES
Any hypothesis put forward regarding the etiology of type 1 diabetes must account for the characteristics of its distribution in human populations that are discussed below. Most studies of type 1 diabetes have considered only the disease occurrence in children, typically under the age of 15 years. Therefore, this review is largely restricted to a consideration of the characteristics of diabetes occurring in the first two decades of life (the first peak in Table 20.1). Little is known about the determinants of type 1 diabetes occurring in adults (the second peak in Table 20.1).
Variation In Incidence of Type 1 Diabetes With Age
Type 1 diabetes rarely occurs during the first year of life. Of nearly 10,000 incident cases included in the Finnish Childhood Diabetes Registry between 1965 and 1996, only 37 cases (0.4%) had onset before the first birthday (7). The incidence rises sharply until age 12 to 14 years, and then declines. The relationship with age is clearly seen in Figure 20.1, in which the incidence rate of type 1 diabetes in Denmark is presented according to age (8). A similar pattern is seen in most other countries, regardless of whether their overall incidence of type 1 diabetes is high or low.
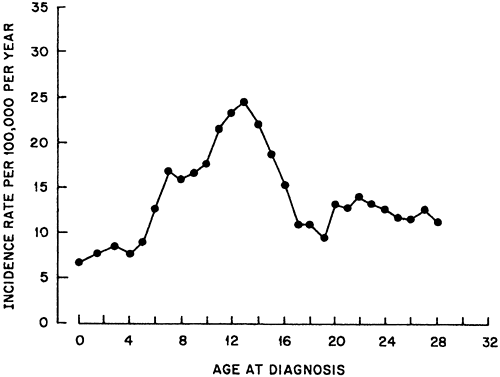 Figure 20.1. Incidence rate of type 1 diabetes according to individual years of age. (Adapted from Christau B, Kromann H, Christy M, et al. Incidence of insulin-dependent diabetes mellitus (0–29 years at onset) in Denmark. Acta Med Scand Suppl 1979;624:54–60.) |
Data on the incidence of type 1 diabetes with onset after the age of 30 years are scarce. In a population study of two counties in Denmark (9), the rate was 8.2 per 100,000 when very stringent diagnostic criteria for type 1 diabetes were used, and the age at onset resembled that for type 1 diabetes in Rochester, Minnesota (Table 20.1). When the criteria were relaxed to consider all patients treated with insulin from the onset of diabetes as having type 1 diabetes, the incidence rate rose to 35.8 per 100,000, with the difference being due to an increased magnitude of the peak in the oldest decades of age.
Variation In Incidence of Type 1 Diabetes among Races and Countries
Interest in the epidemiology of diabetes in the last two decades has resulted in the publication of a multitude of papers on the incidence rate in most areas of the world. A sample of these data illustrates the large magnitude of the geographic variation in the occurrence of type 1 diabetes (Fig. 20.2) (10). According to a recent compilation of data from 100 studies conducted in 50 countries, the lowest age-adjusted incidence rates for the population aged 0 to 14 years are in Asia, the Caribbean, and Latin America (ranging from 0.1 to 3.5 per 100,000 per year) and the highest are in Nordic countries, the United Kingdom, Canada, New Zealand, Portugal, and Sardinia (ranging from 21.2 to 36.8 per 100,000 per year) (11). The incidence rate of type 1 diabetes
in the white population in the United States, represented by three studies, ranges from 11.7 to 16.4 per 100,000 per year. This gives the United States a rank close to that for high-risk populations.
in the white population in the United States, represented by three studies, ranges from 11.7 to 16.4 per 100,000 per year. This gives the United States a rank close to that for high-risk populations.
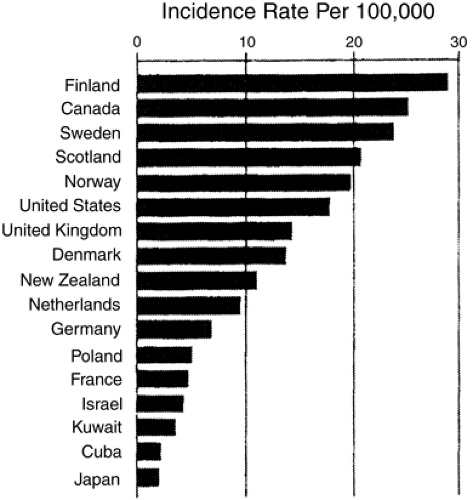 Figure 20.2. Incidence rate of type 1 diabetes in children less than 15 years old (per 100,000) in various populations. (From Patrick SL, Moy CS, LaPorte RE. The world of insulin-dependent diabetes mellitus: what international epidemiologic studies reveal about the etiology and natural history of IDDM. Diabetes Metab Rev 1989;5:571–578.) |
Data on the occurrence of type 1 diabetes according to race in the United States have been accumulating during the last two decades. In general, the reported incidence rate for nonwhites is lower than that for whites in the population aged 0 to 14 years. For example, in Allegheny County, Pennsylvania, the race-specific incidence rates during the 5-year period 1978 to 1983 were 16.2 and 11.8 per 100,000 for white and black children, respectively (11). During a similar calendar period in Jefferson County, Alabama, and in San Diego, California, the rates were much lower for blacks (4.4 and 3.3 per 100,000, respectively), although the rates for whites were similar in the three locales (12). Curiously, during a more recent period (1990 to 1994), the incidence rate in Allegheny County for blacks aged 10 to 14 years rose to equal that for whites and the rate for blacks aged 15 to 19 years exceeded that for whites (13). The reported rate among Hispanic children aged 0 to 14 years ranges from 9.7 per 100,000 in Colorado to 4.1 per 100,000 in California, while the incidence rate in Mexico is among the lowest in the world (12).
In summary, the accumulated data on the incidence of type 1 diabetes during the last 20 years demonstrate that type 1 diabetes occurs in most racial and ethnic groups but that the risk is highest among white populations (11). While genes may in part determine these differences among races, the range of variation within the white population is almost as great as the range among races. Therefore, an important question to be resolved is how much of the variation within and between racial groups is due to genetic differences and how much is due to exposure to different environmental factors.
Temporal Increase In Incidence of Type 1 Diabetes
The pattern of occurrence of type 1 diabetes over time can be important evidence in discriminating between alternative etiologic hypotheses. In particular, a lack of variability from generation to generation is a feature of many genetic traits. If, on the other hand, there is significant variability over time, nongenetic factors are presumably important. The particular pattern of variation may suggest specific environmental factors that can be investigated as components of the etiology of type 1 diabetes. Several types of variation over time have been described: long-term trends, a seasonal cycle, and episodic changes over a few years.
The few sources of data that contribute to an analysis of long-term trends in the incidence of type 1 diabetes in the United States are summarized in Figure 20.3 (6). During the first three decades of the 20th century, the incidence rate of type 1 diabetes in the white population younger than age 15 years was fairly constant. However, during the next three decades, the rate almost tripled. Data from several other countries are compatible with those from the United States. The incidence rate for children younger than age 15 years in Oslo, Norway, rose from 6.2 for the years 1925 through 1954 to 10.8 for the years 1956 through 1965 (14) and then to 20.5 for the years 1973 through 1982 (15), values quite close to those in the United States. In Finland, where the incidence of type 1 diabetes is higher than in the United States, a steady increase in the incidence rate for children aged 1 to 14 has been documented since 1965, reaching a value of 44.8 per 100,000 per year in 1996. The increase was greatest in the age group 1 to 4 years (Table 20.2) (16).
TABLE 20.2. Increase in the Incidence Rate (Per 100,000 Person-Years) of Type 1 Diabetes in Children Younger Than 15 Years in Finland between 1965 and 1996 | |||||||||||||||||||||||||||||||||||
|---|---|---|---|---|---|---|---|---|---|---|---|---|---|---|---|---|---|---|---|---|---|---|---|---|---|---|---|---|---|---|---|---|---|---|---|
| |||||||||||||||||||||||||||||||||||
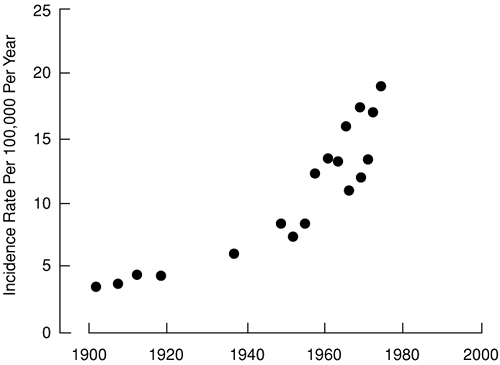 Figure 20.3. Incidence rate of type 1 diabetes in children in the white population of the United States from 1900 to 1976. (From Krolewski AS, Warram JH, Rand LI, et al. Epidemiologic approach to the etiology of type 1 diabetes mellitus and its complications. N Engl J Med 1987;317:1390–1398.) |
During the period 1989 to 1994, 44 centers representing most European countries collaborated in a study of the time trend in incidence rate of type 1 diabetes. The average annual increase in incidence was 3.4% overall, but it varied among centers and by age. As in the Finnish study, the increase was steepest for the age group 0 to 4 years (6.3% per year) and lowest for the age group 10 to 14 years (17). The reason for the secular increase in the incidence of type 1 diabetes in so many populations is unclear. In several regards, this long-term trend in the occurrence of type 1 diabetes resembles aspects of the emergence of poliomyelitis early in the 20th century. It has been speculated
that, by analogy, delayed exposure to a common virus may predispose to autoimmunity involving β-cells (6).
that, by analogy, delayed exposure to a common virus may predispose to autoimmunity involving β-cells (6).
Seasonal variability in diagnoses of type 1 diabetes attracted much attention in the 1970s (18,19). It has since been established, however, that type 1 diabetes has a long subclinical period, so the seasonal pattern in diagnoses presumably results from the seasonal occurrence of factors that precipitate the appearance of symptoms in asymptomatic cases (such as common infections) or that result in closer observation of children (such as the return to school). The issue has been revisited recently with data provided by 16 centers representing 11 countries in Europe plus Israel (20). In most populations, a sinusoidal model with the peak incidence in a winter month was statistically significant. Interestingly, the exceptions were the two Scandinavian countries represented in the analysis (Norway and Finland). The pattern did not vary by gender or age group.
Recently, some attention has focused on short-term (year-to-year) variability in the incidence of type 1 diabetes. An apparent epidemic during 1982 through 1984 was described in midwestern Poland (21). The incidence rate in children under 18 years old in those years was double that between 1970 and 1981. Similar “epidemics” in the U.S. Virgin Islands and Jefferson County, Alabama, in 1984 have been described (22,23). The basis for these variations remains unresolved, but many attempts have been made to link them with epidemics of infectious diseases. However, because the subclinical period for type 1 diabetes typically lasts for several years, it is difficult to establish an etiologic link between a specific infection and the diabetes “epidemic,” if such a link does exist.
Environmental Triggers of Type 1 Diabetes
The long-term trend in the occurrence of type 1 diabetes resembles aspects of the emergence of poliomyelitis early in the 20th century and has prompted speculation that, by analogy, delayed exposure to a common virus may predispose to destruction of the β-cells (6). Epidemiologic evidence supporting this hypotheses is the low risk of type 1 diabetes associated with markers of crowding or early social mixing, such as attendance at day care centers (24,25). Evidence of the role of enteroviral infections, particularly Coxsackie B, has recently been reviewed (26). Markers of recent infection have been associated in many different circumstances with type 1 diabetes: the presence of antibodies at the time of onset of type 1 diabetes, at the onset of islet autoimmunity, and even in maternal serum obtained during the gestation of children who subsequently developed diabetes. Although acute destruction of the β-cells by a virus, as originally supposed, is incompatible with the long subclinical period during which islet-cell antibodies are detectable, viral infection may play a role as initiator of autoimmunity, as promoter of progression of autoimmunity to type 1 diabetes, or both (26).
Concern about early exposure to cow’s milk protein as a trigger of β-cell autoimmunity and the subsequent development of type 1 diabetes in susceptible individuals receives a lot of attention. The epidemiologic evidence suggesting this hypothesis came from a case-control study that found a decreased frequency/duration of breastfeeding in cases. The effect could be due to a lack of a protective effect of breastfeeding or to exposure to an initiator of autoimmunity in cow’s milk. Subsequent studies have been inconsistent in replicating this finding, and the overall small magnitude of the effect can plausibly be attributed to recall bias (27). Preliminary results of follow-up studies that monitor the appearance of autoimmunity to β-cells in high-risk infants and small children have not found any association with early exposure to cow’s milk (28).
Clustering of Type 1 Diabetes In Families
Studies of the pattern of disease occurrence in families are another approach to evaluating the relative contributions of genes and environment to disease etiology. The study of twins provides an appealing simple design. The premise is that monozygotic twins carry identical genotypes but that dizygotic twins are no more similar genotypically than nontwin siblings. A more frequent concordance for diabetes among monozygotic twins than among dizygotic twins, therefore, favors a greater role of genetic factors. Unfortunately, the simplicity of the study design is negated by the small size of the twin population and the rarity of type 1 diabetes. The chief problems are the small sample size if the twin sample is population-based and uncertainty about ascertainment biases if it is not. With these caveats in mind, the best estimate of the concordance rate for type 1 diabetes in monozygotic twins appears to be in the neighborhood of 45%, whereas that for dizygotic twins is about 25% (29). While this result argues for a role of genes, it also supports a major role of environment. The concordance rate for monozygotic twins is far below 100%, indicating that genes are not a sufficient cause. Moreover, the concordance rate for dizygotic twins is higher than for nontwin siblings, presumably due to the greater sharing of environmental exposures by twin siblings than by nontwin siblings (29).
A more useful measure of familial aggregation is the sibling recurrence-risk ratio, which is defined as the ratio of the risk of disease in the siblings of cases to the risk in the general population. A ratio greater than 1 indicates familial aggregation. Although such aggregation is not exclusively the result of
genetic factors and may reflect environmental exposures that are also shared by family members, strong familial aggregation (ratio greater than 6) is unlikely to be due solely to environmental exposures (30).
genetic factors and may reflect environmental exposures that are also shared by family members, strong familial aggregation (ratio greater than 6) is unlikely to be due solely to environmental exposures (30).
Three studies, two conducted at the Joslin Diabetes Center in Boston and one conducted at the Steno Hospital in Copenhagen, permit computation of the cumulative risk of diabetes up to age 50 years for the siblings of type 1 diabetes probands. In all three studies, the probands (patients with type 1 diabetes that brought the families into the study) were diagnosed before age 21 years. In the earlier Joslin Diabetes Center study, 289 probands were diagnosed during the years 1928 through 1938 and their 589 siblings were followed to a median age of 49 years (31). In the later Joslin study, 168 probands were diagnosed in the years 1948 through 1960 and their 335 siblings were followed to a median age of 41 years (32). In the Danish study, 187 probands were diagnosed during the years 1918 through 1944 and their 375 siblings were followed to a median age of 52 years (33). The three studies yielded almost identical estimates of the cumulative risks by age 50 years (Fig. 20.4). For comparison, the cumulative risk at age 50 years in the general population was calculated to be 0.5% (Table 20.1). Thus, the risk to siblings by age 50 years seems to be approximately 10%, or 20 times the risk in the general population.
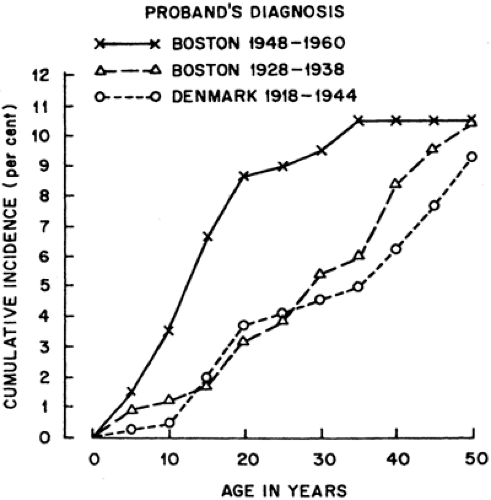 Figure 20.4. Cumulative incidence of type 1 diabetes in the siblings of probands with type 1 diabetes, as estimated in three different studies of families. (From Warram JH, Krolewski AS. Changing age-at-onset of diabetes in siblings of probands with insulin-dependent diabetes. Am J Hum Gen 1985;37[Suppl]:A208[abst].) |
A sibling recurrence-risk ratio of this magnitude (20 times the population risk) is strong evidence of the role of genes in the etiology of type 1 diabetes (see Chapter 23). However, it is important to note that the major histocompatibility locus (also known as IDDM1) on chromosome 6 is responsible for only half of the familial clustering of type 1 diabetes (34). The rest is presumably due to other genetic factors or shared family environment. Possible evidence of the impact of environment is suggested in the results of these three studies of the sibling recurrence risk. Despite the close agreement regarding the cumulative risk at age 50 years, there are interesting and statistically significant differences in the cumulative incidence rates at younger ages.
The cumulative risk of diabetes by age 15 years was 6.3% for the siblings of the 1950s cohort of the Joslin patients but only 1.7% and 1.9% for the siblings in the earlier Joslin and Danish studies, respectively. Results very similar to those of the recent Joslin study were reported for a study in Wisconsin of 194 probands with type 1 diabetes whose diagnosis was made before the age of 30 years during the years 1984 through 1987. The cumulative risk of type 1 diabetes was 10.5% by age 20 years in the sibling (35). This three- to fourfold increase in early-onset diabetes in the siblings of recently diagnosed probands suggests that there is a shift toward a younger age at clinical onset of type 1 diabetes in a population enriched with susceptible individuals. The previously discussed secular trend in the incidence rates of type 1 diabetes in the general population of children younger than age 15 years also might reflect a shift toward earlier manifestation of type 1 diabetes in susceptible individuals (36).
Evidence consistent with this hypothesized interaction between susceptibility and a changing environment has come from a recent collaborative study of sibling recurrence risk in 15 European countries plus Israel (37). The country-specific sibling recurrence risk was highly correlated with the risk of diabetes in that country (Spearman correlation 0.71). Because the sharing of genes among siblings is the same in all populations, this correlation must be due to variation in environmental factors that have similar effects on the siblings of index cases and the general population.
Parent-offspring pairs are another type of first-degree familial relationship that can be examined for familial aggregation of type 1 diabetes. A few follow-up studies of children of a parent with type 1 diabetes permit estimation of the cumulative risk of type 1 diabetes in the offspring up to the age of 20 years. As was found for siblings, the risk is much higher than for the general population, but surprisingly, there is a significant difference between the rate for offspring of diabetic fathers and the rate for offspring of diabetic mothers. For the offspring of diabetic fathers, the cumulative incidence of type 1 diabetes by age 20 years is 6%, or 20 times that for the general population (38,39). For the offspring of diabetic mothers, the corresponding cumulative incidence is approximately 2%, which is only seven times that in the general population (40). In two small studies of offspring born to women who did not develop type 1 diabetes until after the birth of the child (41,42), the children appeared to have a risk of type 1 diabetes similar to that of the children of fathers with type 1 diabetes. These data suggest that exposure to a diabetic environment in utero may have a protective effect on the offspring, perhaps by inducing immunologic tolerance to the antigen involved in the autoimmune destruction of the pancreatic β-cells (41).
Another factor that seems to modify the clustering of type 1 diabetes in families is the age of the proband at onset of type 1 diabetes (43). Regardless of the gender of the diabetic parent in the studies just described, the risk for offspring was approximately two times higher if type 1 diabetes in the parent was diagnosed before the age of 11 years rather than later (Fig. 20.5). Similar results were obtained in a Danish study of offspring of parents with type 1 diabetes (42). These findings suggest that environmental factors played a larger role in the etiology of diabetes when the age at onset is older rather than younger.
Related posts:
 Genetic Regulation of Islet Function
Magnetic Resonance Spectroscopy Studies of Liver and Muscle Glycogen Metabolism in Humans
Genetics of Type 1 Diabetes
Diabetes in Minorities in the United States
Behavioral Research and Psychological Issues in Diabetes: Progress and Prospects
Pancreas and Islet Transplantation
Genetic Regulation of Islet Function
Magnetic Resonance Spectroscopy Studies of Liver and Muscle Glycogen Metabolism in Humans
Genetics of Type 1 Diabetes
Diabetes in Minorities in the United States
Behavioral Research and Psychological Issues in Diabetes: Progress and Prospects
Pancreas and Islet Transplantation
Stay updated, free articles. Join our Telegram channel

Full access? Get Clinical Tree


