Genetics of Type 1 Diabetes
Helena Reijonen
Patrick Concannon
It has long been recognized that certain forms of diabetes cluster within families. In families with type 1 diabetes, the risk of developing disease increases with genetic relatedness to a proband. Defining the underlying mechanisms of genetic susceptibility has been an important goal of research in type 1 diabetes for a number of reasons. Identification of genes that contribute to the risk of type 1 diabetes should provide new insights into the underlying mechanism of disease development and create new opportunities for therapeutic intervention. Definition of the genetic factors that predispose to type 1 diabetes should enhance the ability to predict who in the population may be at risk for type 1 diabetes, and such improved prediction may facilitate the development of novel preventive therapies. For example, the size of clinical trials could be reduced and the risks of therapies with potential side effects could be balanced by increased confidence that a highly specific “at-risk” population was being targeted.
Beginning in the early 1980s, the development of new tools and technologies for genetic-linkage analysis and positional cloning has resulted in the identification of genes underlying many genetic disorders. However, for type 1 diabetes, and indeed for most autoimmune disorders, progress toward identifying the underlying susceptibility genes has been slow. At the heart of this problem is the fact that these disorders share a
common complicating factor for genetic studies—their mode of inheritance is unknown. The greatest single risk factor for type 1 diabetes is having an identical (monozygotic) twin with the disorder. However, the concordance rate for monozygotic twins is far less than 100%, with most studies placing the rate in the range of 25% to 50% (1). Concordance rates in monozygotic twins reflect the total familial contribution to risk, some of which will also be environmental, further lessening the expected role of genetic risk factors. This means that environmental factors, familial and nonfamilial, likely account for a significant fraction of the risk of developing type 1 diabetes.
common complicating factor for genetic studies—their mode of inheritance is unknown. The greatest single risk factor for type 1 diabetes is having an identical (monozygotic) twin with the disorder. However, the concordance rate for monozygotic twins is far less than 100%, with most studies placing the rate in the range of 25% to 50% (1). Concordance rates in monozygotic twins reflect the total familial contribution to risk, some of which will also be environmental, further lessening the expected role of genetic risk factors. This means that environmental factors, familial and nonfamilial, likely account for a significant fraction of the risk of developing type 1 diabetes.
Risk for type 1 diabetes declines as genetic relatedness to a proband in a family declines but remains elevated relative to the population risk in first-, second-, and even third-degree relatives of a proband. The risk to siblings of a proband is not significantly different from that to offspring, suggesting that the genetic variance in type 1 diabetes is additive. Under a strictly additive model, the relationship between genetic relatedness to a proband and risk of type 1 diabetes should be a linear function of the population prevalence. However, an examination of the risk of type 1 diabetes in second- and third-degree relatives suggests a nonlinear relationship. This argues against the possibility that a single locus with reduced penetrance accounts for type 1 diabetes risk and is most consistent with models in which multiple genes combine in an additive fashion to confer risk (2).
The combination of a substantial environmental component to risk and the presumed actions of an unspecified number of genes conspires to obscure the relationship between the genotype at any specific locus and the phenotype of type 1 diabetes. The weakness of this link between the disease phenotype and underlying genotype complicates efforts to define the underlying genetic elements responsible for susceptibility by genetic-linkage approaches. In a linkage-based approach, an investigator searches the genome in a systematic manner, typically by genotyping polymorphic markers spaced at defined intervals, in the hope of identifying markers that cosegregate with disease. Linkage approaches are very powerful and have resulted in the identification of genes responsible for many inherited disorders with known modes of inheritance. However, when applied to a genetically complex disorder, like type 1 diabetes, the inability of the investigator to specify a known mode of inheritance for the disorder can dramatically reduce the power of this approach. As a result, many investigators have turned to other approaches for mapping and identifying type 1 diabetes genes that, while less powerful, are relatively model-independent. The two general categories of approaches that have been used most extensively are those designed to detect allelic association and those that use identity-by-descent methods for the detection of linkage.
GENETIC APPROACHES TO IDENTIFICATION OF SUSCEPTIBILITY GENES IN COMPLEX DISORDERS
Linkage Mapping Approaches
Because of the difficulties in applying traditional parametric approaches for detecting linkage to complex disorders, many investigators have opted for less powerful, but more flexible, nonparametric approaches. As with traditional parametric approaches, a systematic scan of the entire genome using regularly spaced polymorphic markers is carried out. However, the individuals used in these analyses are affected relative pairs—most commonly affected sibling pairs (ASPs). The rationale is that relatives who share a disease phenotype are more likely to share whatever genetic elements act to increase familial aggregation for that phenotype. Thus, the investigator searches for regions of the genome that are more frequently shared among affected relative pairs than would be expected by chance. These approaches to mapping can be carried out with only the affected sibling (sib) pairs. However, substantially greater power to detect linkage can be achieved if parental genotypes are also available either by direct determination or by inference through the genotyping of additional relatives, so that alleles identical by descent can be identified in the affected offspring.
Equally as important as the methodology used for the mapping of susceptibility genes are the criteria used for assessing what constitutes significant evidence of genetic linkage. The strength of the evidence for linkage at a given site in a genome scan is typically reported in the form of a LOD (logarithm of the odds) score, a z score, or a p value. Although these different measures can all be interconverted, there are important distinctions between them. An LOD score is the log-likelihood ratio of the data under the hypothesis that the proportion of alleles shared has the observed value as compared with the hypothesis that there is no excess of allele sharing. Sometimes, this value is reported as a maximized LOD score (MLS), indicating that it has been maximized over a series of parameters. A z score represents the number of standard deviations by which the observed proportion of alleles shared between ASPs exceeds 0.50. The p value represents the chance of the observed deviation in allele sharing under independent assortment. In evaluating such significance measures, it is important to distinguish between locus-specific, or point-wise, significance and genome-wide significance. Point-wise significance refers to the evaluation of a single test of a hypothesis of linkage at one point in the genome. Genome-wide significance requires that results meet a much higher standard since it reflects the evaluation of multiple tests performed at markers spanning the genome (as in a genome scan) to find the most significant results.
Completing a genome-wide scan for linkage in a collection of nuclear families with reasonable power (3) (e.g., 100 to 200) requires a significant effort. Therefore, investigators are anxious to have some positive findings to report. This enthusiasm must, however, be balanced with the recognition that accumulating large numbers of reported linkages that do not reproduce in subsequent studies is counterproductive. Several investigators have suggested guidelines for evaluating the significance of findings in human genome scans that involve a series of thresholds corresponding to the likelihood of observing a given effect on allele sharing due to random chance (4,5). These classifications are as follows: (a) suggestive linkage is statistical evidence that would be expected to arise one time at random in a genome-wide scan and corresponds to a p value of 7.4*10-4 or, in ASPs, to an MLS or LOD of 2.2; (b) significant linkage is statistical evidence expected to arise 0.05 times in a genome-wide scan and corresponds to a p value of 2.2*10-5 or an LOD of 3.6; (b) highly significant linkage is statistical evidence expected to occur only 0.001 times in a genome-wide scan and corresponds to a p value of 3*10-7 or an LOD of 5.4. These guidelines are helpful in evaluating the relative strength of findings of linkage at different sites in the genome and will be used throughout this chapter with these meanings. However, it is important to remember that these are only guidelines; excessive adherence to fixed thresholds for significance may exclude important findings.
A convenient metric for quantitating the contributions of inheritance to risk in genetically complex disorders, such as type 1 diabetes, is the term γ (6), which is the ratio of the risk to an individual with a defined relation to an affected proband to the population risk for a given disorder. For example, for type 1 diabetes in the white population in the United States, the risk to
a sibling of an affected proband is approximately 6%, whereas the population risk is approximately 0.4%, yielding a γs value (γ for affected sib pairs) of approximately 15. Higher γ values correspond to greater familial contributions to risk. Thus, complex disorders with higher γ values are more likely to be amenable to genetic-mapping approaches targeted at identifying the genes that contribute to susceptibility. γ can also be used to quantitate the contribution of individual loci by comparing the observed frequency of ASPs who share no parental alleles for a given marker to the expected frequency if inheritance at the locus is random (0.25). Locus-specific γ values, calculated in this way, can be used to rank the contributions of individual loci and, with some assumptions about the way in which different loci might interact, to estimate the contribution of individual loci to the overall γ for the disorder. In addition, γ values can be used as a tool to estimate the power of a study to detect linkage. The number of ASPs necessary to detect a locus of a given effect can be estimated prior to collecting data, and, conversely, the power to exclude linkage for a locus with a given γ value can be calculated for an existing data set.
a sibling of an affected proband is approximately 6%, whereas the population risk is approximately 0.4%, yielding a γs value (γ for affected sib pairs) of approximately 15. Higher γ values correspond to greater familial contributions to risk. Thus, complex disorders with higher γ values are more likely to be amenable to genetic-mapping approaches targeted at identifying the genes that contribute to susceptibility. γ can also be used to quantitate the contribution of individual loci by comparing the observed frequency of ASPs who share no parental alleles for a given marker to the expected frequency if inheritance at the locus is random (0.25). Locus-specific γ values, calculated in this way, can be used to rank the contributions of individual loci and, with some assumptions about the way in which different loci might interact, to estimate the contribution of individual loci to the overall γ for the disorder. In addition, γ values can be used as a tool to estimate the power of a study to detect linkage. The number of ASPs necessary to detect a locus of a given effect can be estimated prior to collecting data, and, conversely, the power to exclude linkage for a locus with a given γ value can be calculated for an existing data set.
Association Approaches
Association studies seek to identify alleles at polymorphic markers that are significantly over- or underrepresented among unrelated cases as compared with controls. In the ideal situation, such a result arises because the polymorphism under study is directly involved in disease predisposition. Consequently, association studies tend to focus on specific candidate genes where there is some a priori expectation that the polymorphism under study might affect gene function and that the gene might be involved in the development of type 1 diabetes. A given marker tested by such an approach also may detect association that does not reflect direct involvement of the tested polymorphism in the disease process. Again, in an idealized situation, this result can occur when alleles at the true disease-predisposing locus are either physically close to the marker under study or of recent origin. Such a condition arises when there has not been sufficient time for recombination to randomize the relationship between alleles at the two polymorphic sites. Alleles at such loci are said to be in linkage disequilibrium. The ability to indirectly sample the role of multiple polymorphic loci using a single marker via linkage disequilibrium is a potential advantage of the association approach but also necessitates careful follow-up studies in the event of a positive result to determine where the biologically relevant polymorphisms are located. Allelic association with disease also can arise for spurious reasons, the most common being that there is unrecognized structure in the population being studied such that marker allele frequencies differ between cases and controls at loci that are not linked to a disease-causing polymorphism.
Association studies often are done in a case-control format in which allele frequencies or population frequencies for a marker under study are compared between affected and unaffected populations. The case-control format is appealing because it is relatively easy to ascertain subjects for such a study and the overall number of genotypes required is generally less than for family studies. However, there are also some family-based approaches for detecting allelic association that reduce the risk of errors due to unrecognized structure in the case or control population. These approaches require information from additional unaffected relatives of the cases to establish parental genotypes for the marker under study. These family-based tests fall into two broad categories. One category is typified by the “haplotype relative risk” or HRR approach, in which allele frequencies are compared using the pools of parental alleles (7,8,9) transmitted or not transmitted to affected offspring as the case and control groups, respectively. The other category includes variants of the transmission/disequilibrium test (TDT), in which actual transmissions from heterozygous parents to affected offspring are tallied on a family-by-family basis (10). The TDT is, in reality, a test for both linkage and association and builds on the fact that, whereas linkage at a given marker can be detected in the absence of association, true association should not occur in the absence of linkage. Family-based methods for association testing are much more resistant to errors arising from population structure. Indeed, on theoretical grounds, the TDT is unaffected by such effects, making it the method of choice in populations in which structure cannot be ruled out (11).
Although a well-designed case-control study with carefully selected subjects should be relatively free from errors arising from population substructure, family-based approaches for detecting association still have definite advantages. In the case of type 1 diabetes, where the disease has a relatively early age at onset, the challenge in obtaining biologic samples from both parents and an affected child (“trios”) is much reduced. Currently, the primary applications of association testing are in the evaluation of candidate genes and the narrowing of regions implicated in linkage studies as possibly containing type 1 diabetes susceptibility genes. However, genome-wide association testing is theoretically possible and may ultimately become the preferred approach for mapping genes in complex diseases such as type 1 diabetes (12). Implementation of such an approach is currently limited by the lack of an established method for evaluating the statistical evidence for association at specific sites in the face of the huge volume of tests that would need to be performed to extend such an approach across the genome. In addition, the density of markers required to carry out a comprehensive genome-wide scan for association is theoretically quite large and could potentially overwhelm the laboratory methods currently in use for genotyping (13). However, recent studies indicating that the human genome can be parsed into “haplotype blocks” of relatively modest diversity raise hopes that whole-genome association studies might be accomplished using a selected set of polymorphic markers that effectively tag these blocks (14,15,16,17). Such an approach will require the definition of haplotype blocks present in human populations—a haplotype map.
Positional Cloning and Gene Identification
Association-based and linkage-based approaches identify only the regions that may contain susceptibility genes; a significant effort is still required in any such region to determine unambiguously the identity of the gene or genes that contribute to susceptibility. Linkage approaches have some advantages over association studies as an initial screening tool for identifying candidate regions, because linkage can typically be detected over greater distances than can association. However, this strength of linkage-based approaches is a weakness at the next step of gene identification, because the regions that are identified in such studies often span tens of millions of nucleotides and encompass numerous genes. Since it is impossible in a genetically complex disorder to identify families that are truly linked to a particular susceptibility gene and separate them from those that share parental alleles by chance alone, observed recombination events cannot be used to define a more restricted region containing the gene of interest. Indeed, the standard approach to limiting such regions further has been to carry out association studies using markers within the region. In contrast to linkage-based approaches, association studies, if positive,
implicate genes within a much narrower physical region, because linkage disequilibrium typically does not extend over large physical distances unless the study population is inbred and/or has passed through a population bottleneck in recent history (13). However, this means that most candidate markers or genes tested for association will return nonpositive results. Because association studies do not provide exclusionary data, they are difficult to apply systematically. Genome-wide linkage disequilibrium or haplotype maps, when available, should help to address this problem (14,15,16,17). Ultimately, regardless of the approach taken, genetic information alone will not identify susceptibility genes in a complex disorder such as type 1 diabetes. Biologic studies will usually be required to demonstrate that a given allele or group of alleles has an effect on the function of a gene or its product and that the gene or its product plays a role in the pathogenesis of type 1 diabetes.
implicate genes within a much narrower physical region, because linkage disequilibrium typically does not extend over large physical distances unless the study population is inbred and/or has passed through a population bottleneck in recent history (13). However, this means that most candidate markers or genes tested for association will return nonpositive results. Because association studies do not provide exclusionary data, they are difficult to apply systematically. Genome-wide linkage disequilibrium or haplotype maps, when available, should help to address this problem (14,15,16,17). Ultimately, regardless of the approach taken, genetic information alone will not identify susceptibility genes in a complex disorder such as type 1 diabetes. Biologic studies will usually be required to demonstrate that a given allele or group of alleles has an effect on the function of a gene or its product and that the gene or its product plays a role in the pathogenesis of type 1 diabetes.
THE SEARCH FOR TYPE 1 DIABETES SUSCEPTIBILITY GENES
A relatively large number of chromosomal regions have been implicated as harboring susceptibility genes for type 1 diabetes on the basis of results from genetic linkage or association studies. Two, the HLA and insulin gene regions, are generally accepted and have been designated IDDM1 and IDDM2, respectively. Both IDDM1 and IDDM2 were initially identified by association testing in a case-control format (18,19) and subsequently confirmed by linkage studies and further family-based association testing (20,21,22,23). A comparison of observed-to-expected allele sharing in ASPs for markers within the HLA region suggests that a substantial fraction (on the order of 50%) of the familial risk for type 1 diabetes is contributed by the inheritance of genes within this region (24). The contribution of the insulin gene region is substantially less and is estimated to account for only 8% to 10% of the familial risk for type 1 diabetes (20). Additional putative type 1 diabetes susceptibility loci designated IDDM3 to IDDM15 and IDDM18 have been defined on the basis of increased allele sharing in ASPs or from evidence of genetic association obtained by TDT analyses in similar collections of families. The IDDM17 locus was defined on the basis of linkage studies in a single large pedigree (25). Finally, several additional chromosomal regions, Xp13–p11, 16q22–24, and 1q42, are reported to show suggestive to significant evidence of linkage to type 1 diabetes in genome scans but have not been assigned “IDDM” designations (26,27,28).
Five genome-wide scans for linkage to type 1 diabetes in ASPs have been reported. The studies of Davies et al. (24) and Hashimoto et al. (29) were the first such scans completed in any genetically complex disorder. Data analysis in these studies was performed by two-point evaluation of allele-sharing data at each marker. Larger subsequent genome scans completed by Mein et al. (26) and Concannon et al. (27) partially overlapped these earlier studies in the families used but used more informative multipoint approaches for assessing the evidence for linkage, as did a completely independent genome scan in Scandinavian families by Nerup et al. (30). The results from these genome-wide scans have been interpreted as suggesting the existence of numerous susceptibility loci for type 1 diabetes in humans. However, for many of these putative loci, the evidence for linkage in the initial reports did not attain a genome-wide significance level. Subsequent follow-up studies have, in some cases, been supportive of initial reports and, in other cases, negative. This inconsistency in the findings of different studies is a significant impediment to efforts to identify the relevant genes that contribute to susceptibility. Because fine mapping of such linked regions cannot proceed by analysis of observed recombination events, the currently accepted method of localizing susceptibility genes in such regions is to methodically test genetic markers spanning the region at high density in the hope of detecting evidence of allelic association with disease. The labor involved in performing such an analysis in even one suspected region is immense, especially because the confidence intervals for such regions are typically quite broad. Obviously, an investigator wants to apply such an approach only in those regions for which the supporting evidence is the strongest. This requires some prioritization of potential target regions based on the evidence for linkage. When independent genome-wide scans report largely nonoverlapping sets of putative linked loci, their utility for prioritizing these sites for further study is limited.
Two approaches to evaluating the significance of findings of linkage in complex diseases such as type 1 diabetes are to carry out either confirmation or extension studies. The first of these approaches, confirmation studies, relies on independent replication to strengthen the evidence for linkage. Since even when there is no linked disease susceptibility locus, a statistically significant finding will occur with a frequency of 5%, confirmation studies can play an important role by testing the reproducibility of such findings. Unlike the initial report of linkage, it may not be necessary to hold a confirmation study to the same level of statistical significance. Simulations indicate that to have sufficient power to attain replication at a genome-wide level of significance, a confirmation study might have to use impracticably large sample sizes (31). Therefore, a more appropriate standard may be to require a locus-specific significance level for a replication (p =0.01). When an initial finding is only suggestive of linkage, then the second approach, extension studies, in which data from all studies are merged and jointly analyzed, is more appropriate until such a locus attains a genome-wide significance level (4).
Both confirmation and extension studies involve the joint analysis of data from multiple sources. A difficulty with both approaches is the challenge of making the analyses as inclusive as possible. Published data will tend to be selected for positive results. There is always a danger that negative results that might substantially affect the outcome of such analyses may not be incorporated simply because they are not reported. For extension studies, the ideal approach is to pool the raw data and carry out a single analysis. In the case of two-point analyses of allele sharing, it is possible to add reported results from different studies together in an extension study. In general, the same practice cannot be used with multipoint LOD scores except in the rare event that the independent studies that are to be merged all used the same markers, genetic maps, and methods for analysis. While two-point analyses of linkage data at specific markers allow relatively easy pooling across studies, multipoint analysis methods can extract substantially greater linkage information from a comparable collection of families. Therefore, caution is appropriate in considering significance levels reported from extension or replication studies that exclude data obtained by one method or the other.
The following sections summarize the evidence supporting the existence of reported “IDDM” loci in humans as well as some additional regions implicated by linkage studies but lacking such official designations. It is important to keep in mind that although these regions have been given locus designations, which may include the name of the most “interesting” candidate gene, in most cases what is being discussed is not a specific locus but a large chromosomal region that may contain hundreds of genes, any one or combination of which might contribute to disease susceptibility. The cytogenetic localizations provided for each of these regions are, therefore, just estimates
and are taken from the relevant publications reporting the putative loci.
and are taken from the relevant publications reporting the putative loci.
IDDM1 (6p21.3)
Identification of HLA Associations with Type 1 Diabetes
The first evidence of allelic association between the HLA complex and type 1 diabetes was reported for the HLA-B15 allele and was based on serology (32). In subsequent studies, a positive association of type 1 diabetes with HLA-B8 and a negative association with B7 were established (33,34). Higher risks were shown to be associated with HLA class II specificities, namely DR3 and DR4, whereas DR2 (now renamed DR15) was suggested to be involved in protection (35). DR3 is in linkage dis-equilibrium with B8, and DR4 is in disequilibrium with B15. More than 90% of white patients with type 1 diabetes have DR3 and/or DR4 as compared with 40% to 50% of controls (35). The greatest risk of type 1 diabetes is conferred by the simultaneous presence of DR3 and DR4, which are found together in 30% to 50% of patients (36,37) but in only 1% to 6% of controls. These associations with HLA antigens were defined initially by serologic or cellular typing methods. Restriction fragment length polymorphism (RFLP), allele-specific oligonucleotide typing, and direct nucleotide sequencing subsequently enabled the specific identification of genes associated with risk for type 1 diabetes. These molecular studies indicated that the primary susceptibility genes are situated in the HLA-DQ rather than the DR region (a schematic map of the HLA gene region is shown in Fig. 21.1). In most populations studied, the HLA alleles most strongly associated with type 1 diabetes are DQB1*0302 and/or DQB1*0201, which are in linkage disequilibrium with DRB1*0401 and DRB1*0301, respectively. (By convention, HLA alleles are named with a four-character alphanumeric code indicating the locus, followed by an asterisk and a four-digit number indicating the specific allele at that locus. For example DQB1*0302 refers to a specific polymorphic allele, 0302, at the DQB1 locus that encodes the β chain of the heterodimeric HLA-DQ molecule.)
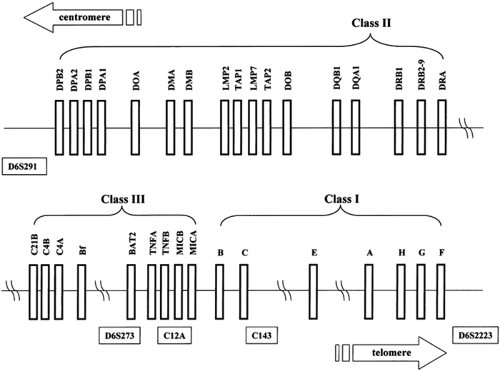 Figure 21.1. A map of the HLA region. The HLA region covers ∼3,500 kilobase of chromosome 6p21.3. The HLA genes are divided into three groups. HLA class II genes encode α- and β-chains of the class II antigen-presenting molecules. HLA class I genes encode the α-polypeptide chain of the class I molecules, while the β-chain is encoded on chromosome 15 by the β-microglobulin gene. The genes in the HLA class III region encode complement proteins, some cytokines, and additional enzymes. The genes in the HLA class I and II regions are highly polymorphic, with the exception of DRBA, which is nonpolymorphic. Alleles of the genes are indicated by a four-digit number followed by an asterisk. The map shows only selected HLA genes among the ∼150 genes mapped to the region. The distances between the loci are approximate. Microsatellite markers are shown as framed. |
HLA-DQ and HLA-DR as Predisposing Alleles for Type 1 Diabetes
Although numerous studies have emphasized the primary role of HLA-DQ in predisposition to type 1 diabetes (36,38), the involvement of HLA-DR loci cannot be excluded (39,40,41,42,43,44,45,46,47,48,49,50,51,52). The DR4-DQA1*0301-DQB1*0302 haplotype is associated with susceptibility
to type 1 diabetes in most populations studied (36,41,42,43), but certain DR4 haplotypes are more prevalent among patients as compared with controls, suggesting a role for both DR and DQ molecules in the pathogenic process. Likewise, studies in the nonobese diabetic (NOD) mouse, a rodent model of type 1 diabetes, suggest that more than one gene in the major histocompatibility complex (the mouse equivalent of HLA) contributes to diabetes susceptibility (see Chapter 18 for detailed discussion of the NOD mouse model). DRB1*0401, 0402, and 0405 are positively associated with type 1 diabetes, whereas DRB1*0403 is not, even though these alleles all occur on haplotypes in conjunction with DQB1*0302 (39,40,41,42,44,45,46,47). In Scandinavian populations, the DRB1*0404-DQB1*0302 haplotype is decreased in frequency among patients (48,49,50). In the Oriental populations, the DRB1*0406-DQA1*0301-DQB1*0302 haplotype is negatively associated with type 1 diabetes (42,51,52,53,54). The role of all DR4 haplotypes cannot be jointly evaluated in a single population because the frequency of DR4 subtypes varies considerably in different ethnic groups and some haplotypes are very rare. For example, in Scandinavia, almost all DR4 haplotypes carry the DRB1*0401 or 0404 alleles, while DRB1*0406 is observed at high frequency only in the Oriental populations. Nevertheless, based on transracial association data, the DRB1*04 alleles can be ranked in the following order with respect to risk of type 1 diabetes: DRB1*0405=0402=401>404>403 0406 (48).
to type 1 diabetes in most populations studied (36,41,42,43), but certain DR4 haplotypes are more prevalent among patients as compared with controls, suggesting a role for both DR and DQ molecules in the pathogenic process. Likewise, studies in the nonobese diabetic (NOD) mouse, a rodent model of type 1 diabetes, suggest that more than one gene in the major histocompatibility complex (the mouse equivalent of HLA) contributes to diabetes susceptibility (see Chapter 18 for detailed discussion of the NOD mouse model). DRB1*0401, 0402, and 0405 are positively associated with type 1 diabetes, whereas DRB1*0403 is not, even though these alleles all occur on haplotypes in conjunction with DQB1*0302 (39,40,41,42,44,45,46,47). In Scandinavian populations, the DRB1*0404-DQB1*0302 haplotype is decreased in frequency among patients (48,49,50). In the Oriental populations, the DRB1*0406-DQA1*0301-DQB1*0302 haplotype is negatively associated with type 1 diabetes (42,51,52,53,54). The role of all DR4 haplotypes cannot be jointly evaluated in a single population because the frequency of DR4 subtypes varies considerably in different ethnic groups and some haplotypes are very rare. For example, in Scandinavia, almost all DR4 haplotypes carry the DRB1*0401 or 0404 alleles, while DRB1*0406 is observed at high frequency only in the Oriental populations. Nevertheless, based on transracial association data, the DRB1*04 alleles can be ranked in the following order with respect to risk of type 1 diabetes: DRB1*0405=0402=401>404>403 0406 (48).
HLA-Encoded Protection
The DRB1*1501-DQA1*0102-DQB1*0602 haplotype is negatively associated with type 1 diabetes across multiple ethnic groups, whereas the DRB1*1301-DQA1*0103-DQB1*0603 haplotype is associated with reduced susceptibility (41,42,55). DQB1*0602 and 0603 differ only at amino acid position 30, whereas DQA1*0102 and DQA1*0103 differ only at amino acid positions 25 and 41 (56). The apparent protection from type 1 diabetes conferred by DQB1*0602 and 0603 appears to be dominant in nature (38,57,58,59). No patient with type 1 diabetes homozygous for DQB1*0602 or 0603 has been described so far. However, the protection conferred by these DQ alleles is not absolute, as patients positive for DQB1*0602 allele have been described (60,61,62,63). In these patients, the other DQB1 allele is typically one that is associated with high risk of disease. Another DQB1 allele that is also reduced in frequency among patients with type 1 diabetes in some populations is DQB1*0301 (36), although the protection observed with this allele is neither as global nor as significant as with DQB1*0602 and 0603. The negative association with DQB1*0301 is most prominent when it is present on DRB1*1101 haplotypes. However, it is also seen with those DR*04 haplotypes that confer susceptibility, suggesting that one protective DQ allele on a haplotype can neutralize any predisposing effect (46,47).
HLA Associations with Type 1 Diabetes in Different Ethnic Populations
The frequencies of HLA alleles and their haplotypic combinations differ greatly across various ethnic groups (41,64). There is also variance in the haplotypes associated with type 1 diabetes. For example, the DRB1*0405-DQA1*0301-DQB1*0302, DRB1* 0405-DQA1*0301-DQB1*0401, and DRB1*0802-DQA1*0301-DQB1*0302 haplotypes are positively associated with type 1 diabetes in the Japanese population, whereas DRB1*0406-DQA1*0301-DQB1*0302 has a negative association (42,51,54). DR9 is positively associated with type 1 diabetes both in the Oriental populations and in populations of African descent, but these haplotypes differ in their DQB1 loci (42,53,65). In Orientals, DR9 haplotypes carry DQA1*0301-DQB1*0303 (as in white populations), whereas in Africans, DR9 is linked with DQA1 *301-DQB1*0201. DR7 is increased only in patients of African descent with type 1 diabetes (66). This particular haplotype carries the DQA1*0301 allele, which is positively associated with disease, whereas DR7 in whites is in linkage disequilibrium with the disease-neutral DQA1*0201 allele.
The strength of DRB1*0301 as a risk allele varies among populations; DR3-associated susceptibility is stronger in southern as compared with northern Europeans. In the latter group, DRB1*0301-DQB1*0201 haplotypes alone do not confer an increased risk for type 1 diabetes, and no excess of homozygotes for this haplotype is observed among patients (67). However, in Sardinia, the major susceptibility haplotype is DRB1*0301-DQA1*0501-DQB1*0201, and homozygosity for this haplotype is significantly increased among patients (68). In the Japanese population, the DRB1*0301-DQB1*0201 haplotype is rare (42,69). In the Chinese population, DR3/9 heterozygosity is strongly associated with type 1 diabetes (70,71). This is most likely due to the low frequency of risk-associated DR4 subtypes in this population. These differences in HLA haplotype frequencies in the general population may help explain the low disease incidence in these ethnic groups.
Synergistic Effects on Risk Associated with Heterozygous Combinations of HLA Alleles
The greatest HLA-encoded risk of type 1 diabetes is conferred by the simultaneous presence of DQA1*0301-DQB1*0302 and DQA1*0501-DQB1*0201 (40,67). This combination of haplotypes is found in ∼40% of the patients, whereas the frequency in healthy controls is only 3%. The increased risk associated with heterozygosity for these two haplotypes is inconsistent with a simple additive effect. One proposed explanation is that this genotypic combination might facilitate the formation of heterodimers between the α- and β-chains that are encoded by alleles present on different parental chromosomes in trans (72,73,74). Because both the α- and β-chains of DQ molecules display allelic polymorphism, potentially four distinct DQ molecules can be formed in a heterozygous individual. While it has been demonstrated that these trans -dimers can be formed and are very stable, no T cells restricted by these molecules have been isolated from DQB1*0302/0201 heterozygous individuals with type 1 diabetes (75,76). The heterodimers encoded in trans in heterozygous individuals are DQA1*0301-DQB1*0201 and DQA1*0501-DQB1*0302. The former is encoded in cis on DR7 and DR9 haplotypes that are common among patients of African descent with type 1 diabetes (55,77). A second possible explanation for the increased risk associated with DQB1*0302/0201 heterozygosity is that it reflects the effects of additional genes beyond DQ. These might be other HLA class II genes known to have an effect on susceptibility, such as DR or DP, or even genes within the HLA complex that do not encode antigen-presenting molecules. As discussed below, such effects often are attributed to the HLA-DR3 haplotype that is associated with many different autoimmune disorders beyond type 1 diabetes.
Related posts:
 Genetic Regulation of Islet Function
Magnetic Resonance Spectroscopy Studies of Liver and Muscle Glycogen Metabolism in Humans
Epidemiology of Diabetes Mellitus
Diabetes in Minorities in the United States
Behavioral Research and Psychological Issues in Diabetes: Progress and Prospects
Pancreas and Islet Transplantation
Genetic Regulation of Islet Function
Magnetic Resonance Spectroscopy Studies of Liver and Muscle Glycogen Metabolism in Humans
Epidemiology of Diabetes Mellitus
Diabetes in Minorities in the United States
Behavioral Research and Psychological Issues in Diabetes: Progress and Prospects
Pancreas and Islet Transplantation
Stay updated, free articles. Join our Telegram channel

Full access? Get Clinical Tree


