, Joong Mo Ahn2 and Yusuhn Kang2
(1)
Department of Radiology, Seoul National University College of Medicine, Seoul National University Bundang Hospital, Seongnam, South Korea
(2)
Department of Radiology, Seoul National University, Bundang Hospital, Seongnam, South Korea
10.1 Intramedullary Sclerotic Bone Lesions
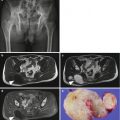
Intramedullary sclerotic tumor and tumor-like bone lesions include, but are not limited to, bone islands (Fig. 10.1), bone infarction (Fig. 10.2), enchondroma, conventional osteosarcoma (Fig. 10.3), osteoblastic metastasis, mastocytosis (Fig. 10.4), and POEMS (polyneuropathy, organomegaly, endocrinopathy, monoclonal gammopathy, and skin changes) syndrome (Fig. 10.5).
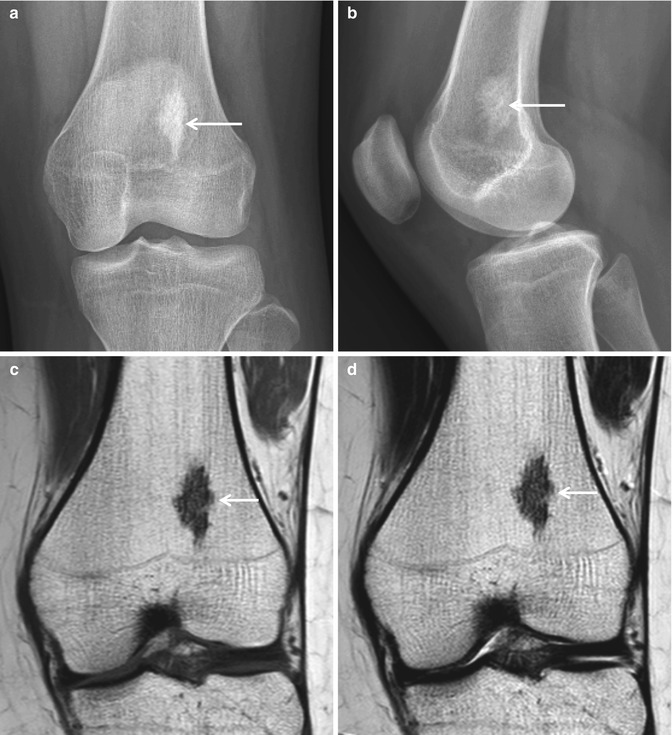
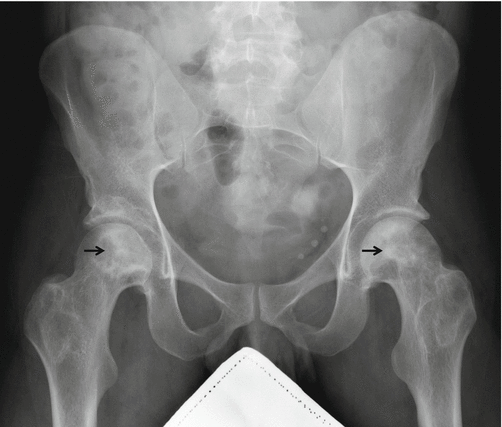
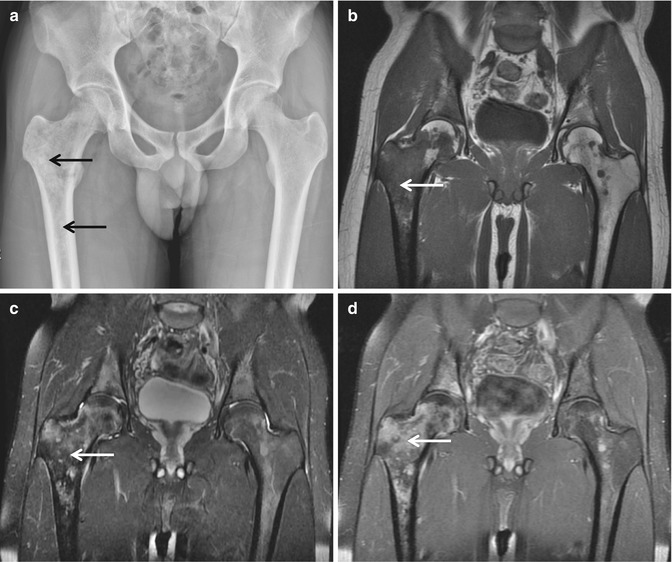
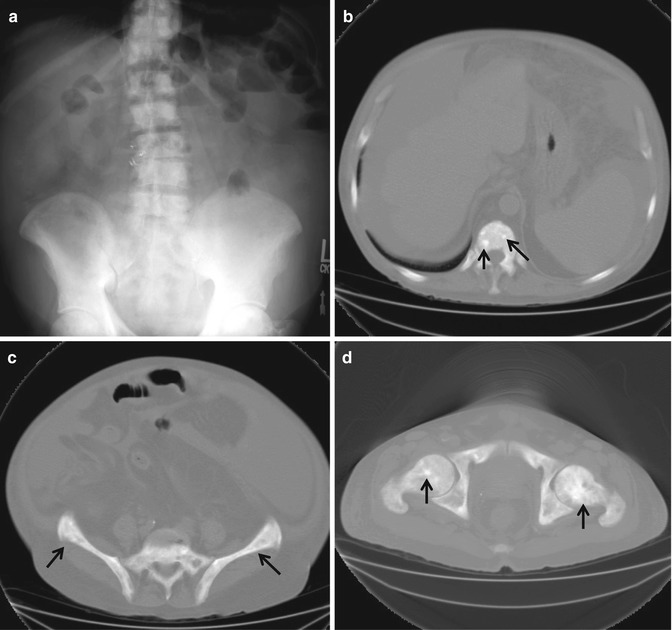
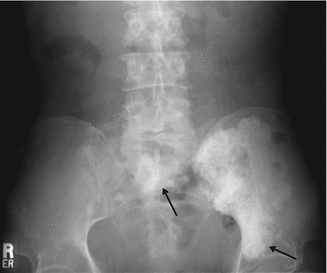

Fig. 10.1
Bone island. (a) Anteroposterior radiograph of the left femur shows a densely sclerotic intramedullary focus with thorny margin (arrow). The long axis of this focus is paralleling the long axis of the affected bone. (b) Lateral radiograph again shows a densely sclerotic focus with thorny margin (arrow). (c) Coronal T1-weighted MR image shows low signal intensity (arrow). (d) Coronal T2-weighted MR image again reveals low signal intensity (arrow)

Fig. 10.2
Bone infarction. Anteroposterior radiograph of the pelvis shows multiple sclerotic lesions with peripheral sclerosis (arrows) in the bilateral proximal femurs and bony pelvis

Fig. 10.3
Osteosarcoma. (a) Anteroposterior radiograph of the pelvis shows multiple sclerotic lesions in the right proximal femur (arrows). (b) Coronal T1-weighted MR image shows intramedullary low signal intensity (arrow). (c) Coronal fat-suppressed T2-weighted MR image shows intramedullary low-to-high signal intensity (arrow). (d) Coronal fat-suppressed contrast-enhanced T1-weighted MR image demonstrates heterogeneous enhancement (arrow)

Fig. 10.4
Mastocytosis. (a) Anteroposterior radiograph of the abdomen shows multiple sclerotic lesions in the bony pelvis as well as the spinal column. (b–d) Axial CT scans show sclerotic foci in the vertebral body, bony pelvis, and bilateral femurs (arrows)

Fig. 10.5
POEMS syndrome (polyneuropathy, organomegaly, endocrinopathy, monoclonal gammopathy, and skin changes). Anteroposterior radiograph of the pelvis shows multiple sclerotic lesions in the left hemipelvis and sacrum (arrows)
Bone islands appear as homogeneously sclerotic foci with spiculation. Bone infarction can be characterized with peripheral sclerosis. Enchondroma contains central chondroid matrix. Conventional osteosarcoma appears as aggressive lesion with amorphous osteoid matrix and soft tissue mass. Osteoblastic metastasis may be radiographically indistinguishable from bone islands, and may show enhancement on the postcontrast MR images. Mastocytosis may appear as multiple scattered sclerotic foci involving the axial skeleton and long bones, similar to metastatic disease, and clinical manifestation of skin rash, episodic vomiting, and diarrhea could be diagnostic hints. POEMS syndrome shows as homogeneously sclerotic lesion, and clinical clues are polyneuropathy, organomegaly, endocrinopathy, monoclonal gammopathy, and skin changes.
10.2 Bone-Forming Surface Lesions
Osteoid osteoma is most commonly localized within the cortex of the bone, and is surrounded by thick sclerotic reactive bone. Osteoblastoma is most commonly located within the cancellous bone and characteristically does not demonstrate extensive reactive bone formation. Occasionally, osteoid osteoma and osteoblastoma may occur on the surface of the bone. The two conditions may overlap and may be described as either osteoid osteoma or osteoblastoma.
Parosteal osteoma has been used to describe a benign compact bone-forming lesion arising from the periosteum, and appears as a well-circumscribed dense, rounded, or lobulated mass with no associated soft tissue masses on radiographs. Parosteal osteomas have intensely homogeneous sclerotic appearance.
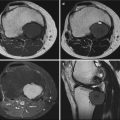
In contrast, parosteal osteosarcoma (Fig. 10.6) may show a zone of decreased density at the periphery and usually appears less dense and homogeneous than parosteal osteoma. However, radiographically, parosteal osteoma and parosteal osteosarcoma may have indistinguishable features.
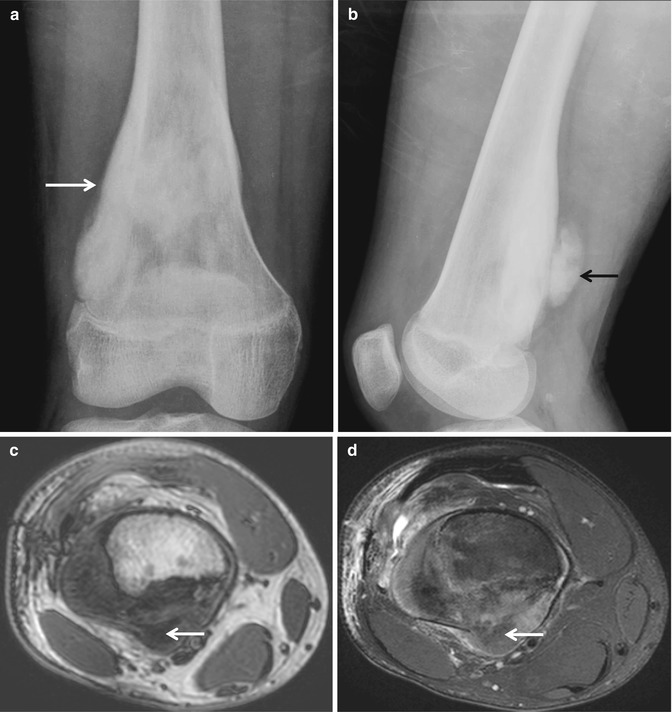

Fig. 10.6
Parosteal osteosarcoma. (a) Anteroposterior radiograph of the right knee shows a juxtacortical ossific mass (arrow) in the right distal femur. (b) Lateral radiograph shows a juxtacortical ossific mass (arrow), which is separated by a radiolucent cleavage plane from the remaining cortical bone. (c) Axial T1-weighted MR image shows a lobulated and exophytic juxtacortical mass with heterogeneous signal intensity (arrow). (d) Axial T2-weighted fat-suppressed MR image demonstrates slightly increased signal intensity in the juxtacortical ossific mass (arrow)
Periosteal osteosarcoma is fusiform and firmly attached to the surface of the bone without a cleavage line. Periosteal osteosarcoma may erode and permeate the outer cortex. The lesion is covered by periosteum and demonstrates spiculated perpendicular periosteal reaction.
High-grade surface osteosarcoma usually arises on the surface of the bone along the midshaft and usually does not invade the medullary cavity.
10.3 Geographical Osteolytic Lesion, Sclerotic Border, No Intralesional Matrix
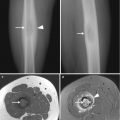
Lesions described as geographical show comparatively slow rates of growth and are typically less aggressive. These lesions may be subcategorized based on the radiographic appearance of their margins. Geographical osteolytic lesions with a sclerotic border show the slowest rate of growth and are generally considered benign. The slow rate of growth allows time for osteoblasts to form the reactive sclerotic rim that defines this category of lesions. Geographical osteolytic lesions with a sclerotic border and no intralesional matrix include subchondral cyst (Fig. 10.7), nonossifying fibroma, simple bone cyst (Fig. 10.8), Brodie abscess, intraosseous ganglion, intraosseous lipoma, and liposclerosing myxofibrous tumor (Fig. 10.9).
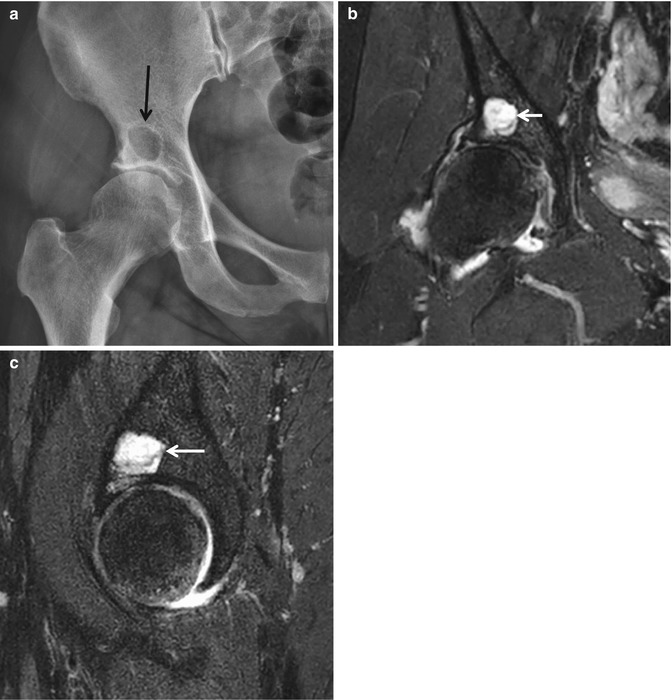
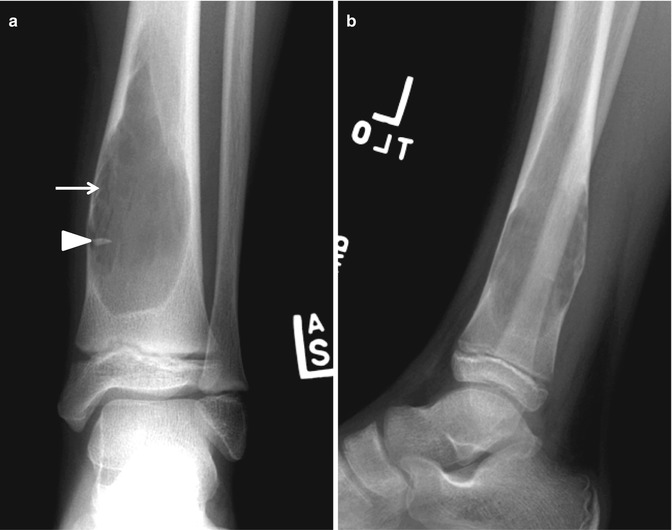
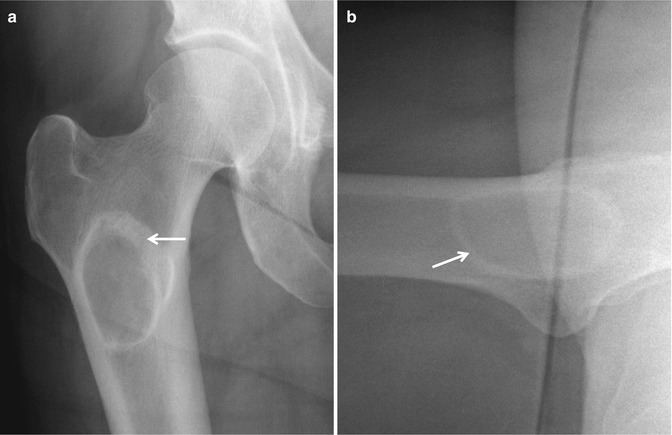

Fig. 10.7
Subchondral cyst. (a) Anteroposterior radiograph of the pelvis shows a well-defined radiolucent lesion (arrow) in the right supra-acetabular region. (b) Coronal fat-suppressed proton density-weighted MR image shows a periarticular cystic lesion (arrow). (c) Sagittal fat-suppressed proton density-weighted MR image again demonstrates a periarticular cystic lesion (arrow)

Fig. 10.8
Simple bone cyst. (a) Anteroposterior radiograph of the left lower leg shows a well-defined geographical osteolytic lesion (arrow) with a thin sclerotic rim and fallen fragment sign (arrowhead). (b) Lateral radiograph again shows a well-defined geographical osteolytic lesion with no matrix calcification

Fig. 10.9
Liposclerosing myxofibrous tumor. (a) anteroposterior and (b) translateral radiographs of the right hip show a well-defined geographic osteolytic lesion (arrow) with thick sclerotic rim. No mineralized matrix is noted within the lesion
10.4 Geographical, Osteolytic Lesion, No Sclerotic Border, No Intralesional Matrix
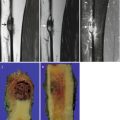
Trabeculae in normal unaffected bone may be seen extending to the edge of the lytic lesion, and the tumor cells rarely extend beyond this margin. Accordingly, these lesions are best detected in areas of cancellous bone because of the contrast provided by the adjacent trabeculae. If these lesions occur in the diaphysis, where the relative proportion of cancellous bone is lower, they may go undetected or show only endosteal scalloping. Examples of the geographical, osteolytic lesion with no sclerotic border and no intralesional matrix include benign lesion such as giant cell tumor (Fig. 10.10), Langerhans cell histiocytosis (Fig. 10.11), and fibrous dysplasia. However, the punched-out lesions of multiple myeloma (Fig. 10.12) and low-grade sarcoma may show similar appearance. Therefore, consideration of the patient’s age and clinical presentation can help guide the differential diagnosis.
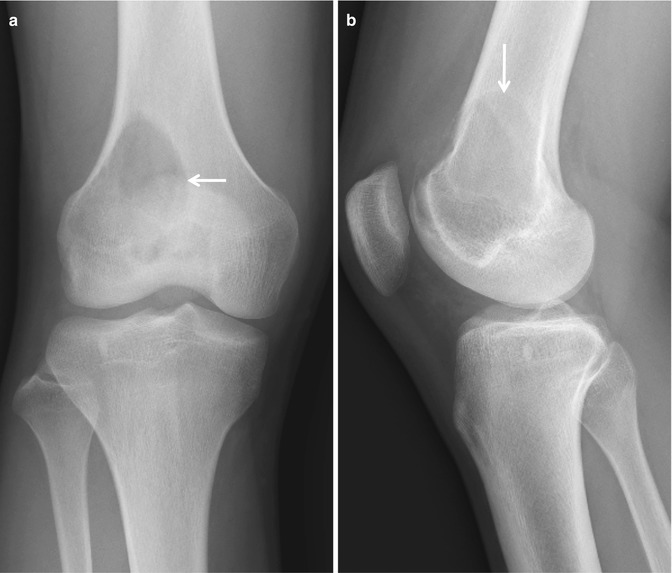

Fig. 10.10


Giant cell tumor. (a) Anteroposterior radiograph of the right knee shows an eccentric osteolytic lesion with a nonsclerotic well-defined border (arrow) at the metaepiphysis of the right distal femur. (b) Lateral radiograph demonstrates eccentric osteolytic lesion (arrow) with no periosteal reaction at the metaepiphysis of the right distal femur. No matrix mineralization is seen within the lesion
Stay updated, free articles. Join our Telegram channel

Full access? Get Clinical Tree


