, Joong Mo Ahn2 and Yusuhn Kang2
(1)
Department of Radiology, Seoul National University College of Medicine, Seoul National University Bundang Hospital, Seongnam, South Korea
(2)
Department of Radiology, Seoul National University, Bundang Hospital, Seongnam, South Korea
11.1.1 Fat-Containing Lesions
11.1.2 T2 Hypointense Tumor Matrix
11.1.3 Fluid–Fluid Levels
11.1.4 Flow Voids
11.2 Ancillary Findings
11.2.1 Soft Tissue Extension
11.2.2 Peritumoral Edema
11.1 Intralesional Feature
11.1.1 Fat-Containing Lesions
Imaging features of benign lipomatous lesions are often pathognomonic. Radiographs frequently reveal tissue with either diffuse or focal areas that are similar or identical to subcutaneous fat. These intrinsic features and lesion extent are best depicted with either CT or MR imaging.
Most bone lesions containing hyperintense fat signal on T1-weighted images are benign and include intraosseous lipoma (Fig. 11.1), hemangioma, parosteal lipoma, liposclerosing myxofibrous tumor, and nontumorous conditions such as medullary infarction.
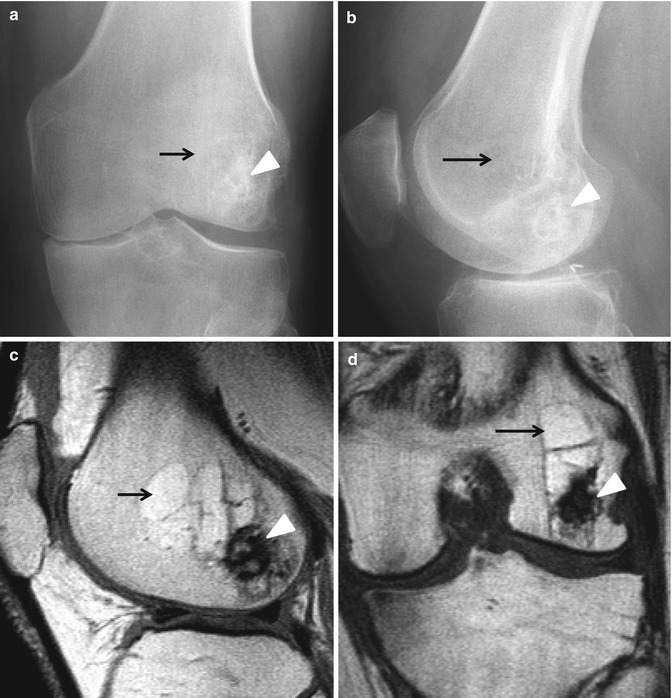

Fig. 11.1
Intraosseous lipoma. (a) Anteroposterior radiograph of the left knee shows an intramedullary radiolucent lesion (arrow) with thin sclerotic rim and foci of calcification (arrowhead) within the lesion. (b) Lateral radiograph again shows an intramedullary radiolucent lesion (arrow) with thin sclerotic rim and foci of calcification (arrowhead) within the lesion. (c) Sagittal proton density-weighted MR image demonstrates an intramedullary lesion (arrow) following the signal intensity of the fat, and foci of low signal intensity indicating calcification or ossification (arrowhead). (d) Coronal proton density-weighted MR image demonstrates an intraosseous adipose lesion (arrow) with foci of low signal intensity indicating calcification or ossification (arrowhead)
The presence of focal normal fatty marrow or fat within a bone tumor is highly suggestive of a benign etiology. Osteosarcoma arising within a medullary infarct may have fat from the infarct and not within the osteosarcoma itself. Dedifferentiated chondrosarcoma or Paget sarcoma can show fat in the nonmalignant portion of the lesion.
11.1.2 T2 Hypointense Tumor Matrix
The signal characteristics seen on MR imaging relate to the properties of the intralesional tissue. A majority of bone tumors are nonspecific, being isointense to skeletal muscle on T1-weighted images and of intermediate or increased signal intensity of T2-weighted images, as most bone tumors and tumor-like lesions have a significant chondroid or liquid component. However, there are primary lesions that can show partial or entire T2 hypointensity secondary to an immature chondroid matrix, hemosiderin, and calcification. This feature can be used for making the specific diagnosis.
A bone island is of low signal intensity on all pulse sequences.
Nonossifying fibroma is a cortical based lesion, which most commonly has low signal intensity on T1- and T2-weighted images related to its fibrous content. Signal intensity varies depending on the amount of hypercellular fibrous tissue, hemosiderin, and healing process.
Similarly, desmoplastic fibroma (Fig. 11.2) may demonstrate low-to-intermediate signal intensity on T2-weighted images secondary to T2 shortening of a nonsclerotic fibro-osseous lesion.
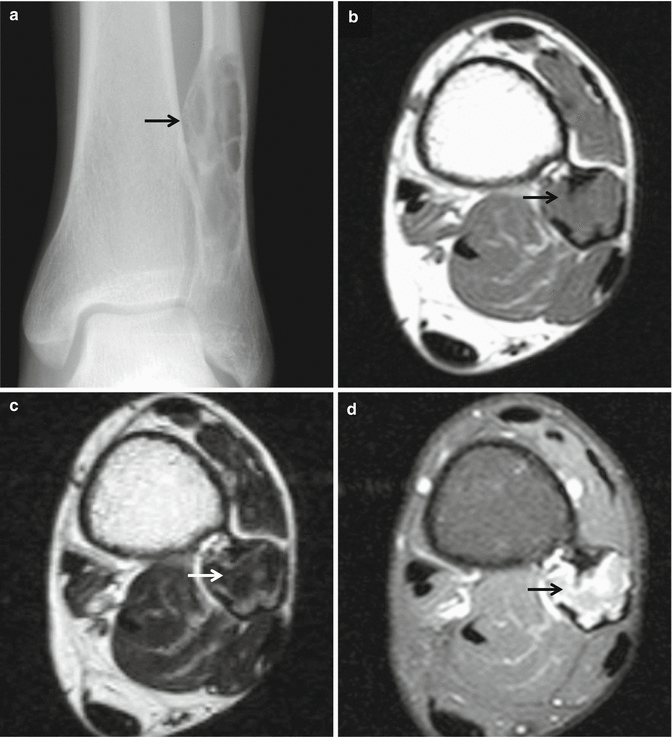

Fig. 11.2
Desmoplastic fibroma. (a) Anteroposterior radiograph of the left ankle shows a well-defined expansile osteolytic lesion (arrow) with a sclerotic border in the metadiaphysis of the left distal fibula. The internal trabeculation or ridges within the lesion give a soap-bubble appearance. (b) Axial T1-weighted MR image demonstrates diffuse intermediate signal intensity of the lesion (arrow). (c) Axial T2-weighted MR image demonstrates heterogeneous low-to-intermediate signal intensity of the lesion (arrow). The signal intensity of desmoplastic fibroma is attributable to its collagen content. (d) Axial fat-suppressed contrast-enhanced T1-weighted MR image demonstrates diffuse enhancement (arrow)
Giant cell tumor (Fig. 11.3) demonstrates peripheral low signal intensity on T1-weighted images and generalized hypointensity on T2-weighted images related to hemosiderin deposition from recurrent hemorrhage.
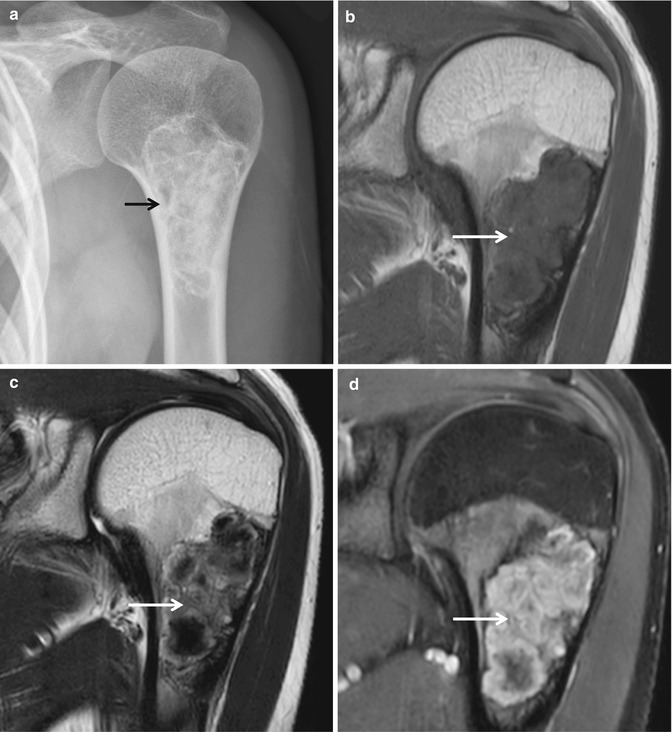

Fig. 11.3
Giant cell tumor. (a) Anteroposterior radiograph of the left shoulder shows a well-defined osteolytic lesion (arrow) with a sclerotic border in the metadiaphysis of the left proximal humerus. The internal ridges within the lesion give a soap-bubble appearance. (b) Coronal T1-weighted MR image demonstrates heterogeneous low-to-intermediate signal intensity of the lesion (arrow). (c) Coronal T2-weighted MR image demonstrates heterogeneous low-to-high signal intensity of the lesion (arrow). Giant cell tumor may demonstrate hypointensity on T2-weighted images related to hemosiderin deposition from recurrent hemorrhage. (d) Coronal fat-suppressed contrast-enhanced T1-weighted MR image demonstrates heterogeneous enhancement (arrow)
Brown tumor demonstrates low signal intensity on MR images, together with other manifestations of hyperparathyroidism.
11.1.3 Fluid–Fluid Levels
CT or MR imaging may demonstrate a fluid–fluid level within a bone tumor. Fluid–fluid levels become apparent when a fluid collection containing substances of different density is allowed to settle and the plane of imaging is perpendicular to the fluid level. These levels usually represent blood–fluid levels, and typically indicate prior hemorrhage.
Although most commonly seen in aneurysmal bone cyst (Fig. 11.4), this level is relatively nonspecific and can be identified in a variety of lesions including simple bone cyst, fibrous dysplasia, osteoblastoma, chondroblastoma, giant cell tumor, telangiectatic osteosarcoma, conventional osteosarcoma, and undifferentiated pleomorphic sarcoma.
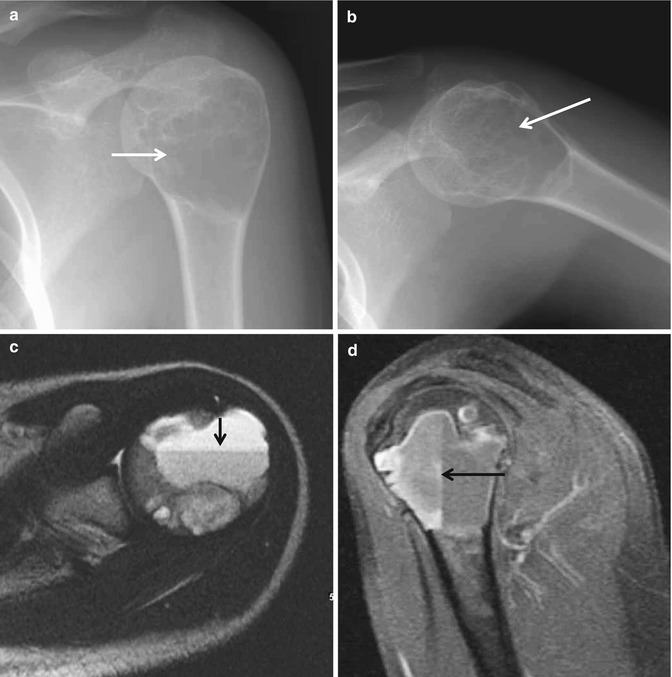

Fig. 11.4
Aneurysmal bone cyst. (a) Anteroposterior radiograph of the left shoulder shows a well-defined osteolytic lesion (arrow) with a sclerotic border in the left proximal humerus. The internal trabeculation within the lesion gives a soap-bubble appearance. (b) Lateral radiograph again shows a well-defined osteolytic lesion (arrow) with a sclerotic border in the left proximal humerus. The internal trabeculation within the lesion gives a soap-bubble appearance. (c) Axial T2-weighted MR image demonstrates a fluid–fluid level (arrow) within the lesion. (d) Sagittal fat-suppressed contrast-enhanced T1-weighted MR image again demonstrates a fluid–fluid level (arrow)
11.1.4 Flow Voids
Flow voids have been demonstrated in vascular tumors such as hemangioma and hemangioendothelioma. A single large osteolytic metastasis may appear as an expansive and trabeculated lesion, which is typically secondary to a hypervascular carcinoma of the kidney (Fig. 11.5) or thyroid. Renal cell and hepatocellular carcinoma metastases are known to exhibit flow voids on MR imaging. Flow voids can therefore be regarded as an additional diagnostic feature.
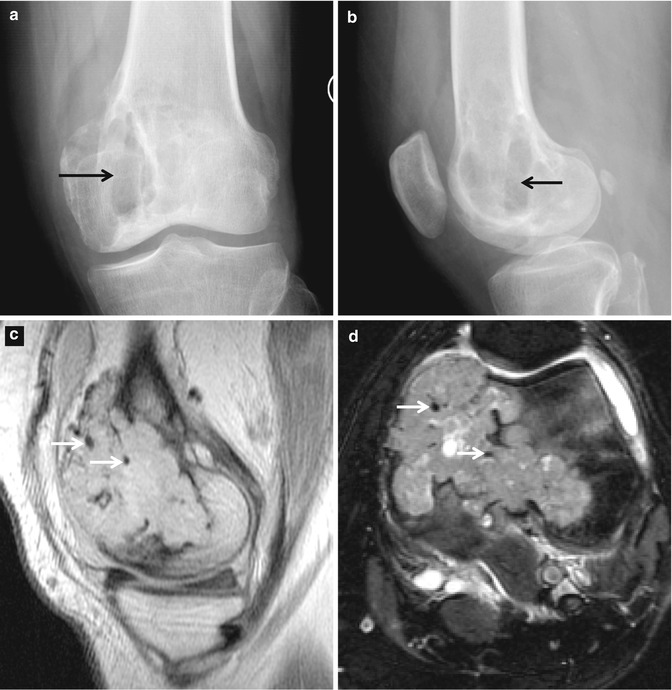

Fig. 11.5
Metastatic renal cell carcinoma. (a) Anteroposterior radiograph of the left knee shows a bubbly osteolytic lesion (arrow) with a sclerotic border and cortical breaching in the medial femoral condyle. (b) Lateral radiograph again shows a bubbly osteolytic lesion (arrow) in the medial femoral condyle. (c) Sagittal proton density-weighted MR image demonstrates an expansile mass with cortical breaching and flow voids (arrows) within the lesion. (d) Axial fat-suppressed T2-weighted MR image demonstrates an expansile mass with cortical breaching and flow voids (arrows) within the lesion
11.2 Ancillary Findings
11.2.1 Soft Tissue Extension
Although MR imaging contributes little additional information on the characterization of a bone tumor when compared with the radiographs in most cases, soft tissue extension should alert the radiologist to the presence of an aggressive lesion likely to be malignant, and further work-up should be initiated.
Stay updated, free articles. Join our Telegram channel

Full access? Get Clinical Tree


