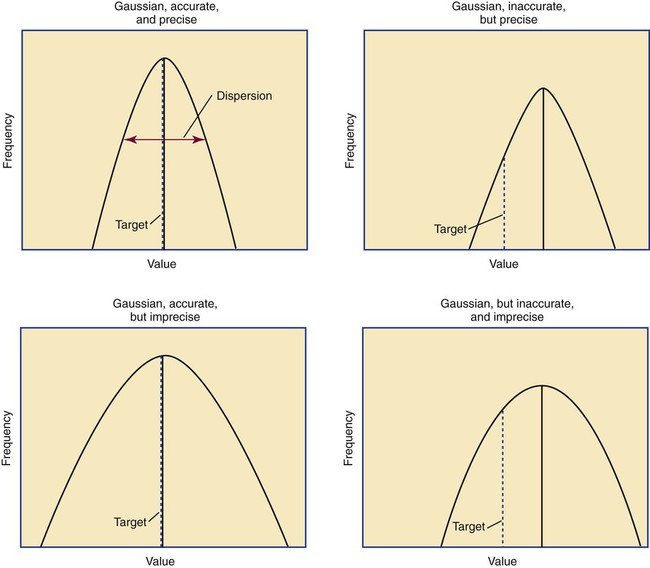
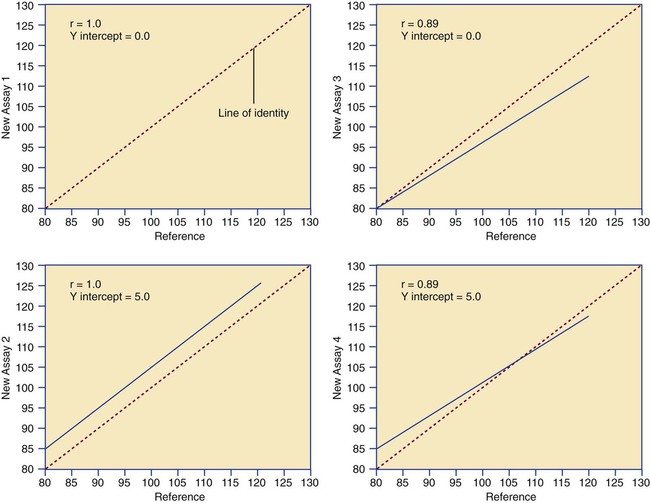
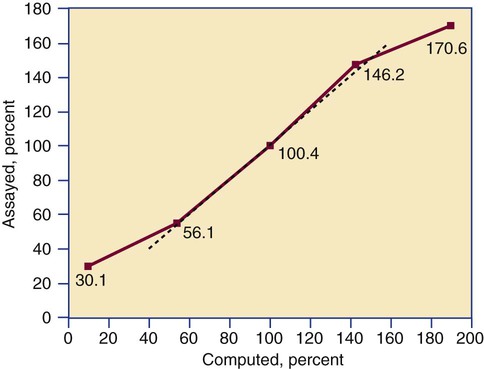
After completion of this chapter, the reader will be able to: 1. Validate and document a new or modified laboratory assay. 2. Define accuracy and calculate accuracy using linear regression to compare to a reference. 3. Compute precision using standard deviation and coefficient of variation. 4. Determine assay linearity using graphical representations and transformations. 5. Discuss analytical limits and analytical specificity. 6. Recount Food and Drug Administration clearance levels for laboratory assays. 7. Compute a reference interval and a therapeutic range for a new or modified assay. 8. Perform internal quality control using controls and moving averages. 9. Participate in periodic external quality assessment. 10. Measure and publish assay clinical efficacy. 11. Compute receiver operating characteristic curves. 12. Periodically assess laboratory staff competence. 13. Provide continuing education programs for laboratory staff. 14. Prepare a quality assurance plan to control for preanalytical and postanalytical variables. 15. List the agencies that regulate hematology and hemostasis quality. 1. What do you call the type of error detected in this case? 2. Can you continue to analyze patient samples as long as you subtract 2 g/dL from the results? 3. What aspect of the assay should you first investigate in troubleshooting this problem? In clinical laboratory science, quality implies the ability to provide accurate, reproducible assay results that offer clinically useful information.1 Because physicians base 70% of their clinical decision making on laboratory results, the results must be reliable. Reliability requires vigilance and effort on the part of all laboratory staff members, and this effort is often directed by an experienced medical laboratory scientist who is a quality assurance and quality control specialist. Of the terms quality control and quality assurance, quality assurance is the broader concept, encompassing preanalytical, analytical, and postanalytical variables (Box 5-1).2 Quality control processes document assay validity, accuracy, and precision, and should include external quality assessment, reference interval preparation and publication, and lot-to-lot validation.3 Preanalytical variables are addressed in Chapter 3, which discusses blood specimen collection, and in Chapter 45, which includes a section on coagulation specimen management. Postanalytical variables are discussed at the end of this chapter. The control of analytical variables begins with laboratory assay validation. All new laboratory assays and all assay modifications require validation.4 Validation is comprised of procedures to determine accuracy, specificity, precision, limits, and linearity.5 The results of these procedures are faithfully recorded and made available to on-site assessors upon request.6 Accuracy is the measure of concurrence or difference between an assay value and the theoretical “true value” of an analyte (Figure 5-1). Some statisticians prefer to define accuracy as the extent of error between the assay result and the true value. Accuracy is easy to define but difficult to establish and maintain. Unfortunately, in hematology and hemostasis, in which the analytes are often cell suspensions or enzymes, there are just a handful of primary standards: cyanmethemoglobin, fibrinogen, factor VIII, protein C, antithrombin, and von Willebrand factor.7 For scores of analytes, the hematology and hemostasis laboratory scientist relies on calibrators. Calibrators for hematology may be preserved human blood cell suspensions, sometimes supplemented with microlatex particles or nucleated avian red blood cells (RBCs) as surrogates for hard-to-preserve human white blood cells (WBCs). In hemostasis, calibrators may be frozen or lyophilized plasma from healthy human donors. For most analytes it is impossible to prepare “weighed-in” standards; instead, calibrators are assayed using reference methods (“gold standards”) at selected independent expert laboratories. For instance, a vendor may prepare a 1000-L lot of preserved human blood cell suspension, assay for the desired analytes in house, and send aliquots to five laboratories that employ well-controlled reference instrumentation and methods. The vendor obtains blood count results from all five, averages the results, compares them to the in-house values, and publishes the averages as the reference calibrator values. The vendor then distributes sealed aliquots to customer laboratories with the calibrator values published in the accompanying package inserts. Vendors often market calibrators in sets of three or five, spanning the range of assay linearity or the range of potential clinical results. where x and y are the variables; a = intercept between the regression line and the y-axis; b = slope of the regression line; n = number of values or elements; X = first score; Y = second score; ΣXY = sum of the product of first and second scores; ΣX = sum of first scores; ΣY = sum of second scores; ΣX2 = sum of squared first scores. Perfect correlation generates a slope of 1 and a y intercept of 0. Local policy establishes limits for slope and y intercept; for example, many laboratory directors reject a slope of less than 0.9 or an intercept of more than 10% above or below zero (Figure 5-2). Unlike determination of accuracy, assessment of precision (dispersion, reproducibility, variation, random error) is a simple validation effort, because it merely requires performing a series of assays on a single sample or lot of reference material.8 Precision studies always assess both within-day and day-to-day variation about the mean and are usually performed on three to five calibration samples, although they may also be performed using a series of patient samples. To calculate within-day precision, the scientist assays a sample at least 20 consecutive times using one reagent batch and one instrument run. For day-to-day precision, at least 10 runs on 10 consecutive days are required. The day-to-day precision study employs the same sample source and instrument but separate aliquots. Day-to-day precision accounts for the effects of different operators, reagents, and environmental conditions such as temperature and barometric pressure. where (Σx) = the sum of the data values and n = the number of data points collected The CV% documents the degree of random error generated by an assay, a function of assay stability. Precision for visual light microscopy leukocyte differential counts on stained blood films is immeasurably broad, particularly for low-frequency eosinophils and basophils.9 Most visual differential counts are performed by reviewing 100 to 200 leukocytes. Although impractical, it would take differential counts of 800 or more leukocytes to improve precision to measurable levels. Automated differential counts generated by profiling instruments, however, provide CV% levels of 5% or lower because these instruments count thousands of cells. Linearity is the ability to generate results proportional to the calculated concentration or activity of the analyte. The laboratory scientist dilutes a high-end calibrator or patient sample to produce at least five dilutions spanning the full range of assay. The dilutions are then assayed. Computed and assayed results for each dilution are paired and plotted on a linear graph, x scale and y scale, respectively. The line is inspected visually for nonlinearity at the highest and lowest dilutions (Figure 5-3). The acceptable range of linearity is established inboard based on the values at which linearity loss is evident. Although formulas exist for computing the limits of linearity, visual inspection is the accepted practice. Nonlinear graphs may be transformed using semilog or log-log graphs when necessary. The U.S. Food and Drug Administration (FDA) categorizes assays as cleared, analyte-specific reagent (ASR) assays, research use only (RUO) assays, and home-brew assays. FDA-cleared assays are approved for the detection of specific analytes and should not be used for off-label applications. Details are given in Table 5-1. TABLE 5-1 Categories of Laboratory Assay Approval Validation is recorded on standard forms. The Clinical Laboratory Standards Institute (CLSI) and David G. Rhoads Associates (http://www.dgrhoads.com/files1/EE5SampleReports.pdf) provide automated electronic forms. Validation records are stored in prominent laboratory locations and made available to laboratory assessors upon request. Laboratory managers reach agreements with vendors to sequester kit and reagent lots, which ensures infrequent lot changes, optimistically no more than once a year. The new reagent lot must arrive approximately a month before the laboratory runs out of the old lot so that lot-to-lot comparisons may be completed and differences resolved, if necessary. The scientist uses control or patient samples and prepares a range of analyte dilutions, typically five, spanning the limits of linearity. If the reagent kits provide controls, these are also included, and all are assayed using the old and new reagent lots. Results are charted as illustrated in Table 5-2. TABLE 5-2 Example of a Lot-to-Lot Comparison
Quality Assurance in Hematology and Hemostasis Testing
Case Study
Validation of a New or Modified Assay
Accuracy
Determination of Accuracy by Regression Analysis


Precision
Linearity
Levels of Laboratory Assay Approval
Assay Category
Comment
Food and Drug Administration cleared
The local institution may use package insert data for linearity and specificity but must establish accuracy and precision.
Analyte-specific reagent
Manufacturer may provide individual reagents but not in kit form, and may not provide package insert validation data. Local institution must perform all validation steps.
Research use only
Local institution must perform all validation steps. Research use only assays are intended for clinical trials, and carriers are not required to pay.
Home brew
Assays devised locally, all validation studies are performed locally.
Documentation and Reliability
Lot-to-Lot Comparisons
Sample
Old Lot Value
New Lot Value
% Difference
Low
7
6
−14%
Low middle
12
12
Middle
20.5
Related posts:
![]()
Stay updated, free articles. Join our Telegram channel

Full access? Get Clinical Tree

 Get Clinical Tree app for offline access