Pharmacology
Manish R. Sharma, MD  Mark J. Ratain, MD
Overview
The biology and clinical indications relevant to systemic anticancer therapies are covered extensively in other chapters in this book. In this chapter, we will focus on the principles of clinical pharmacology as they apply to systemic anticancer therapies and will attempt to illustrate how an understanding of clinical pharmacokinetics and pharmacodynamics can optimize the therapeutic index of these agents. The United States Food and Drug Administration (FDA) conducts a question-based clinical pharmacology and biopharmaceutics review for each approved drug (http://www.fda.gov/downloads/AboutFDA/ReportsManualsForms/StaffPoliciesandProcedures/ucm073007.pdf). Their reviews are publicly available on the FDA website (http://www.accessdata.fda.gov/scripts/cder/drugsatfda/) by searching for the drug name, and often include details that are not included in the product label. We will use their standard questions to introduce the principles of clinical pharmacology and will highlight examples that illustrate these principles.
General attributes of the drug
What are the highlights of the chemistry and physical-chemical properties of the drug substance and the formulation of the drug product as they relate to clinical pharmacology and biopharmaceutics review?
The FDA introduced the biopharmaceutics classification system (BCS) in 2000 (http://www.fda.gov/downloads/Drugs/Guidances/ucm070246.pdf) to establish the criteria that could be used to qualify a new molecular entity for a waiver of in vivo bioequivalence studies. The concept, initially developed by Amidon et al.,1 was that in vivo performance could be predicted from in vitro measurements of permeability and solubility. BCS class 1 drugs (high permeability/high solubility) are eligible for a waiver of in vivo bioequivalence studies. The Biopharmaceutics Drug Disposition Classification System (BDDCS) was subsequently proposed by Wu and Benet2 and based on the hypothesis that high permeability-rate compounds are readily reabsorbed from the potential unchanged excretion routes (urine and bile) and therefore are primarily eliminated through metabolism. Many oral kinase inhibitors that have been developed as anticancer therapies are high permeability/low solubility compounds that are BCS and BDDCS class 2. These drugs are susceptible to food effects on intestinal absorption; drug–drug interactions related to efflux transporters in the gut, uptake/efflux transporters in the liver, or metabolism; and pharmacogenetic variants that impact transporters or metabolism.3
What are the proposed mechanism(s) of action and therapeutic indication(s)?
There are three major types of anticancer therapies: cytotoxics, biologics, and small molecule non-cytotoxics. Classes of each type of therapy, examples of drugs within each class, and their presumed mechanisms of action are shown in Table 1 and covered extensively in other chapters. It is noteworthy that the mechanism of action of a kinase inhibitor may be unclear even after a drug has demonstrated efficacy in a therapeutic indication. For example, regorafenib inhibits multiple tyrosine kinases with relatively high affinity, but the mechanism by which it prolongs survival in chemotherapy-refractory metastatic colorectal cancer (presumed to be related to inhibition of angiogenesis) remains elusive.4
Table 1 Anticancer therapies and their mechanisms of action
| (a) Cytotoxics | ||
| Class of drugs | Example drug(s) | Target/mechanism of action |
| Alkylating agents | Cyclophosphamide | Cross-linking of DNA |
| Platinum agents | Cisplatin, carboplatin, oxaliplatin | Cross-linking of DNA |
| Antibiotics | Doxorubicin | Inhibits topoisomerase II; stabilizes topoisomerase II-DNA complex |
| Antimetabolites | Antifolates: methotrexate Pyrimidine analogs: 5-fluorouracil Purine analogs: 6-mercaptopurine | Interference with the incorporation of nucleotides into DNA |
| Tubulin-binding agents | Taxanes: paclitaxel Vinca alkaloids: vincristine eribulin, ixabepilone | Enhance or inhibit tubulin polymerization |
| Camptothecins | Irinotecan | Stabilizes topoisomerase I DNA to induce DNA strand breaks |
| (b) Biologics | ||
| Class of drugs | Example drug(s) | Target/mechanism of action |
| Monoclonal antibodies | Anti-CD20: rituximab Anti-HER2: trastuzumab Anti-EGFR: cetuximab, panitumumab Anti-PD-1: pembrolizumab, nivolumab Anti-VEGF: bevacizumab | Binding to cell surface receptor or ligand to block signal transduction and enhance antibody-dependent cellular cytotoxicity |
| Antibody-drug conjugates | Trastuzumab emtansine | Binds to HER2 to deliver a tubulin-binding agent to cells |
| Protein-based | Ziv-aflibercept | Binds to VEGF-A, -B, -C |
| Cytokines | IL-2, interferon-alpha | Immune system activation |
| Autologous cellular immunotherapy | Sipuleucel-T | Sensitizes the immune system to prostate cancer antigens |
| (c) Small molecule non-cyotoxics | ||
| Target/mechanism of action | Example drug(s) | |
| EGFR inhibitor | Erlotinib, afatinib | |
| HER2 inhibitor | Lapatinib | |
| ALK inhibitor | Crizotinib, ceritinib | |
| VEGFR2 inhibitor | Sorafenib, sunitinib, pazopanib | |
| BRAF inhibitor | Vemurafenib, dabrafenib | |
| MEK inhibitor | Trametinib | |
| mTOR inhibitor | Everolimus, temsirolimus | |
| BCR-ABL inhibitor | Imatinib, nilotinib | |
| KIT inhibitor | Imatinib, sunitinib, regorafenib | |
| PARP inhibitor | Olaparib | |
| ER antagonist | Tamoxifen, fulvestrant | |
| Aromatase inhibitor | Anastrazole, letrozole, exemestane | |
| AR antagonist | Flutamide, bicalutamide, enzalutamide | |
| CYP17A1 inhibitor | Abiraterone | |
| Proteasome inhibitor | Bortezomib, carfilzomib | |
| Bruton’s tyrosine kinase inhibitor | Ibrutinib | |
This is intended to be an illustrative rather than a comprehensive list.
What are the proposed dosage(s) and route(s) of administration?
Potential routes of administration for cancer therapies are intravenous, oral, intravascular, intracavitary, subcutaneous, or intramuscular. The optimal route of administration depends on a number of factors. By definition, drugs administered by the intravenous route are 100% available in the blood. For oral drugs, the fraction of an administered dose of drug that reaches systemic circulation is referred to as its bioavailability. Alternatively, it is the ratio of the plasma area under the concentration–time curve (AUC) after oral administration to the plasma AUC after intravenous administration of the same dose. Bioavailability is influenced by both absorption and the first-pass effect, which is the reduction in available drug due to metabolism in the gastrointestinal tract and liver before an orally administered dose reaches systemic circulation. Oral drugs are convenient and theoretically should be less expensive, but are plagued by inconsistent bioavailability both within and between patients.5 Factors influencing the bioavailability of oral drugs include adherence, release of the drug from its formulation, stability in the gastrointestinal tract, factors influencing dissolution and rate of absorption (including coadministration with food), metabolism in the intestinal wall or liver before systemic circulation, and concurrent medications (impacting absorption or metabolism).6 Intravascular or intracavitary administration of drugs may be employed to achieve a higher drug concentration in the vicinity of the tumor.7–9 Finally, subcutaneous formulations often deliver comparable exposure to intravenous administration, as demonstrated with trastuzumab in breast cancer.10
General clinical pharmacology
What are the design features of the clinical pharmacology and clinical studies used to support dosing or claims?
The optimal dosing strategy for an anticancer therapy is the one that maximizes efficacy, minimizes severe toxicity, and minimizes pharmacokinetic variability between patients. With few exceptions, cytotoxic therapies are typically dosed by body surface area for historical reasons, even though height and weight are only two of the many variables that influence pharmacokinetic variability.11 Biologics have typically been dosed by weight, while small molecule non-cytotoxics have typically been assigned a fixed dose for all patients. Because it was assumed that a higher dose of a drug would lead to greater efficacy, traditional phase I trials sought to determine the maximum tolerated dose (MTD), defined as the dose immediately below that which caused a prespecified rate of dose-limiting toxicity in a dose-escalation design.12
It is increasingly recognized that the conventional paradigm for dosing of anticancer therapy is suboptimal for two reasons. First, it does not evaluate the sources of interpatient variability in response and/or toxicity, and as such does not facilitate individualized dosing. Second, many biologics and small molecule non-cytotoxics may achieve maximum efficacy at a dose lower than the MTD because of either saturable bioavailability or a saturable effect on the targeted signaling pathway.13, 14 A number of recently approved anticancer therapies have required evaluation of alternative doses in postmarketing trials, whereas the ideal approach would be to conduct randomized dose-comparison studies with pharmacokinetic sampling and exposure-response analyses in the premarketing setting.15
What is the basis for selecting the response endpoints (i.e., clinical or surrogate endpoints) or biomarkers (collectively called pharmacodynamics) and how are they measured in clinical pharmacology and clinical studies?
The conventional response endpoints in trials of anticancer therapy are overall survival (OS), progression-free survival (PFS; defined as time to death or disease progression, whichever comes first), or objective response rate, with response defined as ≥30% reduction in the sum of the longest diameters of target lesions as defined by the response evaluation criteria in solid tumors (RECIST).16 Although there are a number of limitations to RECIST as a method for evaluating drug effect, it remains the most commonly used approach.17 Recommendations from the National Cancer Institute’s Investigational Drug Steering Committee (IDSC) exist regarding the selection of endpoints for phase II trials of anticancer therapies and regarding the use of biomarkers in early clinical trials of novel anticancer therapies.18, 19
Are the active moieties in the plasma (or other biological fluid) appropriately identified and measured to assess pharmacokinetic parameters and exposure–response relationships?
Many anticancer therapies require activation before they are able to have their anticancer effect, with an activation process involving chemical or enzymatic reactions in normal or tumor tissues. In most cases, the activation process happens intracellularly, such that the active moieties cannot be measured in the plasma. Cisplatin, for example, undergoes a chemical reaction with water molecules intracellularly, resulting in the generation of a positively charged aquated species that attacks nucleophilic sites on DNA.20 Antimetabolites such as gemcitabine, 5-fluorouracil, and methotrexate undergo intracellular phosphorylation, phosphoribosylation, and polyglutamylation, respectively, to have and/or maximize their effects.21–23 On the other hand, some anticancer therapies are activated primarily in the liver, such that active moieties can and should be measured in the plasma in order to explore valid exposure–response relationships. One example is the topoisomerase-interacting agent irinotecan, which is converted by liver carboxylesterase into SN-38, an active moiety that is released into the systemic circulation and exposure to which predicts severe toxicity from irinotecan.24
Exposure–response
What are the characteristics of the exposure–response relationships for efficacy?
The results of treatment with an anticancer therapy depend on both pharmacokinetics and pharmacodynamics. Pharmacokinetics refers to the relationship between dose and concentration, whereas pharmacodynamics refers to the relationship between concentration (or exposure) and “response,” with response broadly defined as any measurable effect of the drug related to efficacy, toxicity, or neither. Exposure–response relationships help to define the target exposure range at which the drug is effective without causing severe toxicity (often referred to as the therapeutic index). Many anticancer therapies have a narrow therapeutic index.
In general, any drug may be considered to have a maximal effect and a median dose (the dose required for 50% of the maximal effect). Wagner proposed a generalized sigmoidal model of drug effect (Figure 1), based on the hypothesis that all drug effects require an initial interaction with a receptor.25 Pharmacodynamic models are generally different for agents that only work during certain phases of the cell cycle (phase-specific agents) compared with agents that work during any phase of the cell cycle (nonphase-specific agents). For nonphase-specific agents, such as cyclophosphamide and other alkylating agents, a simple log-linear model can be used as follows:
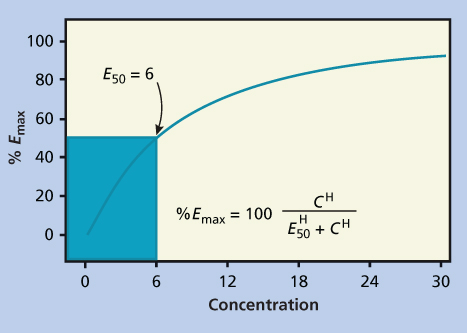
Figure 1 Example of Emax model as proposed by Wagner. The maximum effect is 100%, and a concentration of six results in 50% effect. The exponent H, also known as the Hill constant, determines the shape of the curve and is usually between 1 and 2.
This model has a steep exposure–response curve, as the effect continues to increase proportionally as the concentration (C) increases. For any K (in Equation 1), an increase in C by 2.3/K will result in a 1-log increase in antitumor effect (Figure 2a).26, 27
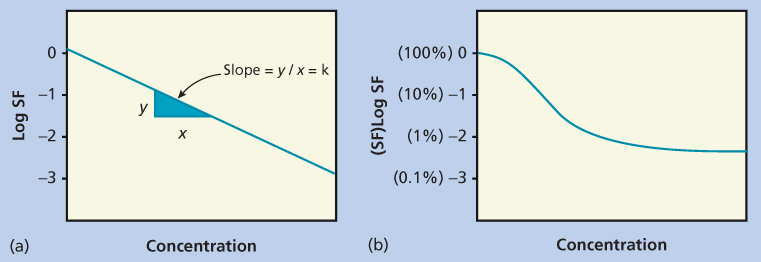
Figure 2 Pharmacodynamic plots for drugs with (a) nonsaturable and (b) saturable effects. In the simplest pharmacodynamic model (a), there is a linear relationship between dose and log kill. In (b) there is a maximal effect, resulting in a plateau in the dose-response curve. Abbreviation: SF, survival fraction.
Table 2 Anticancer therapies (in alphabetical order) for which a relationship between exposure and efficacy has been established, including the disease context and reference
| Drug | Disease | References |
| Axitinib | Renal cell carcinoma | Rini et al.31 |
| Busulfan | Allogeneic bone marrow transplantation | Bleyzac et al.32 |
| Carboplatin | Ovarian cancer | Jodrell et al.33 |
| Dasatinib | Chronic myeloid leukemia | Wang et al.34 |
| Erlotinib | Non-small cell lung cancer | Tiseo et al.35 |
| 5-Fluorouracil | Head and neck cancer | Milano et al.36 |
| Imatinib | Chronic myeloid leukemia gastrointestinal stromal tumor (GIST) | Larson et al.37 Demetri et al.38 |
| Methotrexate | Acute lymphoblastic leukemia | Evans et al.39 |
| Omacetaxine | Chronic myeloid leukemia | FDA reviewa |
| Pazopanib | Renal cell carcinoma | Suttle et al.40 |
| Sunitinib | Renal cell carcinoma, GIST | Houk et al.41 |
| Trastuzumab | Gastric/gastroesophageal cancer | Cosson et al.42 |
| Trastuzumab emtansine | HER2-positive breast cancer | Wang et al.30 |
| Vemurafenib | Melanoma | FDA reviewb |
This is intended to be an illustrative rather than a comprehensive list.
a http://www.accessdata.fda.gov/drugsatfda_docs/nda/2012/203585Orig1s000ClinPharmR.pdf
b http://www.accessdata.fda.gov/drugsatfda_docs/nda/2011/202429Orig1s000ClinPharmR.pdf
For phase-specific agents, such as the antimetabolites, the exposure–response relationships are much more complicated. By definition, some cells are out of phase and therefore not sensitive (or relatively insensitive) to the effects of the drug during the period of drug exposure. This cannot be overcome by increasing the dose, but can potentially be overcome by increasing the duration of drug exposure.28 The result is the appearance of a plateau in the exposure–response curve (Figure 2b). To further complicate matters, plasma concentrations may be an inadequate predictor of clinical effect for those agents that undergo intracellular anabolism to active metabolites, as is the case for cytarabine and many other antimetabolites.29
Trastuzumab emtansine (T-DM1), an antibody-drug conjugate consisting of a recombinant humanized monoclonal antibody targeting the extracellular domain of HER2 linked to a microtubule-stabilizing agent, is a recent example of a drug for which the exposure–response relationship for efficacy has been well studied. In the case of T-DM1 for the treatment of HER2-positive metastatic breast cancer, higher trough concentrations on day 21 of cycle 1 are associated with improved OS and PFS after adjusting for baseline risk factors. In fact, patients with exposures below the median level had OS and PFS comparable to the active control arm of lapatinib plus capecitabine, suggesting that dose escalation might improve efficacy for this subset of patients.30 Relationships between exposure and efficacy have also been found for a number of other anticancer therapies that are summarized with references in Table 2. Although still controversial, therapeutic drug monitoring has been suggested for many kinase inhibitors on the basis of these exposure–efficacy relationships.43
What are the characteristics of the exposure–response relationships for safety?
Exposure–response relationships for safety are analogous to those for efficacy, except that the phenotypes of interest are potentially severe toxicities of the drug rather than efficacy measures. Many historical examples with cytotoxic therapies highlight the value of elucidating such relationships. The relationship between toxicity subsequent to high-dose methotrexate and that of delayed methotrexate clearance has led to the routine use of therapeutic drug monitoring of plasma methotrexate concentrations to guide leucovorin dosing.44 The relationship between paclitaxel and neutropenia (generalizable to other cytotoxic therapies) is best described using nonlinear models that allow for an indirect effect of plasma concentration on bone marrow suppression, and these types of models have informed the optimization of the dose and schedule for many drugs.45, 46 Another example of a drug with a very well-characterized exposure–response relationship for safety is carboplatin, an analogue of cisplatin. Unlike cisplatin, the dose-limiting toxicity of carboplatin is thrombocytopenia, which is a function of drug dose, renal function, pretreatment platelet count, and prior therapy.47 The platelet nadir produced by a dose of carboplatin is related to the carboplatin clearance, which is directly proportional to creatinine clearance. Thus, patients at high risk of severe thrombocytopenia following carboplatin therapy can be identified prospectively, and the drug doses can be modified by monitoring creatinine clearance. Although many attempts have been made to avoid severe toxicities of cytotoxic therapies by monitoring plasma drug concentrations during treatment, these attempts have generally not led to changes in clinical practice.
Vemurafenib, an oral small molecule inhibitor of the BRAF kinase harboring the V600E or V600K mutations in patients with metastatic melanoma, provides a more recent example of a drug with a well-established exposure–response relationship for safety in addition to an exposure–response relationship for efficacy. (Of note, although the FDA label indicates that the drug may be administered with or without food, exposure is increased when the drug is taken with food.) When exposure is measured by trough concentration at steady state, there is an increased probability of squamous cell carcinoma (SCC; a well-known, treatment-related adverse effect) with increasing exposure in a logistic regression model (p < 0.0001) (http://www.accessdata.fda.gov/drugsatfda_docs/nda/2011/202429Orig1s000ClinPharmR.pdf). Despite this clear relationship, dose reductions for SCC events are not recommended because the survival benefits outweigh this safety risk.
Does this drug prolong the QT or QTc interval?
Many drugs prolong the QT interval by delaying depolarization and repolarization of the ventricles in the heart. The QT interval is corrected for the heart rate by one of two accepted formulas to calculate the heart-rate corrected QT (QTc) interval. QTc prolongation is associated with a higher incidence of ventricular tachyarrhythmias (particularly torsade de pointes) that can potentially lead to sudden cardiac death. As an increased risk of sudden cardiac death is a major safety issue, FDA and other regulatory authorities require that sponsors adequately assess this risk during clinical development of a new drug. In 2005, international guidelines were developed to guide the design and data interpretation of thorough QT studies, and these guidelines were circulated by FDA in a Guidance to Industry (Guidance for Industry: E14 Clinical Evaluation of QT/QTc Interval Prolongation and Proarrhythmic Potential for Non-Antiarrhythmic Drugs. FDA, October 2005). In this guidance document, FDA recommends that the ΔΔQTc (change in QTc compared to baseline, corrected for placebo effect) be used as the endpoint for thorough QT studies, and that the upper bound of the one-sided 95% CI (identical to the upper bound of a two-sided 90% CI) of the largest time-matched mean effect of the drug on the QTc interval should exclude 10 ms in order to conclude that there is no significant safety risk related to QTc prolongation.
Nilotinib is an oral small molecule inhibitor of BCR-ABL and other kinases that is used in the treatment of chronic myeloid leukemia (CML). A thorough QT study in healthy volunteers, in accordance with the E14 guidance, was conducted and demonstrated a clear relationship between steady-state concentration and ΔΔQTc, while concentrations in that study were lower than concentrations that can be expected with the approved therapeutic dose in cancer patients (http://www.accessdata.fda.gov/drugsatfda_docs/nda/2007/022068s000_ClinPharmR.pdf). As a result, it is recommended that the drug not be used in patients with hypokalemia, hypomagnesemia, or long QT syndrome who would be at especially high risk for QTc prolongation leading to sudden cardiac death. Furthermore, the FDA required that the sponsor initiate a Risk Evaluation and Mitigation Strategy (REMS) to “minimize the risk of QT prolongation and its potential cardiac sequelae” (http://www.accessdata.fda.gov/drugsatfda_docs/label/2010/022068s001rems.pdf). As part of the REMS and also in a “black box” warning on the drug label, prescribers and patients are cautioned to avoid concomitant use of drugs known to prolong the QT interval as well as CYP3A4 inhibitors and food, both of which are expected to substantially increase exposure to the drug. ECG (electrocardiogram) monitoring is recommended at baseline, 1 week after starting therapy, and periodically thereafter, including after any dose adjustments (Tasigna prescribing information, http://www.accessdata.fda.gov/drugsatfda_docs/label/2007/022068lbl.pdf).
Is the dose and dosing regimen selected by the sponsor consistent with the known relationship among dose, concentration, and response, and are there any unresolved dosing or administration issues?
While the dose and schedule for most anticancer therapies are selected on the basis of dose–concentration–response relationship, there are some for which there are unresolved dosing issues. One example is omacetaxine, a protein synthesis inhibitor that is approved for use in CML after resistance and/or intolerance of two or more tyrosine kinase inhibitors. Although the drug is labeled to be prescribed at an induction and maintenance dose of 1.25 mg/m2 because this is the dose that was used in the pivotal study, the reviewers found no evidence of a correlation between clearance of the drug and BSA. As a result, BSA-based dosing results in lower concentrations in patients with smaller body size, such as women, which was associated with a decrease in efficacy (http://www.accessdata.fda.gov/drugsatfda_docs/nda/2012/203585Orig1s000ClinPharmR.pdf). Another example is cabazitaxel, a microtubule-stabilizing agent that is approved for use in hormone-refractory metastatic prostate cancer after previous therapy with docetaxel. In a phase II trial in advanced breast cancer, the initial dose was 20 mg/m2 every 3 weeks, and dose escalation to 25 mg/m2 was allowed if no grade > 2 toxicity was observed in cycle 1. Even though only 21 of 71 patients could be escalated in cycle 2, the sponsor chose 25 mg/m2 every 3 weeks as the dose for the pivotal phase III trial in prostate cancer. On the basis of the available data, there is no clear exposure–response relationship for efficacy but there is a relationship between AUC and probability of grade 3+ neutropenia, suggesting that some patients could avoid the need for dose reduction and growth factor support by starting at a lower initial dose (http://www.accessdata.fda.gov/drugsatfda_docs/nda/2010/201023s000ClinPharmR.pdf). Finally, correct dosing can often be an issue when a drug is studied in a new disease and gets approved for a new indication. In the case of trastuzumab, the approved dose for breast cancer was used in the randomized phase III trial that demonstrated the efficacy of trastuzumab in combination with chemotherapy compared to chemotherapy alone for metastatic HER2-positive gastric/gastroesophageal junction (GEJ) cancer.48 Subsequently, a case report and review of pharmacokinetic data from the sponsor have suggested that clearance of the drug is ∼70% higher in patients with gastric cancer than in those with breast cancer.49 One possible explanation is that patients with metastatic gastric cancer have higher tumor burden and higher levels of circulating HER2 extracellular domains, resulting in higher clearance of the drug. Another possibility is that patients with gastric cancer may have lower albumin concentrations, leading to higher clearance of the drug. Standard dose versus higher dose trastuzumab is currently being explored in a randomized phase III trial in patients with HER2-positive metastatic gastric/GEJ cancer (HELOISE study; NCT01450696).
What are the pharmacokinetic characteristics of the drug and its major metabolite?
What are the single-dose and multiple-dose pharmacokinetic parameters?
Pharmacokinetics is the study of drug absorption, distribution, metabolism, and excretion. A fundamental concept in pharmacokinetics is drug clearance, that is, elimination of the drug from the body, analogous to the concept of creatinine clearance. In clinical practice, clearance of a drug is rarely measured directly but is calculated as either of the following:
The AUC represents the total drug exposure integrated over time and is an important parameter for both pharmacokinetic and pharmacodynamic analyses. As indicated in Equation (2), the clearance is simply the ratio of the dose to the AUC, so that the higher the AUC for a given dose is, the lower will be the clearance. If a drug is administered by continuous infusion and a steady state is achieved, the clearance can be estimated from a single measurement of the plasma drug concentration (Css) as in Equation (3).
Clearance can conceptually be considered to be a function of both distribution and elimination. In the simplest pharmacokinetic model,

where V is the volume of distribution and K is the elimination constant. V is the volume of fluid in which the dose is initially diluted, and thus the higher the V is, the lower will be the initial concentration. K is the elimination constant, which is inversely proportional to the half-life, the period of time that must elapse to reach a 50% decrease in plasma concentration. When the half-life is short, K is high and plasma concentrations decline rapidly. Thus, both a high V and a high K result in high clearance and relatively low plasma concentrations.
In most phase I trials of anticancer therapy, pharmacokinetic sampling is done at multiple time points after the first dose of drug administration and is repeated again after multiple doses of drug administration, the latter of which may or may not correspond to steady state. For single-dose sampling, parameters that are presented typically include the maximum concentration observed (Cmax), the time at maximum concentration (Tmax), AUC, V, clearance, and the half-life. For multiple-dose sampling, parameters are generally the same except for the potential addition of the minimum concentration (Cmin) before a dose. Pharmacokinetic parameters can be described by one of two methods. The first is noncompartmental analysis, a two-step process in which parameters such as Cmax and AUC are estimated for each patient and summary statistics are calculated for the population. Noncompartmental analysis can be done quickly and does not require special software. The second is population pharmacokinetic modeling, a one-step process in which parameters are estimated for the population of patients by developing a nonlinear mixed effects model with one or more compartments. Population pharmacokinetic modeling has several advantages: (1) it can be done with sparse (fewer time points) sampling data; (2) it is less susceptible to missing data; and (3) it can easily include covariates that minimize the between patient variability. A disadvantage is that it requires special software and training.50 The interested reader is likely to benefit from hands on experience with such software. Several caveats need to be emphasized for the casual reader. The validity of pharmacokinetic modeling depends to a large extent on the quality of the data that are used to develop the model. Thus, drug infusions must be precisely timed, a sufficient number of plasma samples must be drawn, the samples must be obtained on schedule, and analytic methods must be sensitive and specific. The data must be properly weighted to avoid bias due to the increased probability of analytic errors at drug concentrations near the detection limit of the assay. Results obtained using a specific model should be compared with those using noncompartmental analysis. Extrapolation of models outside the known time points must be done with great caution.
What are the characteristics of drug absorption?
Variability in absorption is a major source of interpatient variability in pharmacokinetics. The rate and extent of drug absorption depends on its solubility and permeability across the mucosal lining of the intestine. In pharmacokinetic models, absorption is typically estimated by a first-order rate constant, Ka. Absorption may be saturable, meaning that higher doses do not lead to higher exposure above a certain threshold dose. BCS class 1 drugs with high permeability/high solubility are absorbed quickly and extensively, whereas drugs in BCS classes 2–4 have variable absorption and may be influenced by a number of factors. For example, many small molecule tyrosine kinase inhibitors have their absorption limited by membrane efflux transporters such as P-glycoprotein (also known as ABCB1), breast cancer resistance protein (ABCG2), and members of the multi-drug resistance protein family (ABCC family), the same transporters that may be overexpressed in cancer cells as a resistance mechanism.51 Prandial conditions are also very important, as a number of oral anticancer therapies have enhanced absorption leading to increased exposure (and potentially increased toxicity) when coadministered with food, particularly a high-fat meal. Examples include erlotinib, lapatinib, nilotinib, pazopanib, vemurafenib, and abiraterone, the last of which can have a 10-fold increase in AUC with a high fat meal (compared to an overnight fast).52–54 These oral anticancer therapies are generally labeled to be taken fasting despite the fact that exposure is increased with food, in contrast to the typical approach for noncancer therapies; theoretically increasing the risks of the drug if patient adherence to labeling is suboptimal.53, 55 Finally, a number of oral anticancer therapies are weak bases that have pH-dependent solubility and may have their absorption decreased by concomitant use of proton-pump inhibitors or other acid-reducing agents that are frequently prescribed and/or used over-the-counter. Examples of therapies with clinically significant decreases in exposure when coadministered with acid-reducing agents include dasatinib, erlotinib, gefitinib, and nilotinib.56 When these kinase inhibitors are prescribed, patients should be instructed to abstain from the use of acid-reducing agents that might compromise the efficacy of these drugs.
What are the characteristics of drug distribution?
In pharmacokinetic models, there is a volume of distribution for each compartment in the model. Distribution is impacted by a number of factors, most notably water solubility and protein binding. Hydrophilic compounds, such as methotrexate, can distribute into fluid collections (such as pleural effusions or ascites) and significantly delay clearance of the drug from the central (plasma) compartment.57 On the other hand, pegylated liposomal doxorubicin is an example of a drug that has been engineered to be hydrophobic. Compared to free doxorubicin, its volume of distribution is very small and is mostly restricted to the intravascular compartment because the tight junctions of endothelial cells in blood vessels prevent extravasation of the liposomes, a fact that likely explains its reduced cardiotoxicity.58 Protein binding is very important because only unbound drug can reach the target site and be eliminated. Vismodegib is an example of a drug that has high-affinity reversible binding to alpha-1-acid glycoprotein (AAG) and albumin, resulting in plasma levels of unbound drug that are <1% of total drug levels and contributing to low clearance of the drug. AAG levels account for approximately 70% of the pharmacokinetic variability between patients, suggesting that this is the single most important factor influencing the pharamacokinetics of the drug.59 Concomitant drugs or disease states (e.g., hypoproteinemia) might increase the fraction of unbound drug but the clinical significance of this remains unclear for vismodegib and most other drugs.60
Does the mass balance study suggest renal or hepatic as the major route of elimination?
Mass balance studies involve the administration of radiolabeled drug to humans. Radioactivity is measured at different time points in the blood, urine, and feces, in order to understand to what extent hepatic metabolism, biliary excretion, and urinary excretion are contributing to elimination. The biological specimens are also used to identify and quantify the parent drug and its metabolites.61 FDA guidance recommends that any metabolite whose exposure exceeds 10% of the parent AUC at steady state should be evaluated in a preclinical animal model for toxicology (http://www.fda.gov/OHRMS/DOCKETS/98fr/FDA-2008-D-0065-GDL.pdf).
There are many examples of anticancer therapies that are eliminated primarily by renal or hepatic routes. Carboplatin and methotrexate are examples of drugs that are predominantly excreted unchanged in the kidney. This is relevant to carboplatin dosing, which is calculated by a simple formula based on renal function, as shown in Equation (5).62
Stay updated, free articles. Join our Telegram channel

Full access? Get Clinical Tree


