- Microvascular complications are caused by prolonged exposure to hyperglycemia.
- Hyperglycemia damages cell types that cannot downregulate glucose uptake, causing intracellular hyperglycemia.
- Intracellular hyperglycemia damages tissues by five major mechanisms: increased flux of glucose and other sugars through the polyol pathway; increased intracellular formation of advanced glycation end-products (AGEs); increased expression of the receptor for AGEs and its activating ligands; activation of protein kinase C isoforms; and overactivity of the hexosamine pathway.
- A single process – increased mitochondrial production of oxygen free radicals – activates each of these mechanisms.
- Persistent consequences of hyperglycemia-induced mitochondrial superoxide production may also explain the continuing progression of tissue damage after improvement of glycemic levels (“hyperglycemic memory”).
- Different individual susceptibility to microvascular complications have been linked to polymorphisms in the superoxide dismutase 1 gene.
- Hyperglycemia-induced mitochondrial reactive oxygen species production impairs the neovascular response to ischemia by blunting hypoxia-inducible factor 1 transactivation.
- Hypertension accelerates microvascular damage by increasing intracellular hyperglycemia through upregulation of the glucose transporter 1.
- Potential mechanism-based therapeutic agents for diabetic microvascular complications include transketolase activators, poly(ADP-ribose) polymerase inhibitors and catalytic antioxidants.
Overview of diabetic complications
All forms of diabetes are characterized by hyperglycemia, a relative or absolute lack of insulin action, and the development of diabetes-specific pathology in the retina, renal glomerulus and peripheral nerve. Diabetes is also associated with accelerated atherosclerotic disease affecting arteries that supply the heart, brain and lower extremities. As a consequence of its disease-specific pathology, diabetes mellitus is now the leading cause of new blindness in people 20–74 years of age and the leading cause of end-stage renal disease (ESRD) in the developed world. Survival of patients with diabetic ESRD on dialysis is half that of those without diabetes. More than 60% of patients with diabetes are affected by neuropathy, which includes distal symmetrical polyneuropathy, mononeuropathies and a variety of autonomic neuropathies causing erectile dysfunction, urinary incontinence, gastroparesis and nocturnal diarrhoea. Diabetic accelerated lower extremity arterial disease in conjunction with neuropathy accounts for 50% of all non-traumatic amputations in the USA. Diabetes and impaired glucose tolerance increase cardiovascular disease (CVD) risk three- to eightfold. Thus, over 40% of patients hospitalized with acute myocardial infarction (MI) have diabetes and 35% have impaired glucose tolerance. Finally, new blood vessel growth in response to ischemia is impaired in diabetes, resulting in decreased collateral vessel formation in ischemic hearts, and in non-healing foot ulcers. The focus of this chapter is on the microvascular complications comprising retinopathy, nephropathy and peripheral neuropathy.
Much of the impact of chronic diabetes falls on the microcirculation [1,2]. With long-standing disease, there is progressive narrowing and eventual occlusion of vascular lumina, resulting in impaired perfusion, ischemia and dysfunction of the affected tissues. Several processes contribute to microvascular occlusion. One of the earliest is increased vascular permeability, allowing extravasation of plasma proteins that accumulate as periodic acid-Schiff-positive deposits in the vessel walls. In addition, the extracellular matrix elaborated by perivascular cells such as pericytes (retina) and mesangial cells (glomerulus) is increased, brought about by changes in synthesis and turnover of its component proteins and glycosaminoglycans. As a result, the basement membrane is thickened in many tissues, including retinal capillaries and the vasa nervorum, while mesangial matrix is expanded in the renal glomerulus. Hypertrophy and hyperplasia of endothelial, mesangial and arteriolar smooth muscle cells also contribute to vessel wall thickening. Finally, increased coagulability of the blood and adhesion of platelets and leukocytes to the endothelial surface lead to microthrombus formation and luminal occlusion.
The progressive narrowing and blockage of diabetic microvascular lumina are accompanied by loss of microvascular cells. In the retina, diabetes induces apoptosis of Muller cells and ganglion cells [3], pericytes and endothelial cells [4]. In the glomerulus, widespread capillary occlusion and declining renal function are associated with podocyte loss. In the vasa nervorum of diabetic nerves, endothelial cell and pericyte degeneration occur [5] and appear to precede functional abnormalities of peripheral nerves [6]. Increased apoptosis of cells in the retina, renal glomerulus and peripheral neurons is a prominent feature of diabetic microvascular tissue damage [7–11] and may also cause damage to adjacent cells.
Role of hyperglycemia in microvascular complications
Overall, diabetic microvascular complications are caused by prolonged exposure to high glucose levels. This has been established by large-scale prospective studies for both type 1 diabetes (T1DM) by the Diabetes Control and Complications Trial/Epidemiology of Diabetes Interventions and Complications Study [DCCT/EDIC] [12] and for type 2 diabetes (T2DM) by the UK Prospective Diabetes Study [UKPDS] [13]). Similar data have been reported by the Steno-2 study [14].
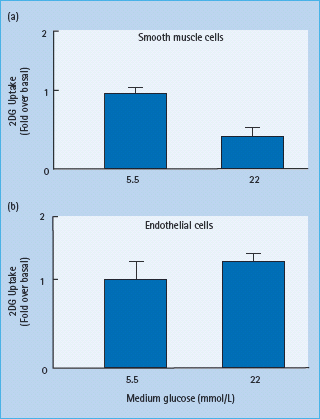
Because every cell in the body of people with diabetes is exposed to abnormally high glucose concentrations, why does hyperglycemia selectively damage some cell types and not others? The targeting of specific cell types by generalized hyperglycemia reflects the failure of those cells to downregulate their uptake of glucose when extracellular glucose concentrations are elevated. Cells that are not directly susceptible to direct hypergly-cemic damage such as vascular smooth muscle show an inverse relationship between extracellular glucose concentrations and glucose transport. In contrast, vascular endothelial cells, a major target of hyperglycemic damage, show no significant change in glucose transport rate when glucose concentration is elevated, resulting in intracellular hyperglycemia (Figure 35.1). These differences are caused in part by tissue-specific differences in expression and function of different glucose transporter (GLUT) proteins [15].
Figure 35.1 Lack of downregulation of glucose transport by hyperglycemia in cells affected by diabetic complications. (a) 2-Deoxyglucose uptake in vascular smooth muscle cells pre-exposed to 5.5 or 22 mmol/L glucose. (b) 2-Deoxyglucose uptake in aortic endothelial cells pre-exposed to 5.5 or 22 mmol/L glucose. Data from Kaiser N, Sasson S, Feener EP, Boukobza-Vardi N, Higashi S, Moller DE, et al. Differential regulation of glucose transport and transporters by glucose in vascular endothelial and smooth muscle cells. Diabetes 1993; 42:80–89.
Mechanisms of hyperglycemia-induced damage
There are nearly 2000 publications supporting five major mechanisms by which hyperglycemia causes diabetic complications:
Despite this, the results of clinical studies in which one of these pathways is blocked have been disappointing. This led to the hypothesis in 2000 that all five mechanisms are activated by a single upstream event: mitochondrial overproduction of the reactive oxygen species (ROS) superoxide as a result of intracellular hyperglycemia. This provides a unifying hypothesis for the patho-genesis of diabetic complications.
Increased polyol pathway flux
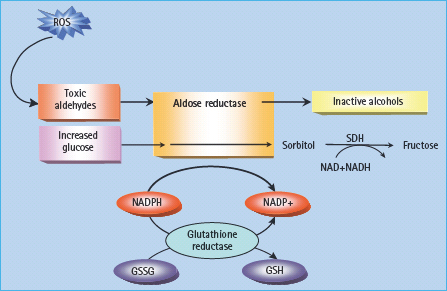
The polyol pathway is based on a family of aldoketo reductase enzymes which can utilize as substrates a wide variety of sugar-derived carbonyl compounds and reduce these by nicotinic acid adenine dinucleotide phosphate (NADPH) to their respective sugar alcohols (polyols). The classic representation holds that glucose is converted to sorbitol, and galactose to galactitol. Sorbitol is then oxidized to fructose by the enzyme sorbitol dehydrogenase (SDH), with NAD+ being reduced to NADH (Figure 35.2).
Figure 35.2 The polyol pathway. When glucose concentration is normal, aldose reductase reduces toxic aldehydes generated by reactive oxygen species (ROS) to inactive alcohols. With intracellular hyperglycemia, it can also reduce glucose to sorbitol. Both reactions use nicotinic acid adenine dinucleotide phosphate (NADPH) as a co-factor. When aldose reductase activity is sufficient to deplete reduced glutathione (GSH), oxidative stress is augmented. Sorbitol-dehydrogenase (SDH) oxidizes sorbitol to fructose using NAD+ as a co-factor. GSSG, glutathione disulfi de (oxidized glutathione).
The first and rate-limiting step of the polyol pathway is governed by aldose reductase, which is found in tissues such as nerve, retina, lens, glomerulus and blood vessel wall. In these tissues, glucose uptake is mediated by GLUT proteins other than GLUT-4 and so does not require insulin; intracellular glucose concentrations therefore rise in parallel with hyperglycemia.
Several mechanisms have been proposed to explain how hyperglycemia-induced increases in polyol pathway flux could damage the tissues involved. These include sorbitol-induced osmotic stress, decreased cytosolic Na/K+-ATPase activity, increased cytosolic NADH/NAD+, and decreased cytosolic NADPH. It was originally suggested that intracellular accumulation of sorbitol, which does not diffuse easily across cell membranes, could result in osmotic damage, but it is now clear that sorbitol levels in diabetic vessels and nerves are far too low to do this. Another early suggestion was that increased flux through the polyol pathway led to decreased phosphatidylinositol synthesis, and that this inhibited Na/K+-ATPase activity. The latter abnormality does occur in diabetes, but has recently been shown to result from hyperglycemia-induced activation of PKC which increases the production of two inhibitors of Na/K+-ATPase, arachidonate and prostaglandin E2 [16].
I t has also been suggested that the reduction of glucose to sorbitol by NADPH (Figure 35.2) consumes the latter. NADPH is a co-factor required to regenerate reduced glutathione (GSH); as GSH is an important scavenger of ROS, this could induce or exacerbate intracellular oxidative stress. Indeed, overexpression of human aldose reductase increased atherosclerosis in diabetic mice and reduced the expression of genes that regulate regeneration of GSH [17]. Reduced GSH is depleted in the lens of trans-genic mice that overexpress aldose reductase and in diabetic rat lens compared with non-diabetic lens [18,19]. It has also been recently demonstrated that decreased glutathiolation of cellular proteins is related to decreased nitric oxide (NO) availability in diabetic rats which would decrease S-nitrosoglutathione (GSNO). Restoring the NO levels in diabetic animals increases glutathiolation of cellular proteins, inhibits aldose reductase activity and prevents sorbitol accumulation.
Moreover, hyperglycemia can also inhibit glucose-6-phosphate dehydrogenase, the major source of NADPH regeneration, which may further reduce NADPH concentration in some vascular cells and neurons [20].
In diabetic vascular cells, however, glucose does not appear to be the substrate for aldose reductase, because the Michaelis constant (Km) of aldose reductase for glucose is 100 mmol/L, while the intracellular concentration of glucose in diabetic retina is 0.15mmol/L [21,22]. Glycolytic metabolites of glucose such as glyceraldehyde-3-phosphate, for which aldose reductase has much higher affinity, may be the physiologically relevant substrate.
Increased intracellular AGE formation
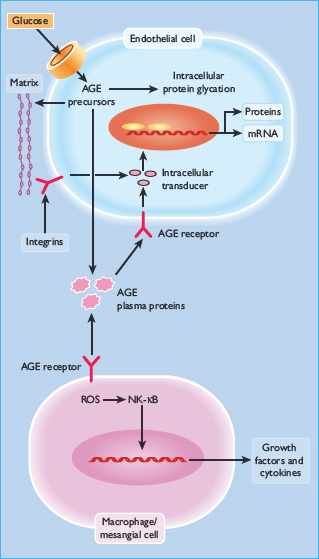
AGEs are formed by the reaction of glucose and other glycating compounds (e.g. dicarbonyls such as 3-deoxyglucosone, methyl-glyoxal and glyoxal) with proteins and, to a lesser extent, nucleic acids. The reactions proceed through a series of stages that are initially reversible and yield early glycation products, but eventually undergo irreversible changes that markedly impair the structural, enzymatic or signaling functions of the glycated proteins (Figure 35.3). A familiar example of this process yields glycated hemoglobin (HbA1c). AGEs are found in increased amounts in extracellular structures of diabetic retinal vessels [23–25] and renal glomeruli [26–28], where they can cause damage through the mechanisms described below.
Figure 35.3 Increased production of intracellular advanced glycation end-products (AGE) precursors damages cells by three mechanisms: modification of intracellular proteins; modification of the extracellular matrix (upper panel); and interactions with AGE receptors such as RAGE in endothelial cells and macrophages. NFκB, nuclear factor κB; ROS, reactive oxygen species.
These AGEs were originally thought to arise from non-enzymatic reactions between extracellular proteins and glucose; however, the rate of AGE formation from glucose is orders of magnitude slower than that induced by glucose-derived dicarbonyl precursors generated intracellularly, and it now seems likely that raised intracellular glucose is the primary initiating event in the formation of both intracellular and extracellular AGEs [29]. AGEs can arise intracellularly from the autooxidation of glucose to glyoxal [30], the decomposition of an Amadori product to the 3-deoxyglucosone, or the fragmentation of glyceraldehyde-3-phosphate to yield methylglyoxal [31]. All these reactive intracellular dicarbonyls react readily with uncharged amino groups of intracellular and extracellular proteins to form AGEs. Methylglyoxsal is the major intracellular AGE precursor [32,33].
Intracellular effects of AGEs
Intracellular production of AGE precursors can damage cells by three general mechanisms. First, intracellular proteins modified by AGEs have altered function. Secondly, extracellular matrix components modified by AGE precursors interact abnormally with other matrix components and with matrix receptors (integrins) which are expressed on the surface of cells. Finally, plasma proteins modified by AGE precursors bind to AGE receptors on cells such as macrophages; binding induces the production of ROS, which in turn activates the pleiotropic transcription factor, nuclear factor κB (NFκB), causing multiple pathologic changes in gene expression [34].
It has been recently demonstrated that AGE modification of intracellular protein can be involved in diabetic retinopathy. In diabetes, retinal capillary formation is regulated by complex context-dependent interactions among pro-and anti-angiogenic factors [35,36], including angiopoietin-2 (Ang-2). When vascular endothelial growth factor (VEGF) levels are insufficient, Ang-2 causes endothelial cell death and vessel regression. Diabetes induces a significant increase in retinal expression of Ang-2 in rat [37], and diabetic Ang-2 +/– mice have both decreased pericyte loss and reduced acellular capillary formation [38].
Moreover, in mouse kidney endothelial cells, high glucose causes increased methylglyoxal modification of the corepressor mSin3A. Methylglyoxal modification of mSin3A results in increased recruitment of O-GlcNAc-transferase, with consequent increased modification of Sp3 by O-linked N-acetylglucosamine. This modification of Sp3 causes decreased binding to a glucose-responsive GC-box in the Ang-2 promoter, resulting in increased Ang-2 expression. Increased Ang-2 expression induced by high glucose in renal endothelial cells increased expression of intracellular adhesion molecule 1 (ICAM-1) and vascular cell adhesion molecule 1 (VCAM-1) in cells and in kidneys from diabetic mice and sensitized microvascular endothelial cells to the pro-inflammatory effects of tumor necrosis factor α (TNF-α) [39].
Effects of AGEs on extracellular matrix
AGE formation alters the functional properties of several important matrix molecules. Collagen was the first matrix protein in which glucose-derived AGEs were shown to form covalent inter-molecular bonds. This process is partly mediated by H2O2 production [40,41]. With type I collagen, this cross-l inking causes expansion of molecular packing [42], while AGE formation on type IV collagen from basement membrane inhibits the normal lateral association of these molecules into a network-l ike structure by interfering with binding of the non-collagenous NC1 domain to the helix-rich domain [43]. AGE formation on laminin prevents the molecules from self-assembling into a polymer and also decreases binding with type IV collagen and heparan sulfate proteoglycan [44].
These AGE-induced cross-links alter tissue function, notably in blood vessels. AGEs decrease elasticity in arteries from diabetic rats, even after vascular tone is abolished, and increase fluid filtration across the carotid artery [45]. In vitro. AGE formation on intact glomerular basement membrane increases its permeability to albumin in a manner that resembles the abnormal permeability of diabetic nephropathy [46,47].
AGE formation on extracellular matrix also interferes with the ways in which cells interact with the matrix. For example, methylglyoxal modification of type IV collagen’s cell-binding domains decreases endothelial cell adhesion and inhibits angiogenesis [48].
AGE formation on a 6-amino acid, growth-promoting sequence in the A chain of the laminin molecule markedly reduces neurite outgrowth [49]. while AGE modification of vitronectin reduces its ability to promote cell attachment [50]. In addition, matrix glycation impairs agonist-induced Ca2+ increases which might adversely affect the regulatory functions of endothelium [51].
Receptor-mediated biologic effects of AGEs
AGE-modified proteins in the circulation can affect a range of cells and tissues. Specific receptors for AGEs were first identified on monocytes and macrophages. Two AGE-binding proteins isolated from rat liver, identified as OTS-48 (60kDa) and 80K-H (90 kDa) [52], are both present on monocytes and macrophages; antisera against either protein block AGE binding [53]. AGE protein binding to this receptor stimulates macrophages to produce cytokines, including interleukin-1, TNF-α, transforming growth factor β (TNF-β), macrophage colony-stimulating factor and granulocyte-macrophage colony-stimulating factor, as well as insulin-like growth factor I (IGF-I). These factors appear to be produced at concentrations that can increase glomerular synthesis of type IV collagen and induce chemotaxis and proliferation of both arterial smooth muscle cells and macrophages [54–62]. The macrophage scavenger receptor type II (class A), galectin-3 and CD36 (a member of the class B macrophage scavenger receptor family) have also been shown to recognize AGEs [63–67].
AGE receptors have also been identified on glomerular mesangial cells. In vitro, AGE protein binding to its receptor on mesangial cells stimulates secretion of platelet-derived growth factor which in turn mediates mesangial cells to produce type IV collagen, laminin and heparan sulfate proteoglycan [68,69].
Vascular endothelial cells and other cell types also express specific AGE receptors (RAGEs), notably 35-kDa and 46-kDa AGE-binding proteins that have been purified to homogeneity [70–72]. The N-terminal sequence of the 35-kDa protein is identical to lactoferrin, whereas the 46-kDa AGE-binding protein is a novel member of the immunoglobulin superfamily, containing three disulfide-bonded immunoglobulin homology units. RAGE have been shown to mediate signal transduction via generation of ROS, activation of NFκB, and p21 ras [73–75]. AGE signaling can be blocked in cells by expression of RAGE antisense cDNA [76] or anti-RAGE ribozyme [77]. It has been also recently demonstrated that a RAGE-NFκB axis operates in diabetic neuropathy by mediating functional sensory deficits [78].
In endothelial cells, AGE binding to its receptor alters the expression of several genes, including thrombomodulin, tissue factor and VCAM-1 [79–81]. These effects induce procoagulatory changes on the endothelial cell surface and increase the adhesion of inflammatory cells to the endothelium. In addition, endothe-lial AGE receptor binding appears to mediate in part the increased vascular permeability induced by diabetes, probably through the induction of VEGF [82–85]. RAGE deficiency attenuates the development of atherosclerosis in the diabetic apoE(–/–) model of accelerated atherosclerosis. Diabetic RAGE(–/–)/apoE(–/–) mice had significantly reduced atherosclerotic plaque area. These beneficial effects on the vasculature were associated with attenuation of leukocyte recruitment, decreased expression of pro-inflammatory mediators, including the NFκBsubunit p65, VCAM-1, and monocyte chemotactic protein 1 (MCP-1) and reduced oxidative stress [86].
It is important to note that more recent studies indicate that AGEs at the concentrations found in diabetic sera are not the major ligand for RAGE. Rather, several pro-inflammatory protein ligands have been identified, which activate RAGE at low concentrations. These include several members of the S100 calgranulin family and high mobility group box 1 (HMGB1), all of which are increased by diabetic hyperglycemia. Binding of these ligands with RAGE causes cooperative interaction with the innate immune system signaling molecule toll-like receptor 4 (TLR-4) [87,88].
Increased protein kinase C activation
The group of PKCs consist of at least 11 isoforms that are widely distributed in mammalian tissues. The activity of the classic iso-forms is dependent on both Ca2+ ions and phosphatidylserine and is greatly enhanced by diacylglycerol (DAG). Persistent and excessive activation of several PKC isoforms might also operate as a third common pathway mediating tissue injury induced by hyperglycemia and associated biochemical and metabolic abnormalities. This results primarily from enhanced de novo synthesis of DAG from glucose via triose phosphates, whose availability is increased because raised intracellular glucose levels enhance glucose flux through the glycolytic pathway [89–92]. Finally, recent evidence suggests that the enhanced activity of PKC iso-forms could also result from the interaction between AGEs and their cell-surface receptors [93]. Hyperglycemia primarily activates the β and δ isoforms of PKC, both in cultured vascular cells [94–96] and in the retina and glomeruli of diabetic animals [91,92,93], but increases in other isoforms have also been found, such as PKC-α and PKC-ε isoforms in the retina [89] and PKC-α and PKC-δ in the glomerulus of diabetic rats [97,98] (Figure 35.4).
Figure 35.4 Activation of protein kinase C (PKC) by de novo synthesis of diacylglycerol (DAG) and some of its pathologic consequences. eNOS, endothelial NO synthase; ET-1, endothelin-1; NADPH, nicotinic acid adenine dinucleotide phosphate; NFκB,nuclear factor κB; PAI-1, plasminogen activator inhibitor 1; ROS, reactive oxygen species; TNF-β, transforming growth factor β; VEGF, vascular endothelial growth factor.
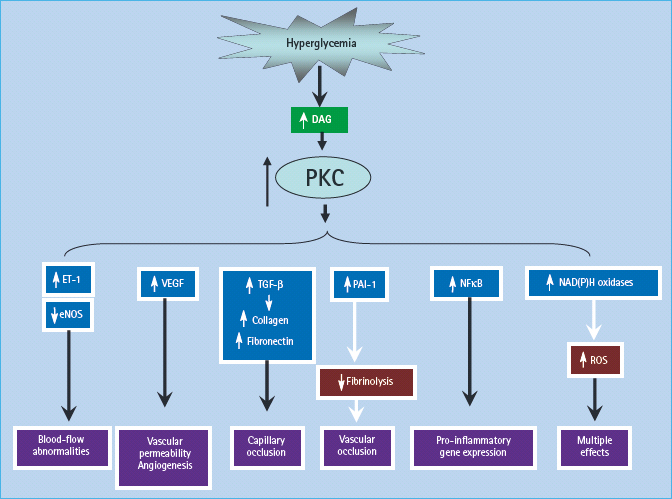
In early experimental diabetes, activation of PKC-β isoforms has been shown to mediate the diabetes-related decreases in retinal and renal blood flow [99], perhaps by depressing the production of the vasodilator NO and/or increasing endothelin-1, a potent vasoconstrictor. Overactivity of PKC has been implicated in the decreased NO production by the glomerulus in experimental diabetes [100] and by smooth muscle cells in the presence of high glucose levels [101], and has been shown to inhibit insulin-stimulated expression of endothelial NO synthase (eNOS) in cultured endothelial cells [102]. Hyperglycemia increases the ability of endothelin- 1 to stimulate mitogen activated protein kinase (MAPK) activity in glomerular mesangial cells, and this occurs by activating PKC isoforms [103]. The increased endothelial cell permeability induced by high glucose in cultured cells is mediated by activation of PKC-α [104]; activation of PKC by high glucose also induces expression of the permeability-enhancing factor VEGF in smooth muscle cells [105].
In addition to mediating hyperglycemia-i nduced abnormalities of blood flow and permeability, activation of PKC may contribute to the accumulation of microvascular matrix protein by inducing expression of TNF-β1, fibronectin and type IV collagen in both cultured mesangial cells [106,107] and in glomeruli of diabetic rats [97]. This effect also appears to be mediated through the inhibition of NO production by PKC [108]. Hyperglycemia-induced activation of PKC has also been implicated in the over-expression of the fibrinolytic inhibitor, plasminogen activator inhibitor 1 (PAI-1) [109], and in the activation of NFκB in cultured endothelial cells and vascular smooth muscle cells [110,111].
Increased hexosamine pathway flux
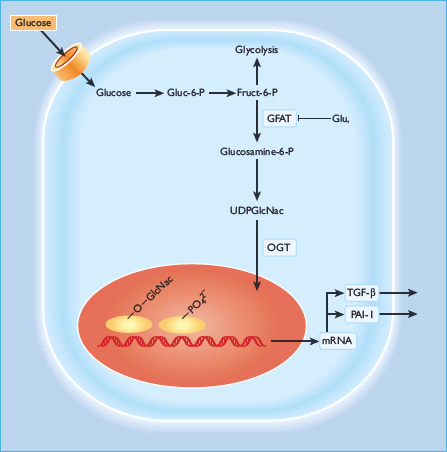
Several data suggest that hyperglycemia could cause diabetic complications by shunting glucose into the hexosamine pathway [112–115]. Here, fructose-6-phosphate is diverted from glycolysis to provide substrates for reactions that utilize UDP-N-acetylglucosamine, particularly the formation of O-linked N-acetylglucosamine. This pathway has been shown to have an important role in hyperglycemia-induced and fat-induced insulin resistance [116–118]. The rate-limiting step in the conversion of glucose to glucosamine is regulated by glutamine:fructose-6-phosphate amidotransferase (GFAT), and inhibition of this enzyme blocks hyperglycemia-induced increases in the transcription of both TGF-α [112] and TNF-β1 [113].
It is not entirely clear how increased glucose flux through the hexosamine pathway mediates hyperglycemia-mduced increases in the gene transcription of key genes such as TGF-α, TNF-β1 and PAI-1, however, it has been shown that the transcription factor Sp1 regulates hyperglycemia-induced activation of the PAI-1 promoter in vascular smooth muscle cells [119]. raising the possibility that covalent glycation of Sp1 by N-acetylglucosamine to form its O-GlcNacylated derivative could explain how hexosamine pathway activation might operate. Virtually every RNA polymerase II transcription factor examined is O-GlcNacylated [120], and this glycosylated form of Sp1 appears to be more transcriptionally active than its non-glycosylated counterpart [121]. A fourfold increase in Sp1 O-GlcNacylation (caused by inhibition of the enzyme O-GlcNac-β-N-acetylglucosaminidase) resulted in a reciprocal 30% decrease in the level of serine/threonine phosphorylation of Sp1; thus, O-GlcNacylation and phosphorylation may compete to modify the same sites on Sp1 (Figure 35.5) [122].
Figure 35.5 The glucosamine pathway. Glucosamine-6-phosphate is generated from fructose-6-phosphate and glutamine, by glutamine: fructose-6-phosphate amidotransferase (GFAT), the rate-limiting enzyme of this pathway. Glucosamine-6-phosphate is converted to UDP-N-acetylglucosamine (UDP-GlcNac), which can glycosylate transcription factors and thus enhance transcription of genes including plasminogen activator inhibitor 1 (PAI-1) and transforming growth factor β1 (TGF-β1). OGT, O-linked N-acetylglucosamine (GLcNac) transferase.
GlcNac modification of Sp1 may regulate other glucose-responsive genes in addition to TNF-β1 and PAI-1. Glucose-responsive transcription of the acetylcoenzyme A carboxylase gene (the rate-l imiting enzyme for fatty acid synthesis) is regulated by Sp1 sites, and post-transcriptional modification of Sp1 may similarly be responsible [123,124]. Because so many RNA polymerase II transcription factors are O-GlcNacylated [120], others in addition to Sp1 may be regulated by reciprocal modification (glycosylation vs phosphorylation) at key serine and threonine residues and so cause gene transcription to be glucose-responsive. In addition to transcription factors, many other nuclear and cytoplasmic proteins can be modified by O-GlcNac moities perturbing their normal function and regulation. One example relevant to diabetes is the inhibition of eNOS activity by O-GlcNacylation at the Akt site of eNOS protein [125127]. Hyperglycemia also increases GFAT activity in aortic smooth muscle cells which increases O-GlcNac modification of several proteins in these cells [128]. Overall, activation of the hexosamine pathway by hyperglycemia may result in many changes in both gene expression and in protein function that together contribute to the pathogenesis of diabetic complications. Recently, increased modification of key signaling molecules by O-GlcNAc was shown to cause reduced insulin signal transduction [129]. Pathway selective insulin resistance in vascular cells and resultant overactivation of the MAPK pathway by hyperin-sulinemia could contribute further to diabetic microvascular damage [130].
A single process underlying different hyperglycemia-induced pathogenic mechanisms: mitochondrial superoxide production
Specific inhibitors of aldose-reductase activity, AGE formation, RAGE ligand binding, PKC activation and hexosamine pathway flux each ameliorate various diabetes-induced abnormalities in cell culture or animal models, but it has not been clear whether these processes are interconnected or might have a common cause [99,131–134]. Moreover, all the above abnormalities are rapidly corrected when euglycemia is restored, which makes the phenomenon of hyperglycemic memory conceptually difficult to explain.
It has now been established that all of the different pathogenic mechanisms described above stem from a single hyperglycemia-induced process, overproduction of superoxide by the mitochondrial electron-transport chain [135,136]. Superoxide is the initial oxygen free radical formed by the mitochondria which is then converted to other, more reactive species that can damage cells in numerous ways. [137]. To understand how this occurs, mitochondrial glucose metabolism is briefly reviewed (Figure 35.6).
Figure 35.6 Mitochondrial metabolism. Flow of electrons (e–) through the electron transport chain in the inner mitochondrial membrane pumps H+ ions into the intermembrane space; superoxide is generated as a consequence of one electron leak. H+ ions can pass back across the inner membrane along their concentration gradient, either via ATP synthase (to produce ATP) or via uncoupling proteins (UCP). When intracellular hyperglycemia increases electron flux by generating more NADH and FADH2, more superoxide is produced. Cyt c, cytochrome c; Q, ubiquinone.
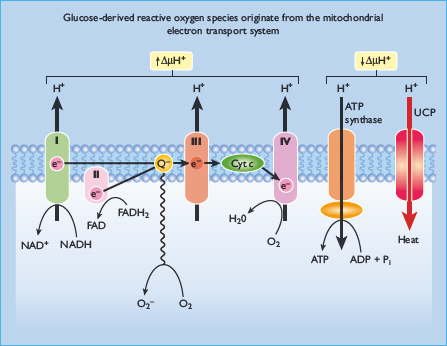
Intracellular glucose oxidation begins with glycolysis in the cytoplasm, which generates NADH and pyruvate. Cytoplasmic NADH can donate reducing equivalents to the mitochondrial electron-transport chain via two shuttle systems, or it can reduce pyruvate to lactate, which leaves the cell to act as a substrate for hepatic gluconeogenesis. Pyruvate can also be transported into the mitochondria where it is oxidized by the tricarboxylic acid (TCA) cycle to produce CO2, H2O, four molecules of NADH and one molecule of reduced flavine adenine dinucleotide (FADH2). Mitochondrial NADH and FADH2 provide energy for ATP production via oxidative phosphorylation by the electron transport chain. Electron flow through the mitochondrial electron transport chain is effected by four enzyme complexes, plus cytochrome c and the mobile carrier ubiquinone, all of which lie in the inner mitochondrial membrane [137]. NADH derived from both cytosolic glucose oxidation and mitochondrial TCA cycle activity donates electrons to NADH: ubiquinone oxidoreductase (Complex I) which ultimately transfers its electrons to ubiquinone. Ubiquinone can also be reduced by electrons donated from several FADH2– containing dehydrogenases, including succinate: ubiquinone oxidoreductase (Complex II) and glycerol-3 -phosphate dehydrogenase. Electrons from reduced ubiquinone are then transferred to ubiquinol: cytochrome c oxidoreductase (Complex III) by the Q cycle which generates ubisemiquinone radicals [138]. Electron transport then proceeds through cytochrome c, cytochrome c oxidase (Complex IV) and, finally, molecular oxygen.
Electron transfer through Complexes I, III and IV extrudes protons outwards into the intermembrane space, generating a proton gradient that drives ATP synthase (Complex V) as protons pass back through the inner membrane into the matrix. That is what happens in normal cells. In contrast, in diabetic cells with high glucose inside, there is more glucose being oxidized in the TCA cycle which in effect pushes more electron donors (NADH and FADH2) into the electron transport chain. As a result of this, the voltage gradient across the mitochondrial membrane increases until a critical threshold is reached. At this point, electron transfer inside Complex III is blocked [139], causing the electrons to back up to co-enzyme Q which donates the electrons one at a time to molecular oxygen and thereby generating superoxide. The mitochondrial isoform of the enzyme superoxide dismutase degrades this oxygen free radical to hydrogen peroxide which is then converted to H2O and O2 by other enzymes. Intracellular hyperglycemia did, indeed, increase the voltage across the mitochondrial membrane above the critical threshold necessary to increase superoxide formation [140] and, subsequently, increase in production of ROS.
It has been also recently demonstrated that dynamic changes in mitochondrial morphology are associated with high glucose-induced overproduction of ROS and inhibition of mitochondrial fission prevented periodic fluctuation of ROS production during high glucose exposure [141]. Hyperglycemia does not increase ROS and does not activate any of the pathways when either the voltage gradient across the mitochondrial membrane is collapsed by uncoupling protein 1 (UCP-1), or when the superoxide produced is degraded by manganese superoxide dismutase (MnSOD) [142]. Overexpression of either MnSOD and UCP-1 also prevents inhibition of eNOS activity by hyperglycemia [125]. Importantly, inhibition of hyperglycemia-induced superoxide overproduction using a transgenic approach (superoxide dismutase [SOD]) also prevents long-term experimental diabetic nephropathy and retinopathy [143]. In humans, skin fibroblast gene expression profiles from two groups of patients with T1DM–20 with very fast (fast track) versus 20 with very slow (slow track) rate of development of diabetic nephropathy lesions–showed that the fast-track group has increased expression of oxidative phosporylation genes, electron transport system Complex II and TCA cycle genes compared to that of the slow track group. This association is consistent with a central role for mitochondrial ROS production in the pathogenesis of diabetic complications [144].
Hyperglycemia-induced mitochondrial superoxide production activates the five damaging pathways by inhibiting GAPDH
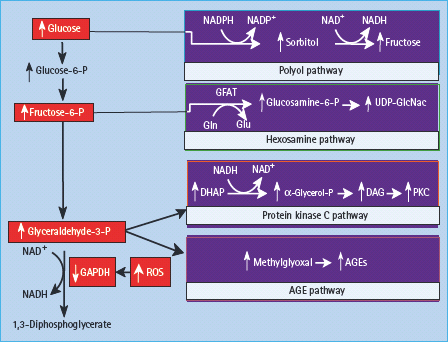
Diabetes in animals and humans and hyperglycemia in cells decrease the activity of the key glycolytic enzyme glyceralde-hyde-3 phosphate dehydrogenase (GAPDH) in cell types that develop intracellular hyperglycemia. Inhibition of GAPDH activity by hyperglycemia does not occur when mitochondrial overproduction of superoxide is prevented by either UCP-1 or MnSOD [145]. When GAPDH activity is inhibited, the level of all the glycolytic intermediates that are upstream of GAPDH increase. An increased level of the upstream glycolytic metabolite glyceraldehyde-3-phosphate activates two major pathways. It activates the AGE pathway because the major intracellular AGE precursor methylglyoxal is formed non-enzymatically from glyceraldehyde-3 phosphate. Hyperglycemia-induced methylglyoxal formation has recently been shown to cause both increased expression of RAGE and its activating ligands S100 calgranulins and HMGB1 (M. Brownlee, unpublished).
Increased glyceraldehyde-3-phosphate also activates the classic PKC pathway, because the activator of PKC, DAG, is also formed from glyceraldehyde-3 phosphate. Further upstream, levels of the glycolytic metabolite fructose-6 phosphate increase, which increases flux through the hexosamine pathway, where fructose-6 phosphate is converted by the enzyme GFAT to UDP–N-acetylglucosamine (UDP-GlcNAc). Finally, inhibition of GAPDH increases intracellular levels of the first glycolytic metabolite, glucose. This increases flux through the polyol pathway where the enzyme aldose reductase reduces it (or glyceraldehyde-3-phosphate), consuming NADPH in the process (Figure 35.7). Inhibition of GAPDH in 5 mmol/L activity using antisense DNA elevates the activity of each of the major pathways of hyperglyc-emic damage to the same extent as that induced by hyperglycemia [146].
Figure 35.7 Mitochondrial overproduction of superoxide activates the major pathways of hyperglycemic damage by inhibiting glyceraldehyde-3 phosphate dehydrogenase (GAPDH).
Stay updated, free articles. Join our Telegram channel

Full access? Get Clinical Tree


