Fig. 1
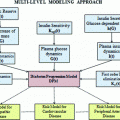
Schematics of the main processes of glucose homeostasis. Glucose is produced by the liver (endogenous glucose production) and absorbed by the gut (glucose absorption); insulin is produced by pancreatic beta-cells (insulin secretion); then, insulin inhibits endogenous glucose production, and promotes glucose uptake by the muscles
![$${\text{dG}}_{\text{circ}} /{\text{dt }} = { 1}/{\text{VG }} \times \, \left[ {{\text{BW }} \times \, \left( {{\text{EGP}}\left( {\text{t}} \right) \, {-}{\text{ Rd}}\left( {\text{t}} \right)} \right) \, + {\text{ ABS}}\left( {\text{t}} \right)} \right]$$](/wp-content/uploads/2017/04/A310669_1_En_7_Chapter_Equ1.gif)
(1)
It was demonstrated that EGP and Rd are predominantly regulated by circulating insulin concentrations [19]. During the OGTT, EGP in women can be calculated using the following relationship:

while in men, the relationship is equal to:


(2)

(3)
Rd is assessed in the single individual. Specifically, a logarithmical relationship is computed between two points in the (Rd, insulin) space. The first point is (Rd(0), insulin(0)), with Rd(0) calculated by the Eq. (2) (it should be reminded that Rd(0) = EGP(0)), and insulin(0) equal to basal, fasting insulin. The second point is (Rd(maximum), insulin(maximum)). Thus, it is assumed that Rd is maximum when plasma insulin is maximum. Of course, the maximum value of insulin during the OGTT is easily identified. As regards Rd(maximum), it is assumed that it is equal to the glucose disposal represented by the parameter M of an euglycemic-hyperinsulinemic clamp (that is, the glucose infusion rate during the last part of the clamp [21]). Alternatively, when the clamp is not performed, the clamp-like index [9] is used, or another OGTT insulin sensitivity index which can be considered a surrogate of M. Figure 2 shows the described approach for calculating Rd: the logarithmic function identified in each subject is used to assess Rd in each time sample of the OGTT. Thus, since dGcirc/dt is calculated from the plasma glucose concentration during the OGTT, in Eq. (1) the only unknown is ABS. Once the model (1) is integrated in time and ABS estimated, for each subject total glucose absorbed is calculated by integrating glucose absorption rates over the OGTT duration. Moreover, Glucose half-life (t½) in the gastrointestinal tract is individually determined by linear curve interpolation of relative glucose retention during the OGTT, by using the closest time points to cross the 50 % threshold [19].
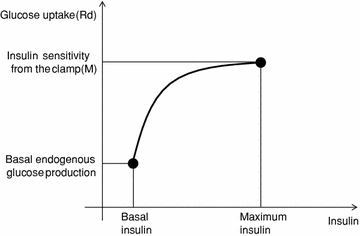

Fig. 2
Schematics of the method for the calculation of rate of glucose disappearance (glucose uptake, Rd)
In the original formulation [19], Eq. (1) was implemented using Simulink for Matlab (MathWorks Inc., Boston, MA), and ABS was estimated by solving the corresponding nonlinear least squares problem fitting the plasma glucose values during the OGTT (MatLab function used LSQNONLIN with 10,000 iterations at maximum). Every time sample of ABS was treated as an independent parameter to be estimated. Common criteria of model performance (best fit, residuals, variance-covariance Fisher’s matrix) were evaluated for accepting the final model’s prediction.
3.1.2 Applications and Outcomes
In a first study [19], the model (1) was used to analyze sex related differences in OGTT glucose metabolism, including gut absorption, in healthy humans. We analyzed 48 females and 26 males, with comparable age and body mass index but different height (males being taller). We found that, in the early phase of the OGTT, males had markedly increased glucose absorption rates by approximately 200 mg/min from the gastrointestinal tract, whereas in the final phase of the OGTT, females absorbed approximately 60 mg/min more glucose. These differences in glucose absorption were accompanied by an approximately 14 min longer gut glucose half-life in women, which could explain the higher glucose levels at the end of the OGTT in females. However, we also found that females have lower peripheral insulin release during the first 60 min of the OGTT, and this may result in a lower glucose disappearance rate after a time interval, given the known delay of insulin action on peripheral tissues. In fact, the period of lower glucose disappearance rate included the 2 h data sample, characterized by higher glucose level in females. Therefore, impaired glucose tolerance (IGT) higher prevalence in women may depend on a concomitant effect of insulin release and glucose absorption.
In another study [22], the model (1) was used to assess glucose absorption in 15 pregnant women with gestational diabetes mellitus (GDM), which were compared to 7 normal glucose tolerance women (NGT), matched for major anthropometric characteristics. After delivery (6–7 months later), both groups were studied the same way. It was found that in GDM gut glucose absorption rates were lower than in NGT in the 30–120 min interval of the OGTT. In addition, in GDM glucose absorption rates also were lower during pregnancy than after delivery (where all the GDM women returned to non-diabetic glycemic levels). In contrast, glucose absorption rates in NGT were comparable during and after pregnancy. Based on these findings, it could be concluded that the hyperglycemia of the GDM women cannot be ascribed to excessively rapid or increased glucose absorption.
3.2 NEFA Kinetic
3.2.1 The Model
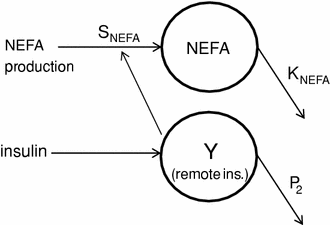
We have developed a model of and non-esterified fatty acids (NEFA) kinetics. It was postulated that NEFA kinetics could be described by first order (single compartment) kinetics, with NEFA production controlled by insulin in remote compartment [23]. In detail, the compartmental representation of NEFA kinetic model is shown in Fig. 3. It is assumed that plasma insulin enters a remote compartment, before having an inhibitory effect on NEFA production. The compartmental state variable Y(t) is a delayed profile of I(t), characterized by the fractional clearance P2 in min−1. NEFA production was considered to be: (i) linearly dependent on deviations from the basal value of remote insulin; (ii) with saturable inhibition. Thus, starting from basal production at basal insulin, NEFA production decreases with slope SNEFA, in ml/mU, for suprabasal increase in remote insulin up to a value beyond which NEFA production becomes constant. The maximum inhibitory capacity of insulin on NEFA production is expressed as a non-dimensional fraction (ρNEFA) of the basal production. The differential equations modelling the NEFA kinetics can be written as

![$$\left\{ \begin{aligned} & \frac{dY'(t)}{dt} = - P_{2}^{{}} \cdot [Y'(t) - (I(t) - I_{b})] \\ & Y'(t) = Y(t) - I_{b} \\ \end{aligned} \right.$$](/wp-content/uploads/2017/04/A310669_1_En_7_Chapter_Equ5.gif)

Fig. 3
Schematics of the NEFA kinetics model and of the insulin action on NEFA

(4)
![$$\left\{ \begin{aligned} & \frac{dY'(t)}{dt} = - P_{2}^{{}} \cdot [Y'(t) - (I(t) - I_{b})] \\ & Y'(t) = Y(t) - I_{b} \\ \end{aligned} \right.$$](/wp-content/uploads/2017/04/A310669_1_En_7_Chapter_Equ5.gif)
(5)
The subscript b identifies the basal values of plasma NEFA and insulin, I, In Eq. (5),the quantity Y′ is the remote insulin level above basal insulin Y′(t) = Y(t) − Ib. Therefore, the value assumed by the quantity SNEFA in Eq. (1) provides measure of the lipolysis inhibition due to suprabasal insulin variations, whereas the quantity ρNEFA accounts for circulating NEFA at complete HSL inhibition, and it is related to the fraction of NEFA that, produced within the intravascular system, escapes cellular uptake. The quantity KNEFA, in min−1, represents the fractional turnover rate for NEFA concentration. For given values of KNEFA and basal concentration NEFAb, the basal production rate of NEFA is calculated as NEFAb × KNEFA in mmol/l/min.
The model identification process allows the determination of an unknown parameter vector P = [NEFA b , K NEFA , S NEFA , ρ NEFA , P 2] T , the identification of which usually resorts to traditional gradient-based methods, in particular the weighted nonlinear least squares approach, using the Levenberg-Marquardt algorithm for the minimization procedure. However, the identification of the parameters P of the NEFA model of Eqs. (4) and (5) cannot be carried out by applying gradient-based methods straightforward. In fact, in gradient-based deterministic optimization methods, in every iteration step the calculation of the gradient of the least-square functional, with respect to the parameters P, must be calculated. Thus, the differentiability of the least-square functional with respect to the parameters P must be guaranteed. However, in this, case, this criterium is not satisfied by Eq. (1), because it includes a maximum function, whose differentiability is not guaranteed everywhere. Thus, the identification problem could be ill-posed.
Stay updated, free articles. Join our Telegram channel

Full access? Get Clinical Tree


