, Joong Mo Ahn2 and Yusuhn Kang2
(1)
Department of Radiology, Seoul National University College of Medicine, Seoul National University Bundang Hospital, Seongnam, South Korea
(2)
Department of Radiology, Seoul National University, Bundang Hospital, Seongnam, South Korea
8.1 Simple Bone Cyst
Overview
Simple bone cyst is a benign nonneoplastic lesion of the bone, characterized by an intramedullary unilocular cystic lesion filled with serous or serosanguinous fluid.
Epidemiology
Simple bone cysts account for 3 % of all primary bone lesions. It is most common in the second decade of life, with the first two decades of life accounting for 80 % of the cases. It has a strong male predilection (male: female = 3:1).
Common Locations
Ninety percent of the cases occur in long bones; humerus, proximal femur, and proximal tibia are affected in decreasing order. Lesions arise in the metaphysis and tend to migrate away from the physis along with skeletal growth. They may end up with the metadiaphyseal or even diaphyseal location. In adults, simple bone cysts are commonly found in the ilium, calcaneus, and talus.
Imaging Features
Radiograph
A typical simple bone cyst appears as a well-defined geographical osteolytic lesion with a thin sclerotic rim. It may also exhibit a pseudotrabeculated appearance due to prominent endosteal bony ridges. Simple bone cysts may cause circumferential expansion of the bone, but periosteal reaction is usually absent. When simple bone cysts are complicated with a pathological fracture, “fallen fragment sign” (fractured bone fragment that moves to the dependent site with positional change) and periosteal reaction may be noted (Fig. 8.1).
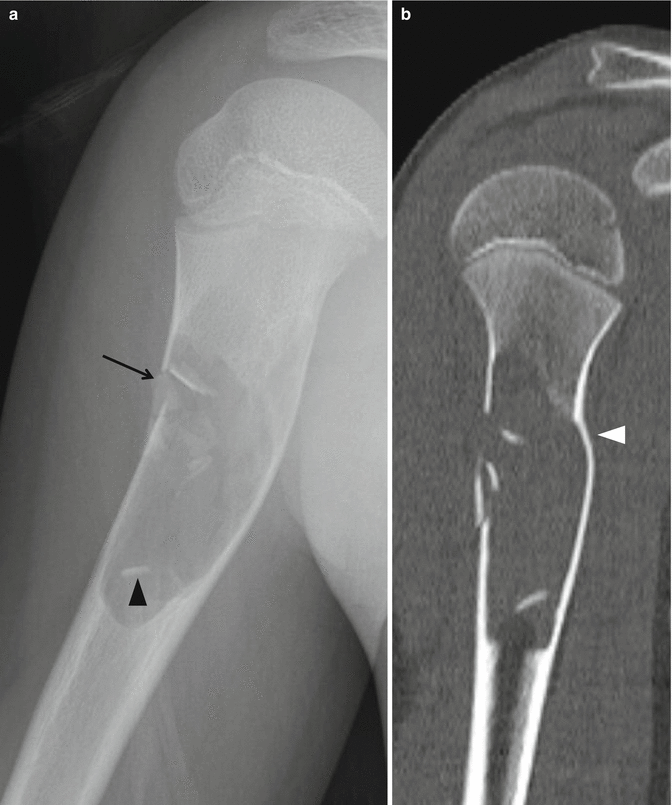

Fig. 8.1
Simple bone cyst in the right proximal humerus in an 11-year-old male. (a) An expansile, geographical osteolytic lesion with a nonsclerotic well-defined margin (type IB pattern of destruction) is noted at the proximal metadiaphysis of the right humerus. The lesion is complicated with a pathological fracture (black arrow), and the typical “fallen fragment sign” is noted (black arrowhead). (b) The cortical expansion is well noted on coronal reformatted CT image (white arrowhead)
Magnetic resonance imaging
MR imaging is useful in confirming the cystic nature of the lesion. It usually shows fluid-equivalent signal intensity, but the signal intensity may vary according to the amount and stage of blood products included in the lesion (Fig. 8.2). Lesions usually show thin peripheral rim enhancement after intravenous gadolinium injection (Fig. 8.3).
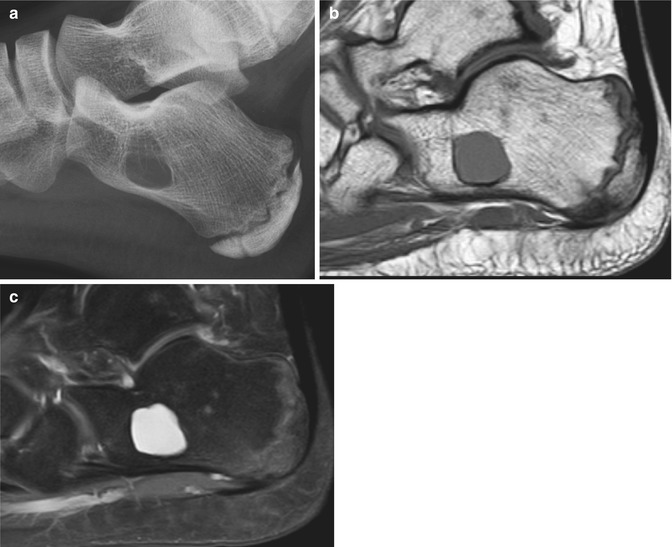
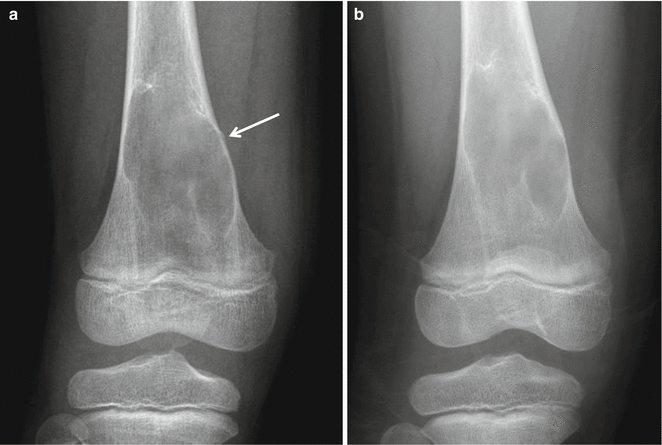
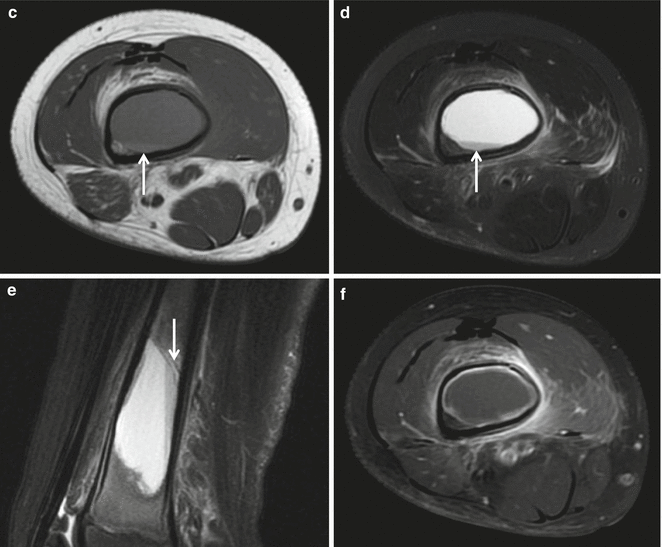

Fig. 8.2
Simple bone cyst in the calcaneus. (a) A geographical osteolytic lesion with a thin sclerotic border is noted in the calcaneus on lateral radiograph of the foot. The posterior ossification center of the calcaneus is present, and not yet fused in this 12-year-old patient. (b) Sagittal T1-weighted image and (c) sagittal T2-weighted fat-suppressed images show the fluid-equivalent signal intensity of the calcaneal lesion


Fig. 8.3
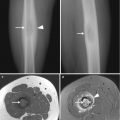
Simple bone cyst in the right distal femur in a 7-year-old male. (a) Anteroposterior radiograph of the right thigh shows a mildly expansile geographical osteolytic lesion in the distal metaphysis of the right femur with a central intramedullary location. This lesion is associated with a pathological fracture (white arrow). (b) Follow-up radiograph taken 4 months later shows healing of the fracture site. (c) Axial T1-weighted image, (d) axial, and (e) sagittal T2-weighted fat-suppressed images show the mildly expansile central lesion in the distal femur with most of the lesion exhibiting fluid-equivalent signal intensity. However, a fluid–fluid level is seen within the lesion, and the dependent portion shows slight hyperintensity on T1-weighted image and shading on T2-weighted image, indicating the presence of blood products due to the associated fracture (white arrows in c–e). (f) A thin peripheral rim of enhancement is noted on axial contrast-enhanced T1-weighted fat-suppressed image
Differential Diagnoses
- 1.
Aneurysmal bone cyst.
Aneurysmal bone cysts are more expansile compared to simple bone cysts, and multiple fluid–fluid levels are noted on MR imaging.
- 2.
Fibrous dysplasia.
The “ground-glass” density within the lesion may favor the diagnosis of fibrous dysplasia over simple bone cyst on radiograph. Fibrous dysplasia may be readily differentiated from simple bone cyst on MR imaging, due to the presence of enhancing solid component.
8.2 Aneurysmal Bone Cyst
Overview
Aneurysmal bone cyst (ABC) is a benign primary bone tumor composed of multiloculated blood-filled cystic spaces separated by connective tissue septae. It may occur as a primary lesion (70 %) or arise secondarily within a preexisting bone tumor (30 %).
Epidemiology
ABCs account for 1–2 % of primary bone tumors. ABC may occur in any age group, but is most common in the second decade of life, followed by the first decade. The first two decades of life account for 80 % of the cases. A slight female predominance has been reported in some studies, but there is no significant gender predilection.
Common Locations
ABCs have a predilection for the metaphysis of long bone. The distal femur, proximal tibia, and proximal femur are frequently affected. When it occurs in the spine, it is usually located in the posterior element.
Imaging Features
Radiograph
ABC presents as a well-defined, geographical osteolytic lesion with an eccentric intramedullary location at the metaphysis of a long bone (Fig. 8.4). It frequently accompanies a thin shell of cortical/periosteal bone along the surface of the lesion. Internal trabeculations may be seen within the lesion (Fig. 8.5). When the expansion of bone is associated with the internal trabeculations, lesions may exhibit a multiloculated “soap-bubble” appearance.
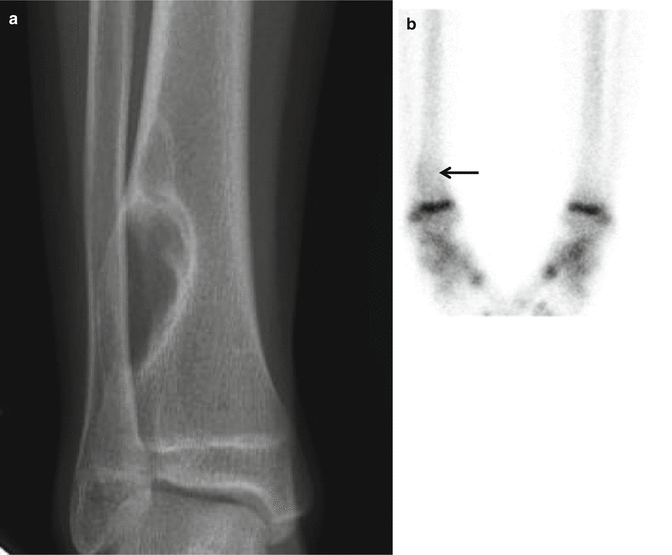
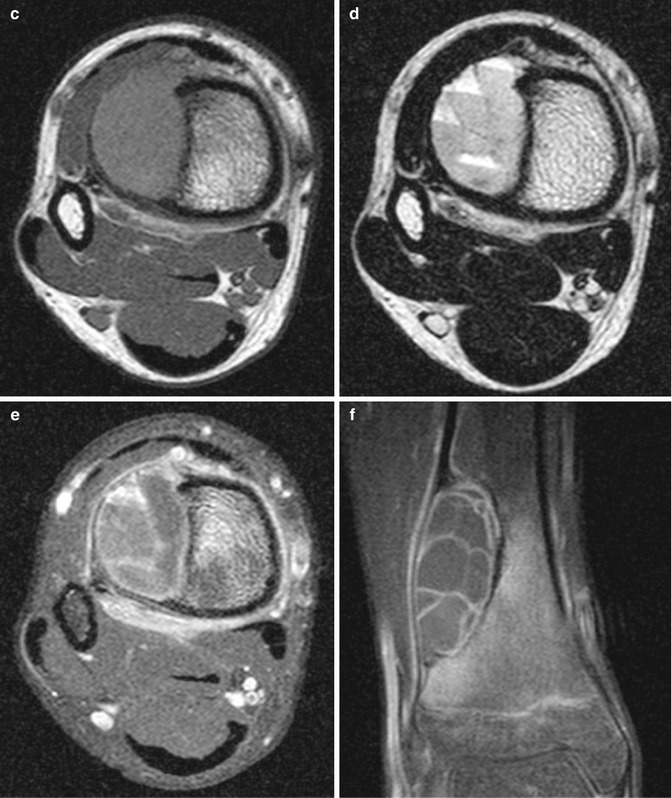
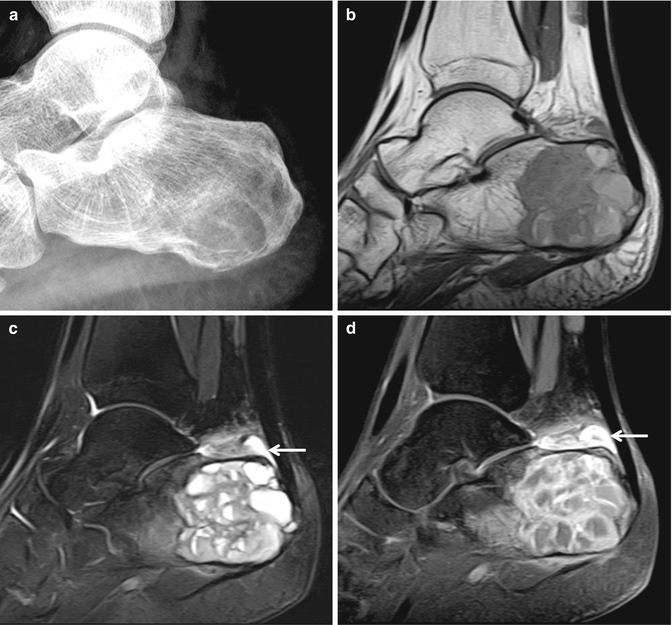


Fig. 8.4
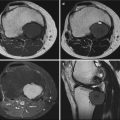
Aneurysmal bone cyst in the right tibia. (a) Anteroposterior radiograph shows an eccentric geographical osteolytic lesion with a sclerotic rim at the distal metaphysis of the right tibia. (b) On bone scan, a subtle increase in uptake is noted at the distal metaphysis of the right tibia compared to contralateral side (black arrow). The intense symmetric uptake noted in both tibiae is due to the open physes. The lesion shows intermediate signal intensity on axial T1-weighted image (c), and shows multiple fluid–fluid levels on axial T2-weighted image (d). A thin peripheral and septal enhancement is noted on (e) axial and (f) coronal contrast-enhanced T1-weighted fat-suppressed images. No definite solid component is noted within the tumor

Fig. 8.5
Aneurysmal bone cyst in the calcaneus. (a) Lateral radiograph of the foot shows a geographical osteolytic lesion in the calcaneus, with internal trabeculations (arrowhead). (b) Sagittal T1-weighted image, (c) sagittal T2-weighted fat-suppressed image, and (d) sagittal contrast-enhanced T1-weighted fat-suppressed images show the multiloculated cystic lesion with multiple fluid–fluid levels in the calcaneus. Soft tissue lesion with hyperintensity on T2-weighted image and contrast enhancement (white arrow) noted at the superior aspect of the calcaneus is due to the presence of retrocalcaneal bursitis
Magnetic resonance imaging
Multiple fluid–fluid levels are seen within the lesion on MR imaging (Fig. 8.6). MR imaging is useful in differentiating primary from secondary ABCs. The presence of a significant solid component within the tumor indicates an underlying lesion.
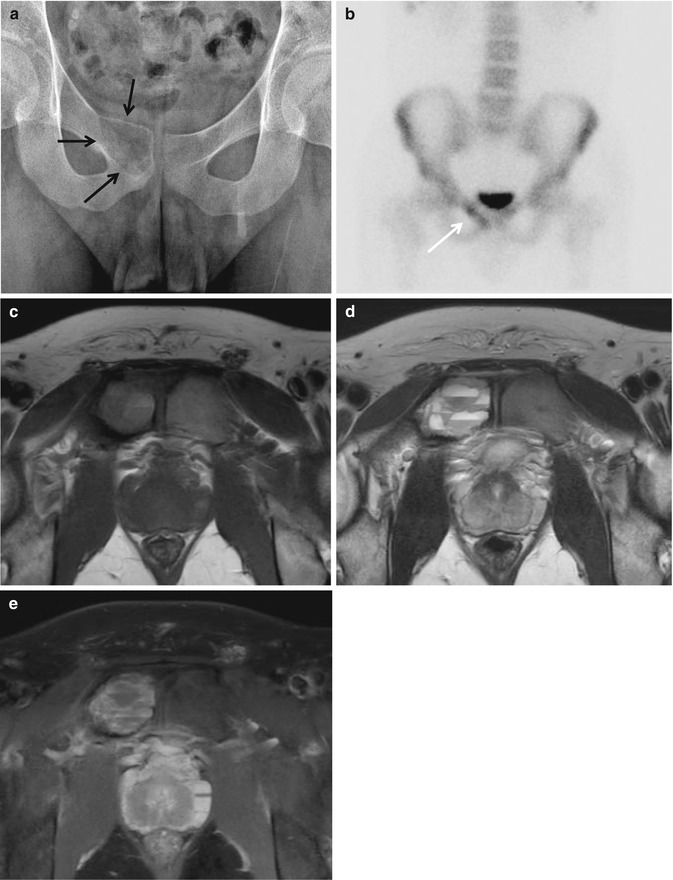

Fig. 8.6
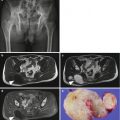
Aneurysmal bone cyst in the right pubic bone. (a) Anteroposterior radiograph of the pelvis shows an expansile osteolytic lesion at the right pubic body (black arrows). (b) Mildly increased uptake is noted on bone scan (white arrow). (c) Axial T1-weighted image, (d) axial T2-weighted fat-suppressed image, and (e) axial contrast-enhanced T1-weighted fat-suppressed image reveal the cystic nature of the lesion, with multiple fluid–fluid levels
Differential Diagnoses
- 1.
Simple bone cyst.
SBC has a central intramedullary location and is a unilocular lesion. SBCs are less expansile, compared to ABCs. Septations and fluid–fluid levels can be seen in SBC when complicated with a fracture.
- 2.
Telangiectatic osteosarcoma.
Telangiectatic osteosarcoma is a purely osteolytic lesion on radiographs and exhibits more aggressive features, compared to ABCs.
- 3.
Lesions that may accompany secondary ABCs: chondroblastoma, giant cell tumor, osteoblastoma, fibrous dysplasia, nonossifying fibroma, chondromyxoid fibroma.
8.3 Fibrous Dysplasia
Overview
Fibrous dysplasia is a benign fibro-osseous lesion characterized by the presence of abnormal fibrous tissue and islands of immature woven bone. They may appear in either monostotic or polyostotic forms. In polyostotic forms, it can distribute in one extremity, one side of the body, or be diffusely distributed throughout the body.
Epidemiology
Fibrous dysplasia is a common benign lesion that affects both children and adults, and is equally distributed in both genders. Monostotic forms are more common than polyostotic forms.
Common Locations
Fibrous dysplasias are most common in the craniofacial bones and femur. The femur, skull, tibia, and ribs are the most commonly affected sites in the monostotic form. In the polyostotic form, the femur, pelvis, and tibia are frequently affected. Within a long bone, lesions are intramedullary and diaphyseal in location.
Imaging Features
Radiograph
Fibrous dysplasia has a wide spectrum of radiographic findings, ranging from radiolucent to radiopaque lesions. The typical fibrous dysplasia appears as a well-defined intramedullary lesion with ground-glass density (Fig. 8.7). The opacity of the ground-glass density is determined by the amount of bone trabeculae and fibrous component. Fibrous dysplasias commonly show a sclerotic rim (rind sign; characteristic in the proximal femur) (Fig. 8.8). Fibrous dysplasias usually expand the bone; endosteal scalloping and cortical thinning may be present. Periosteal reaction is usually absent, unless the lesion is complicated with a pathological fracture. Fibrous dysplasia causes bowing or deformity of the bone, especially in polyostotic forms (Fig. 8.9). When the proximal femur is affected, a coxa varus angulation may result in a “shepherd crook” deformity (Refer to Tumor syndromes, Fig. 9.7).
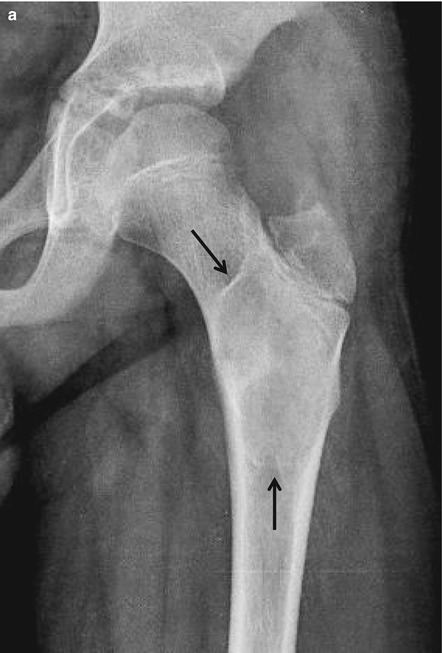
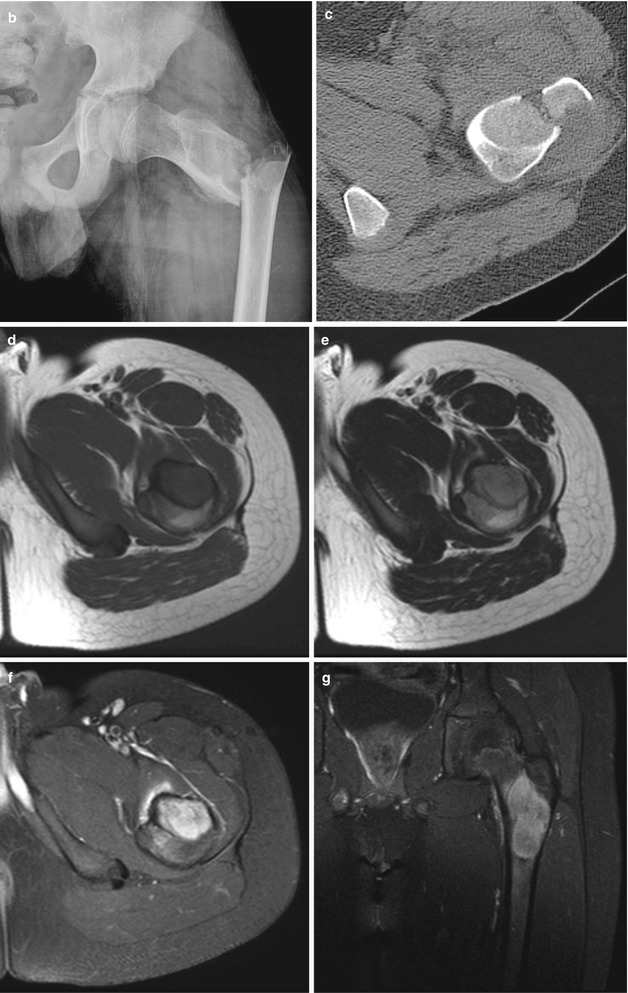
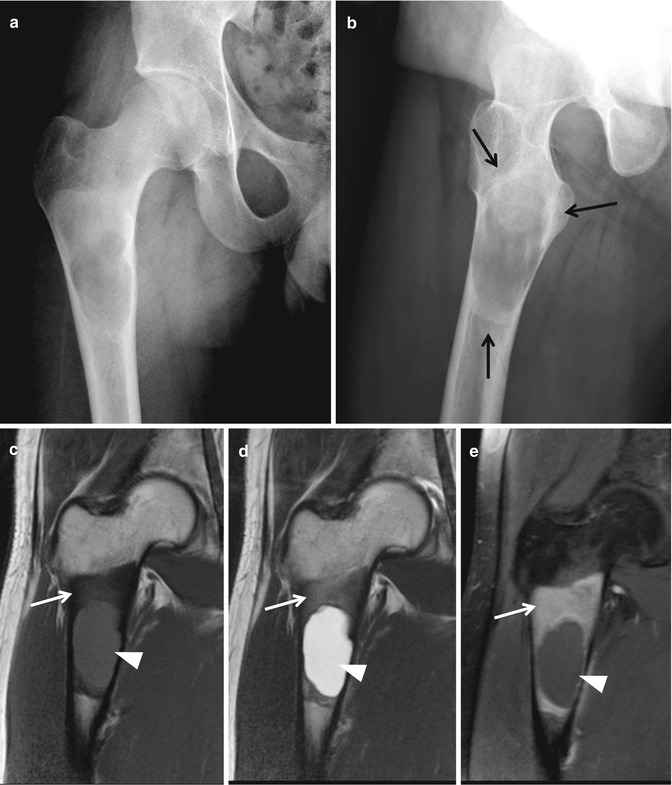
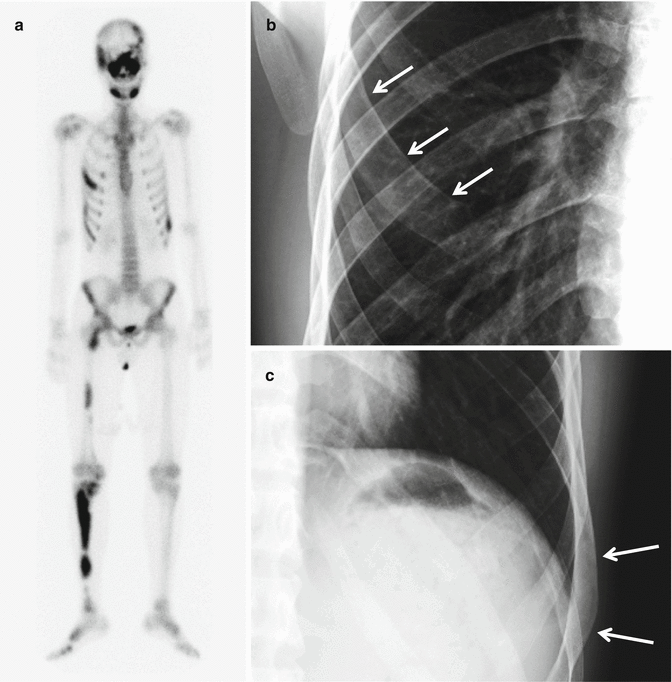
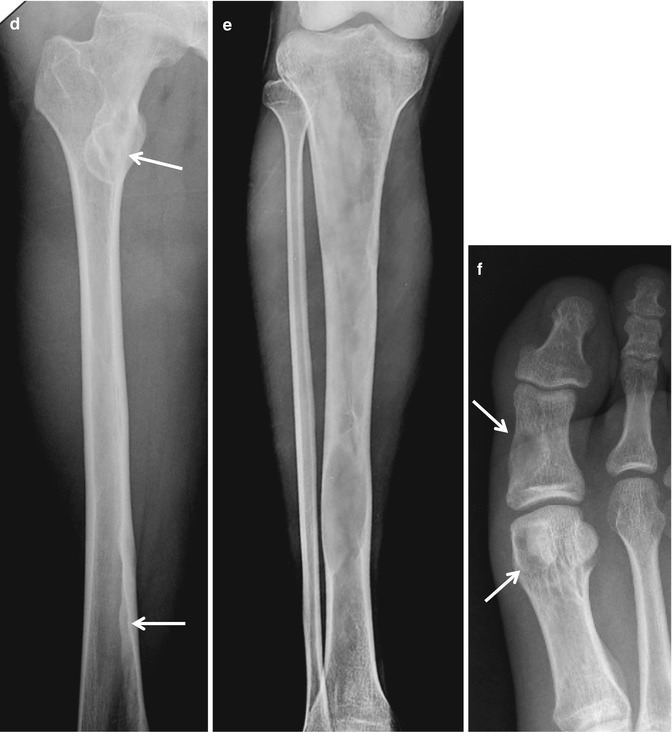


Fig. 8.7
Monostotic fibrous dysplasia in the left femur. (a) Anteroposterior radiograph of the left hip shows a ground-glass opacity lesion in the proximal metaphysis of the left femur in a 9-year-old male. A thin sclerotic rim is noted around the lesion (black arrows). (b) The patient presented with a pathological fracture after a minor trauma event. (c) Axial CT image shows the typical ground-glass opacity of the lesion. The lesion shows intermediate to low signal intensity on axial T1-weighted image (d), slightly high signal intensity on axial T2-weighted image (e), and homogeneous enhancement after intravenous gadolinium administration (f, g)

Fig. 8.8
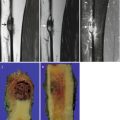
Fibrous dysplasia in the right femur. (a) Anteroposterior and (b) lateral radiographs of the right hip show a ground-glass opacity lesion in the proximal metaphysis of the right femur. A sclerotic rim is noted around the ground-glass opacity lesion (“rind sign”, black arrows in b). Coronal (c) T1-weighted image, (d) T2-weighted image, and (e) contrast-enhanced T1-weighted fat-suppressed images are shown. The solid portion of the lesion exhibits hypointensity on both T1-weighted and T2-weighted images and homogeneous enhancement (white arrows). A well-defined cystic portion is noted within the mass (white arrowheads), due to the cystic degeneration of fibrous dysplasia


Fig. 8.9
Polyostotic fibrous dysplasia. (a) Bone scan shows multifocal increased uptake throughout the body: craniofacial bones, ribs, right femur, right tibia, and right foot. Expansion of the right fourth rib anterolateral arc (b) and left ninth lateral arc (c) is noted (white arrows), corresponding to the increased uptake on bone scan. Anteroposterior radiographs of the femur (d), tibia (e), and right foot (f) show multiple ground-glass opacity lesions (arrows in d–f). The tibial cortex shows undulation with deformity due to the presence of multiple fibrous dysplasias
Magnetic resonance imaging
The MR imaging is useful in determining the extent of the disease, rather than in differentiating fibrous dysplasia from other entities. The MR imaging findings are nonspecific: intermediate to low signal intensity on T1-weighted imaging, high signal intensity on T2-weighted imaging, and contrast enhancement after intravenous gadolinium administration.
Differential Diagnoses
- 1.
Osteofibrous dysplasia.
Osteofibrous dysplasias are found at a typical site: the anterior cortex of tibial diaphysis. Osteofibrous dysplasias are intracortical in location, whereas fibrous dysplasias are intramedullary lesions.
- 2.
Liposclerosing myxofibrous tumor of bone.
Liposclerosing myxofibrous tumors (LSMFTs) occur at characteristic locations: the femoral neck and intertrochanteric region. At these locations, the differential diagnosis of LSMFT and fibrous dysplasia may be difficult. LSMFTs tend to have more osteosclerosis compared to fibrous dysplasia on radiographs.
- 3.
Solitary bone cyst.
Solitary bone cysts appear as well-defined intramedullary osteolytic lesion with a thin sclerotic rim at the metadiaphysis of a long bone, similar to fibrous dysplasia. The findings on MR imaging readily differentiate the two entities: solitary bone cysts are cystic in nature, whereas fibrous dysplasia is a solid lesion. However, areas of cystic degeneration may be found within fibrous dysplasia, making the diagnosis confusing.
8.4 Osteofibrous Dysplasia
Overview
Osteofibrous dysplasia is a benign fibro-osseous lesion of bone, typically found at the anterior tibial cortex. It is also referred to as ossifying fibroma or Kempson-Campanacci lesion.
Epidemiology
Osteofibrous dysplasias are rare lesions, accounting for <1 % of all bone tumors. It is usually noted in young children, and is rarely seen in patients over the age of 20 years, due to its self-limiting nature. It has been reported to have a male preponderance, but the exact male to female ratio is not known.
Common Locations
The characteristic location of osteofibrous dysplasia is the anterior cortex of the proximal or midshaft of tibia (Fig. 8.10). Another possible site of involvement is the fibular cortex. In 20 % of the patients with a tibial lesion, the ipsilateral fibular cortex is also involved (Fig. 8.11). Other long bones are rarely affected.
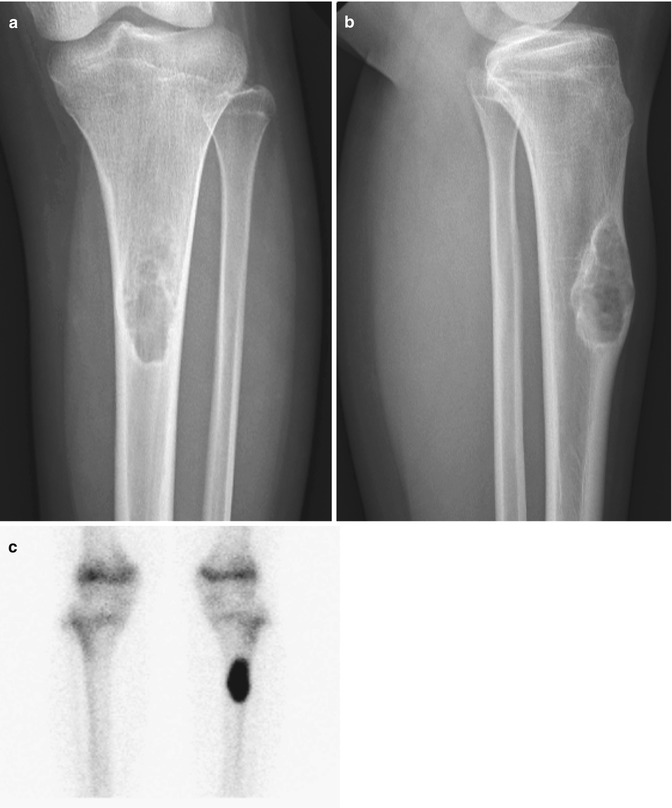
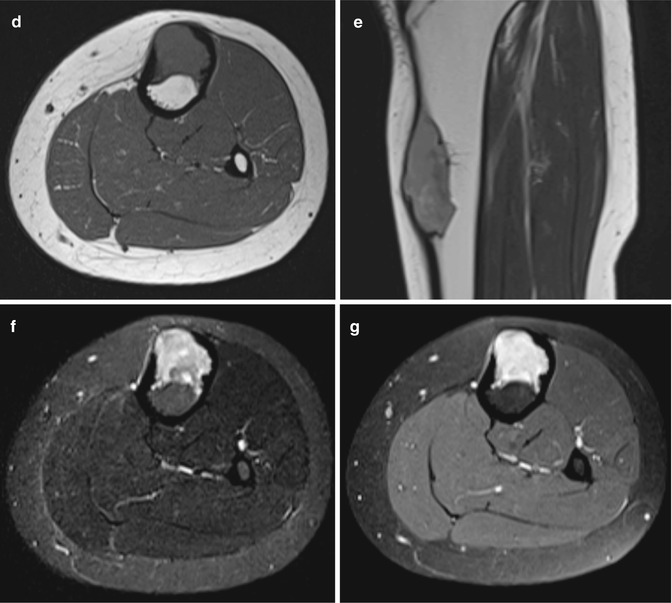
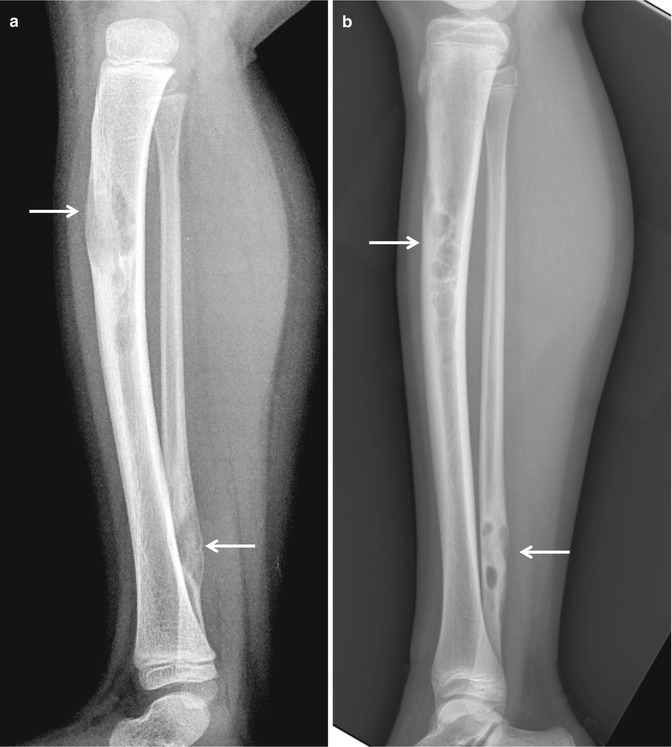


Fig. 8.10
Osteofibrous dysplasia. (a) Anteroposterior and (b) lateral radiographs of the left lower leg of a 15-year-old female are shown. A well-defined osteolytic lesion is noted at the anterior cortex of the proximal shaft of tibia with a predominantly cortical location. (c) Markedly increased uptake is noted on bone scan. (d) Axial and (e) sagittal T1-weighted images, (f) axial T2-weighted fat-suppressed image, and (g) axial contrast-enhanced T1-weighted fat-suppressed image are shown. The lesion shows intermediate signal intensity on T1-weighted image, high signal intensity on T2-weighted image, and shows intense contrast enhancement

Fig. 8.11
Osteofibrous dysplasia in the tibia with ipsilateral fibular cortex involvement. (a) Lateral radiograph of the left lower leg in a 3-year-old female. Well-defined osteolytic lesions are noted not only at the proximal shaft of tibia but also at the distal shaft of fibula (arrows). (b) Lateral radiograph of the left lower leg taken 8 years later shows interval sclerotic change of the previously noted osteolytic lesions, indicating that spontaneous healing is in progress
Imaging Features
Radiograph
Osteofibrous dysplasias are seen as well-defined intracortical osteolytic lesions along the anterior cortex of the tibia. Multifocal or confluent lesions oriented along the long axis of the tibia shaft are often encountered. Large lesions may appear expansile, with thinning of the cortex, resulting in a saw-toothed or bubbly multiloculated appearance. It may cause anterior bowing of the tibia.
Magnetic resonance imaging
Osteofibrous dysplasia appears of low to intermediate signal intensity on T1-weighted image, intermediate to high signal intensity on T2-weighted image, and typically show contrast enhancement (Fig. 8.12).
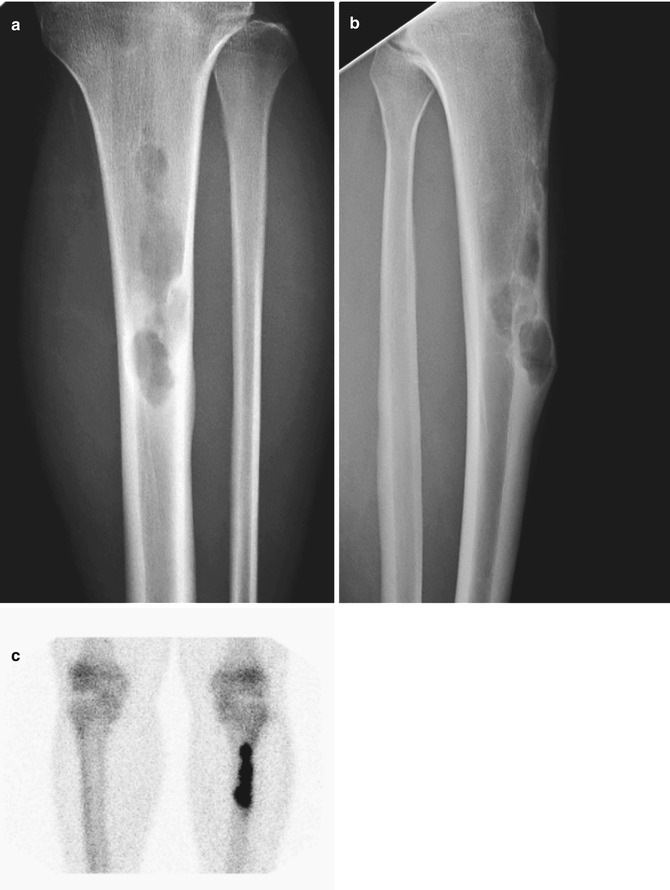
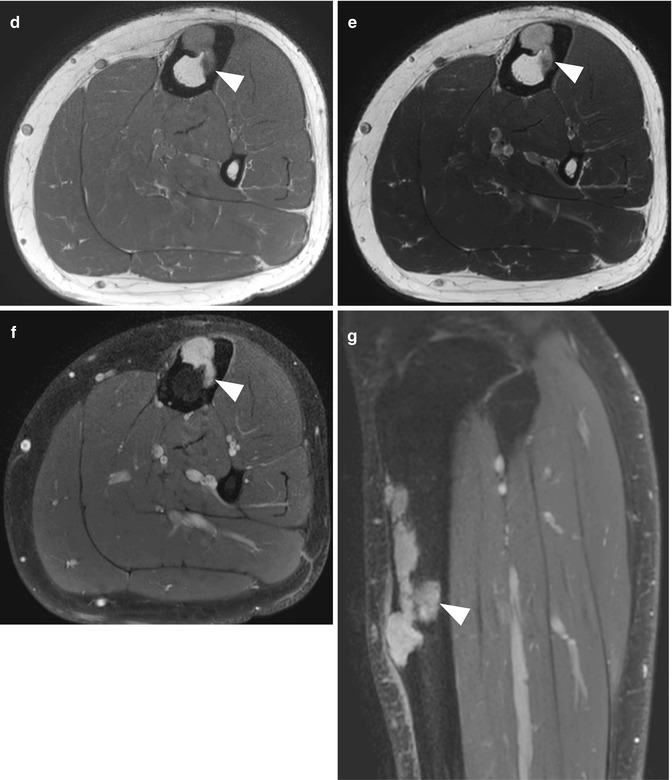


Fig. 8.12


Osteofibrous dysplasia. (a) Anteroposterior and (b) lateral radiographs show multiple well-defined osteolytic lesions along the anterior cortex of the tibia in a 17-year-old male. (c) Markedly increased uptake is noted on bone scan. (d) Axial T1-weighted image, (e) axial T2-weighted image, and (g) axial and (g) sagittal contrast-enhanced T1-weighted fat-suppressed images are shown. The lesion shows intermediate signal intensity on T1-weighted image, high signal intensity on T2-weighted image, and shows intense contrast enhancement. The lesion is predominantly intracortical in location, but minimal medullary extension is noted (arrowheads in d–g)
Stay updated, free articles. Join our Telegram channel

Full access? Get Clinical Tree


