, Joong Mo Ahn2 and Yusuhn Kang2
(1)
Department of Radiology, Seoul National University College of Medicine, Seoul National University Bundang Hospital, Seongnam, South Korea
(2)
Department of Radiology, Seoul National University, Bundang Hospital, Seongnam, South Korea
2.1 Osteoma
2.2 Bone Islands
2.3 Osteoid Osteoma
2.4 Osteoblastoma
2.5 Osteosarcoma
2.5.4 Small Cell Osteosarcoma
2.5.5 Parosteal Osteosarcoma
2.5.6 Periosteal Osteosarcoma
2.1 Osteoma
Overview
Osteoma is a benign slow-growing tumor composed entirely of osteoid tissue, representing a focal exaggeration of intramembranous bone formation, resulting in juxtacortical lesion. Histologically, an osteoma is usually a mixture of woven bone and dense lamellar bone, arising strictly from the cortex of the bone. Osteoma may or may not have Haversian systems.
Osteomas are usually small, and patients frequently have no symptoms. Lesions are often discovered as incidental findings on radiographs. Multiple osteomas are commonly associated with Gardner syndrome, which is a familial autosomal-dominant disorder characterized by multiple osteomas, intestinal polyposis, dentigerous cysts, epidermoid cysts, desmoid tumors, and skin fibromas.
Epidemiology
Osteomas occur twice as frequently in males as in females, and reported most frequently in the third and fourth decades.
Common Locations
An osteoma is most commonly found within the paranasal sinuses and the skull. However, it may also be found in the long bones, and has been described as appendicular osteoma. This rare entity is also termed parosteal osteoma or surface osteoma.
Imaging Features
Radiograph
An osteoma is a small, round, well-defined, homogeneous, bony surface lesion arising from the cortex (Fig. 2.1) and does not demonstrate the corticomedullary continuity seen in an osteochondroma. It demonstrates a density identical to cortex. Osteomas become more lobulated with increasing size. When an osteoma is composed primarily of compact bone, it will appear as a contour deformity of the cortex that blends with the surrounding cortical bone. When composed primarily of trabecular bone and marrow, the interface between the osteoma and adjacent bone will be more distinct.
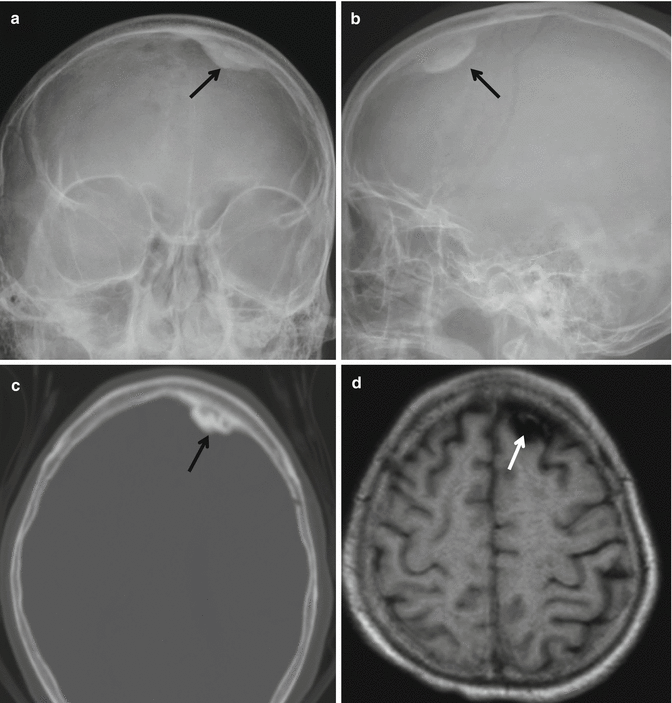
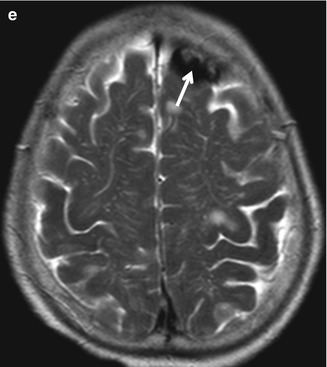


Fig. 2.1
Osteoma. (a) Anteroposterior radiograph of the skull shows a well-defined, homogeneous, bony surface lesion arising from the inner table of the left frontal bone (arrow). (b) Lateral radiograph of the skull shows a well-defined, homogeneous, bony surface lesion arising from the left frontal bone (arrow). (c) Corresponding axial CT scan shows an osteoma arising from the inner table of the left frontal bone (arrow). (d) Corresponding axial T1-weighted MR image demonstrates a hypointense osteoma from the inner table of the left frontal bone (arrow). (e) Corresponding axial T2-weighted MR image demonstrates a persistent hypointense osteoma from the inner table of the left frontal bone (arrow)
Magnetic resonance imaging
Osteomas follow the persistent low signal intensity characteristics of cortex on all MR pulse sequences (Fig. 2.1).
Differential Diagnoses
- 1.
Parosteal osteosarcoma
Differentiation of an appendicular osteoma from a parosteal osteosarcoma can be difficult both radiographically and histologically, because both lesions appear as ivory-like masses attached to bone surface. Osteomas have usually smooth borders and well-circumscribed, intensely homogeneous sclerotic appearance. In contrast, parosteal osteosarcoma may show a zone of decreased density at the periphery and usually appears less dense and homogeneous than osteoma.
- 2.
Osteochondroma
Osteochondroma can be differentiated by its corticomedullary continuity and cartilaginous cap.
- 3.
Myositis ossificans
A well-matured focus of myositis ossificans may occasionally mimic osteoma. Myositis ossificans shows a zonal phenomenon, characterized by a radiolucent area in the center of the lesion and a dense zone of mature ossification at the periphery.
2.2 Bone Islands
Overview
Bone island (enostosis) is defined as a focus of mature compact bone within the spongiosa. The lesion is typically asymptomatic and often an incidental finding on radiographs. Histologically, bone islands consist of dense intramedullary lamellar bone with normal Haversian canals, which blend in with the normal surrounding trabecular bone. A bone island may slightly fluctuate in size, but a growth of >25 % over 6 months is unusual. While the majority of bone islands range in size from 1 mm to 2 cm, the term giant bone island is given to those lesions larger than 2 cm.
Epidemiology
Although there is no gender or age preference, bone islands are unusual in children.
Common Locations
Bone islands are most commonly found in the axial skeleton, spine, pelvis, and ribs. In the long bones, they are usually located in the epiphysis or metaphysis.
Imaging Features
Radiograph
A bone island characteristically appears on conventional radiography and CT scan as densely sclerotic intramedullary focus (Fig. 2.2). Bone islands are round to oval, with the long axis of oval lesions paralleling the long axis of the affected bone. The surrounding cancellous bone which blends imperceptibly with the surface of the bone island provides a brush-like, spiculated, or thorny margin.
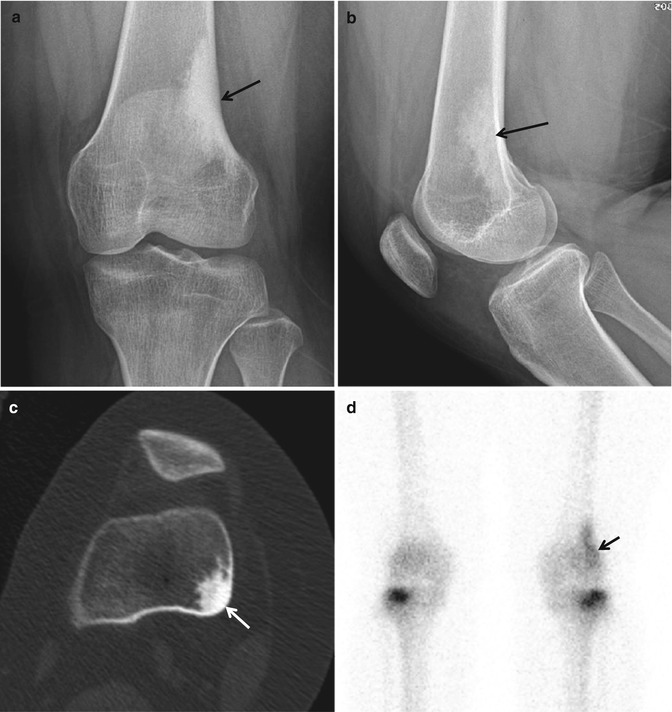
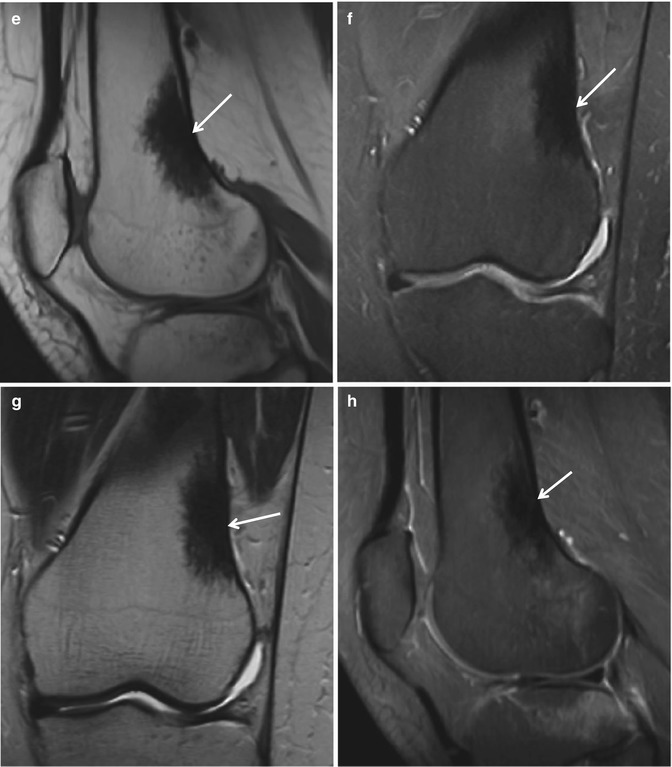


Fig. 2.2
Bone island. (a) Anteroposterior radiograph of the left femur shows a densely sclerotic intramedullary focus with thorny margin (arrow). The long axis of this focus is paralleling the long axis of the affected bone. (b) Lateral radiograph again shows a densely sclerotic focus with thorny margin (arrow). The long axis of this focus is paralleling the long axis of the affected bone. (c) Corresponding axial CT scan demonstrates a round sclerotic intramedullary focus (arrow). (d) Bone scan demonstrates increased uptake in the left distal femur (arrow). (e) Sagittal T1-weighted MR image shows low signal intensity (arrow). (F) Sagittal proton density-weighted MR image shows low signal intensity (arrow). (g) Coronal T2-weighted MR image again reveals low signal intensity (arrow). (h) Sagittal fat-suppressed contrast-enhanced T1-weighted MR image shows persistent low signal intensity
Magnetic resonance imaging
On MR imaging, a hypointense focus (Fig. 2.2) on all pulse sequences with a normal surrounding bone marrow is noticed. A bone island is usually inactive on bone scan. Further work-up is rarely necessary, and biopsy is generally not indicated.
Differential Diagnoses
- 1.
Osteoblastic metastasis
Metastatic lesion shows increased activity on bone scan (Fig. 2.3), and may demonstrate a halo of surrounding fluid-filled gap secondary to destruction of trabeculae on fluid-sensitive MR sequences.
- 2.
Sclerosing bone dysplasias
Multiple bone islands may be associated with sclerosing bone dysplasia such as osteopoikilosis (Fig. 2.4), osteopathia striata (Fig. 2.5), or melorheostosis. Osteopoikilosis consists of numerous circular or ovoid bone islands. Melorheostosis is characterized by long segments of cortical hyperostosis (Fig. 2.6).
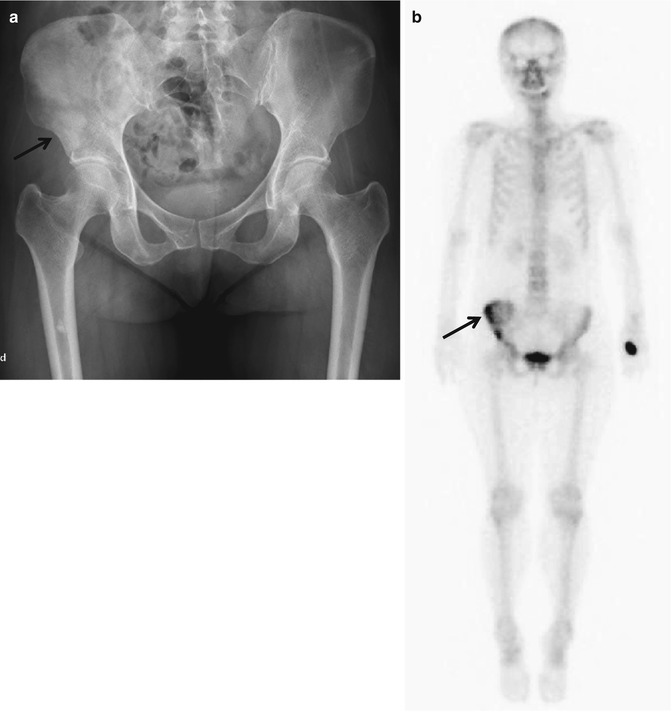
Fig. 2.3
Metastasis. (a) Anteroposterior radiograph of the pelvis shows sclerotic lesions in the right ilium (arrow). (b) Bone scan shows increased uptake in the right ilium (arrow)
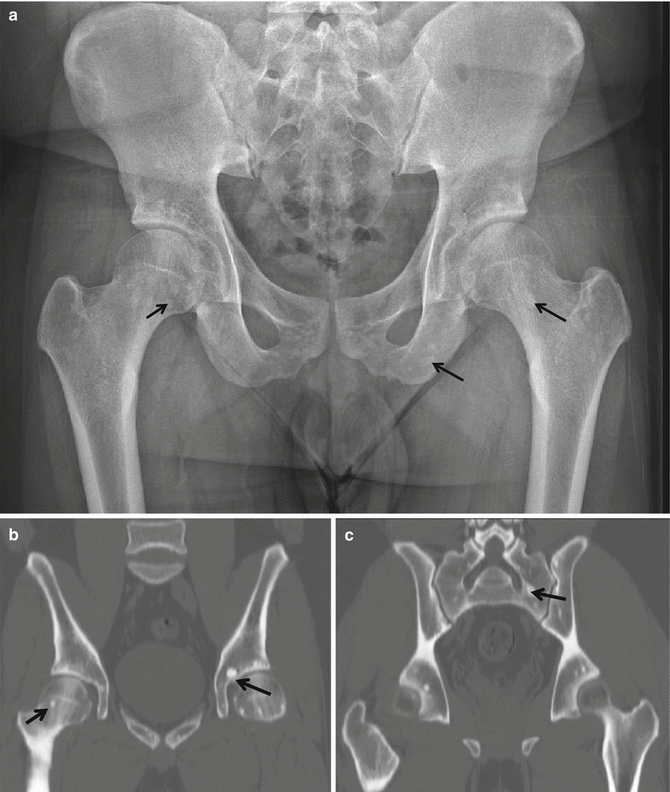

Fig. 2.4
Osteopoikilosis. (a) Anteroposterior radiograph of the pelvis shows multiple scattered sclerotic foci in the bony pelvis and bilateral proximal femurs (arrows). (b) Coronal reformatted CT scan shows scattered sclerotic foci in the bony pelvis, sacrum, and bilateral proximal femurs (arrows). (c) Coronal reformatted CT scan shows scattered sclerotic foci in the bony pelvis, sacrum (arrow), and bilateral proximal femurs. (d) Axial T1-weighted MR image reveals multiple scattered hypointense foci (arrow). (e) Axial T2-weighted MR image shows multiple scattered foci of persistent hypointensity (arrow)
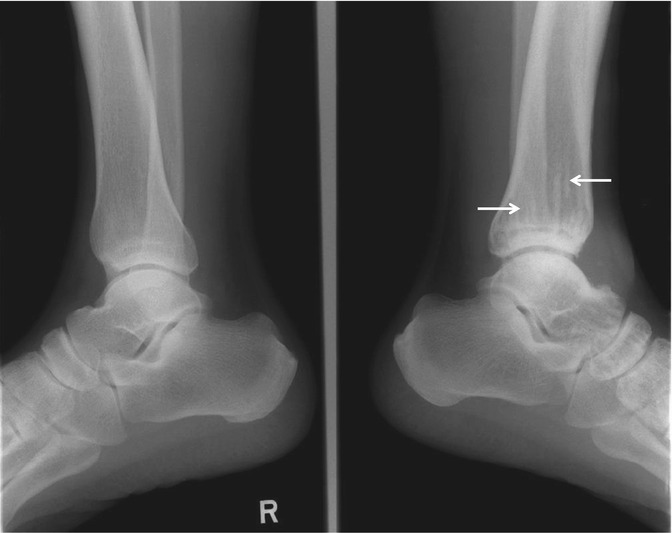
Fig. 2.5
Osteopathia striata. Lateral radiographs of the bilateral ankles show dense linear striations (arrows) in the diaphysis and metaphysis of the left tibia
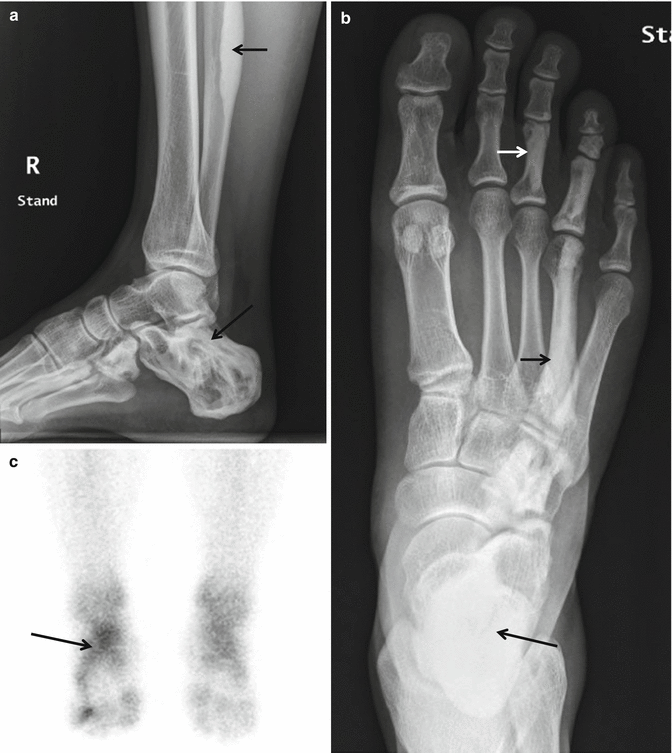
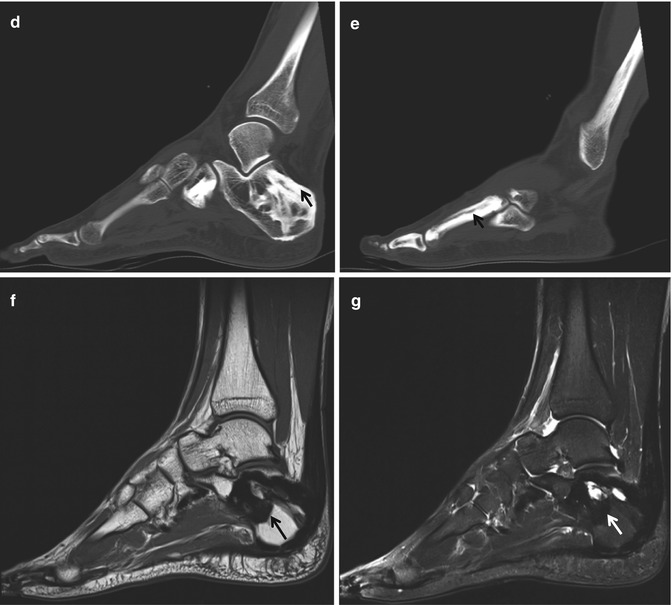
Fig. 2.6
Melorheostosis. (a) Lateral radiograph of the right ankle shows cortical and medullary hyperostosis in the right fibula and right calcaneus (arrows). (b) Standing anteroposterior radiograph of the right foot shows hyperostosis in the calcaneus, metatarsal, and phalanges of the right ankle and foot (arrows). A flowing dripping candle wax appearance is noted. (c) Bone scan shows increased uptake (arrow) in the right foot. (d) Sagittal reformatted CT scan shows hyperostosis in the tarsal bones (arrow). (e) Sagittal reformatted CT scan shows hyperostosis in the metatarsal. (f) Sagittal T1-weighted MR image reveals hypointense hyperostosis in the calcaneus (arrow). Thickening of the plantar fascia is also identified. (g) Sagittal fat-suppressed T2-weighted MR image again demonstrates hypointense hyperostosis in the calcaneus (arrow). Thickening of the plantar fascia is also identified
2.3 Osteoid Osteoma
Overview
Osteoid osteoma is a painful bony lesion of unknown cause. Pain, which can be worse at night, is usually relieved with nonsteroidal anti-inflammatory medication. The “nidus,” representing the actual lesion, is round to oval, and usually <1 cm in diameter, although its diameter ranges from 1 mm to 2 cm. The nidus is composed of osteoid and woven bone on a background of highly vascularized fibrous connective tissue. The nidus is usually a radiolucent focus, but may be calcified to a varying degree, and may be surrounded by sclerosis depending on the location within or along the bone. Very rare cases of multicentric or multifocal osteoid osteoma have been described.
Epidemiology
Osteoid osteoma is more common in males (2–3:1) and mostly affects patients between 5 and 25 years of age.
Common Locations
The cortical osteoid osteoma is the most common, and is usually located in the shaft of the long bones. Many osteoid osteomas arise in a tubular bone, possibly originate in a subperiosteal site, and later appear as an intracortical lesion. This site of origin appears to relate principally to continual remodeling of bone with subperiosteal deposition and endosteal erosion.
Imaging Features
Radiograph
The radiographic characteristics of osteoid osteoma depend on its location. The nidus appears as an osteolucent focus (Fig. 2.7), which may or may not have a dense central focus of mineralization (Fig. 2.8). In long bones, surrounding extensive fusiform sclerosis (Fig. 2.7) is the characteristic finding, representing both cortical and periosteal reaction. Intra-articular lesions may have no or only limited surrounding sclerosis, due to the inability of the intracapsular periosteum to produce proliferative and sclerotic new bone. Radiographs could be diagnostic of osteoid osteoma if the nidus can be identified. Thin section CT is best suited to depict the nidus (Fig. 2.9)
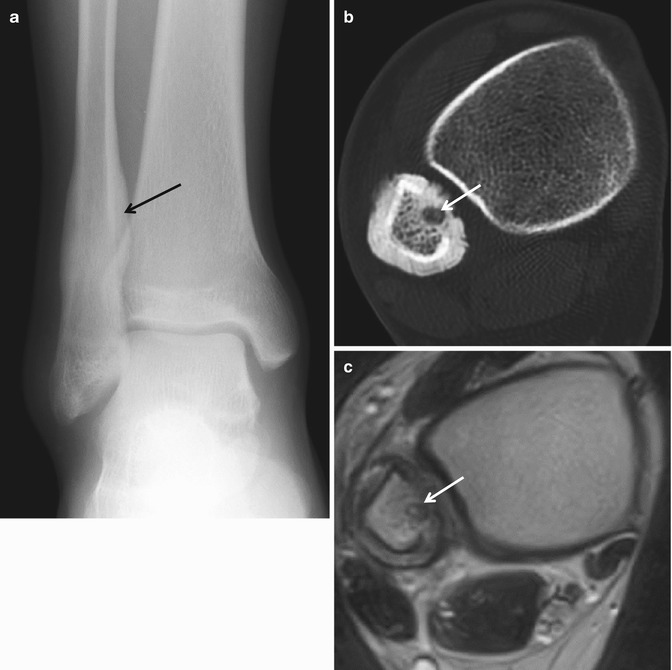
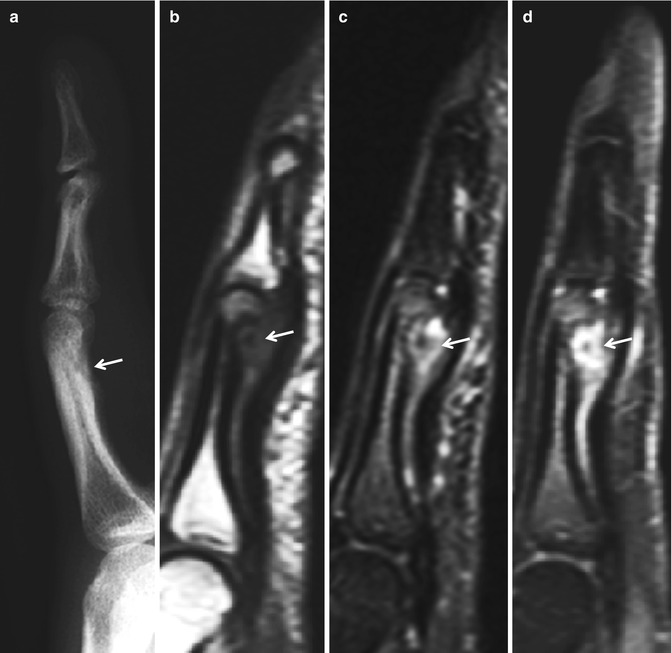
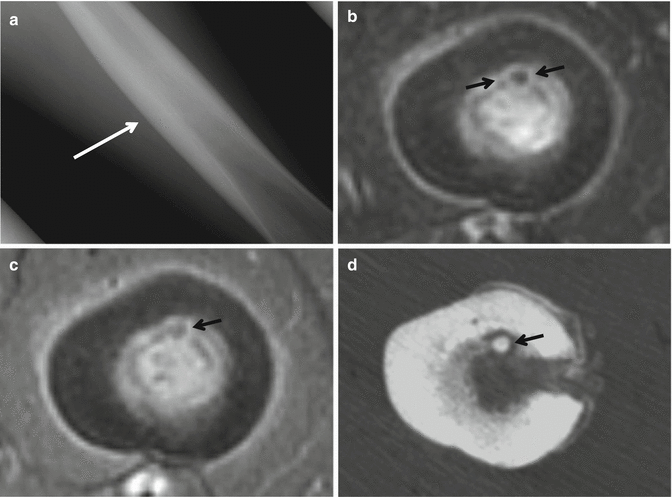

Fig. 2.7
Osteoid osteoma. (a) Anteroposterior radiograph of the right ankle shows thick solid periosteal reaction in the right distal fibula (arrow). (b) Corresponding axial CT scan demonstrates a round radiolucent focus (arrow) in the cortex of the right distal fibula. Periosteal reaction is also identified. (c) Axial T2-weighted MR image reveals increased signal intensity of the nidus (arrow)

Fig. 2.8
Osteoid osteoma. (a) Lateral radiograph of the right index finger shows a juxtacortical osteolytic lesion with a mineralized focus (arrow) in the volar portion of the proximal phalanx. (b) Sagittal T1-weighted MR image shows a nidus with intermediate signal intensity and central hypointense focus (arrow) in the volar aspect of the middle phalanx. (c) Sagittal T2-weighted MR image reveals a hyperintense nidus with a central hypointense focus correlating to the mineralization noted within the nidus (arrow). Edema is noted in the surrounding soft tissue and bone marrow. (d) Sagittal fat-suppressed contrast-enhanced T1-weighted MR image shows the intensely enhancing nidus with central hypointensity due to mineralization (arrow)

Fig. 2.9
Osteoid osteoma. (a) Anteroposterior radiograph of the left femur shows cortical thickening (arrow). (b) Axial T2-weighted MR image shows a hyperintense nidus (arrow) with central mineralization noted as a focus of hypointensity. (c) Axial fat-suppressed contrast-enhanced T1-weighted MR image shows a minimal enhancement of the nidus (arrow). (d) Corresponding axial CT scan demonstrates mineralized nidus (arrow)
Magnetic resonance imaging
The intense bone marrow edema (Fig. 2.8) adjacent to the nidus is typical finding. The nidus may easily be overlooked with MR imaging depending on its size and the degree of mineralization. An intra-articular lesion may be masked by reactive changes in the surrounding tissue (Fig. 2.10).
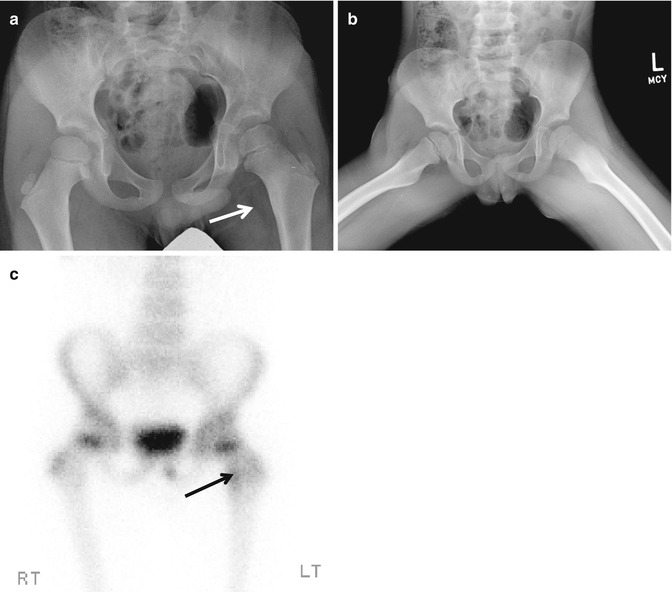
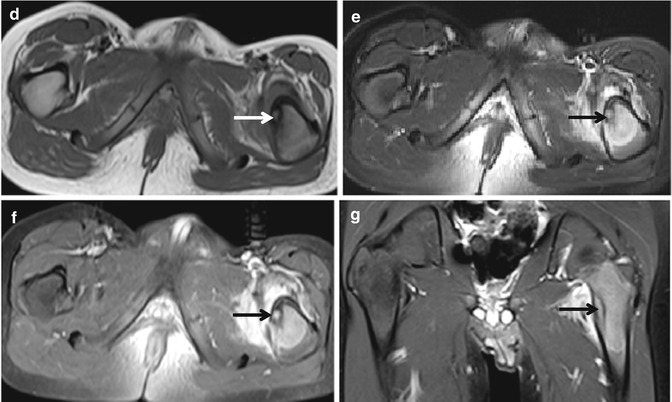


Fig. 2.10
Osteoid osteoma. (a) Anteroposterior radiograph of the pelvis shows an area of subtle sclerosis (arrow) about the lesser trochanter of the left femur. (b) Frog leg lateral view shows a similar finding. (c) Bone scan shows increased uptake (arrow) in the medial portion of the left proximal femur. (d) Axial T1-weighted MR image shows a focus of intermediate signal intensity (arrow). (e) Axial T2-weighted fat-suppressed MR image shows an increased signal intensity of nidus with surrounding edema (arrow). (f) Axial contrast-enhanced T1-weighted fat-suppressed MR image demonstrates an enhanced nidus (arrow) with pronounced surrounding edema. (g) Coronal fat-suppressed contrast-enhanced T1-weighted MR image again reveals an enhanced nidus (arrow) with pronounced surrounding edema
Differential Diagnoses
- 1.
Stress fracture
When the nidus cannot be seen on radiographs, the differential diagnosis includes the lesions that can be associated with intense, benign-appearing new bone formation, such as stress fracture. The radiolucency associated with a stress fracture is usually more linear than in osteoid osteoma, and it runs perpendicular or at an angle to the cortex rather than parallel to it.
- 2.
Brodie abscess
Although a bone abscess may have a similar radiographic appearance to osteoid osteoma, bone abscess can usually be differentiated by a linear, serpentine tract extending from the abscess cavity toward the closest growth plate.
- 3.
Toxic and inflammatory synovitis
Toxic and inflammatory synovitis can be considered in the differential diagnosis for the intra-articular lesions.
2.4 Osteoblastoma
Overview
Osteoblastoma is a rare osteoid-forming tumor, which is indistinguishable from the osteoid osteoma on routine histological analysis, and is differentiated from osteoid osteoma on the basis of the tumor size (2 cm or larger) and a lack of response to nonsteroidal anti-inflammatory drugs. Osteoblastoma presents with a dull ache and possible swelling that may not be worse at night.
Approximately 16 % of osteoblastomas have components of aneurysmal bone cyst. Aggressive-appearing inflammatory variants have been described. A malignant transformation into an osteosarcoma is rare.
Epidemiology
The patients are usually younger than 30 years of age, and the lesion is twice as common in males as females.
Common Locations
The common locations are the spine, particularly the posterior elements, and long bones. In most cases in long bones, an eccentric location in the diaphysis or metaphysis is noted. Although osteoblastomas are usually intramedullary lesions, an intracortical location is not uncommon.
Imaging Features
Radiograph
Three distinct types of osteoblastomas can be identified on radiographs.
Osteoblastoma may be similar to osteoid osteoma, although much larger in size, greater than 1.5–2 cm in diameter. This is termed a giant osteoid osteoma. This type occasionally exhibits less reactive sclerosis than osteoid osteoma, but the periosteal reaction is possibly more prominent.
Osteoblastoma may appear as a blow-out expansive lesion with small central calcification and peripheral sclerotic rim similar to an aneurysmal bone cyst. This pattern is particularly common in spinal osteoblastoma.
Osteoblastoma may also appear as an aggressive lesion with osseous expansion, partial cortical disruption, and soft tissue infiltration, simulating a malignant neoplasm. This is more common in long bones. Aggressive osteoblastomas belong to this group.
Magnetic resonance imaging
MR imaging may show reactive marrow edema in the surrounding bone, usually less than with osteoid osteoma, with a variable degree of increased T2 signal intensity depending on matrix mineralization and cellularity of the lesion. MR imaging optimally depicts the effects of the tumor on adjacent structures and surrounding soft tissues. The extensive peritumoral edema-like signal can be helpful in suggesting the diagnosis in equivocal case.
Differential Diagnoses
- 1.
Osteoid osteoma
Distinction of osteoid osteoma from osteoblastoma can be very difficult.
- 2.
Bone abscess
Bone abscess can usually be differentiated by a linear, serpentine tract extending from the abscess cavity toward the closest growth plate.
- 3.
Osteosarcoma
Aggressive osteoblastoma should be differentiated from osteosarcoma. CT and MR imaging are helpful in making the distinction by demonstrating the soft tissue component of osteosarcoma.
2.5 Osteosarcoma
Osteosarcoma is histologically composed of mesenchymal stem cells and characterized by production of osteoid matrix. Osteosarcoma is the most common primary nonhematological bone malignancy and is the most common primary bone malignancy in children and adolescents. There are various subtypes of osteosarcoma, and can be classified as intramedullary (low-grade, conventional, telangiectatic, small cell), juxtacortical (parosteal, periosteal, high-grade surface), or secondary lesions. Juxtacortical (surface) osteosarcoma refers to osteosarcoma originating from the surface of bone, and is classified into three main subtypes – parosteal, periosteal, and high-grade surface osteosarcoma. Juxtacortical osteosarcoma accounts for 4–10 % of all osteosarcomas. Conventional osteosarcoma and secondary osteosarcoma are histologically indistinguishable.
2.5.1 Low-Grade Central Osteosarcoma
Overview
Low-grade central osteosarcoma is composed of a microtrabecular osseous matrix in a bland fibrous stroma with a variable amount of bone production. The prognosis for patients with low-grade central osteosarcoma is substantially better than that for patients with conventional osteosarcoma.
Epidemiology
Low-grade central osteosarcoma (well-differentiated, sclerosing) accounts for 1–2 % of all osteosarcomas. This condition occurs in the third and fourth decades of life and is seen equally in men and women.
Common Locations
Low-grade central osteosarcoma commonly occurs within the medullary canal of the distal femur and proximal tibia.
Imaging Features
Radiograph
Low-grade central osteosarcoma may show well-defined margins, a sclerotic rim (Fig. 2.11), prominent internal trabeculation, and diffuse sclerosis (Fig. 2.12), and it may cause expansile remodeling of bone. However, radiographic evidence of a more aggressive process, such as associated bone lysis, focally indistinct margins, cortical destruction, and soft tissue mass can be seen.

