, Joong Mo Ahn2 and Yusuhn Kang2
(1)
Department of Radiology, Seoul National University College of Medicine, Seoul National University Bundang Hospital, Seongnam, South Korea
(2)
Department of Radiology, Seoul National University, Bundang Hospital, Seongnam, South Korea
5.1 Giant Cell Lesion of the Small Bones
Overview
Giant cell lesion of the small bone (GCLSB) is not a neoplastic condition, but a reactive process consisting of hemorrhage, fibroblasts, multinucleated giant cells, and reactive bone formation. It is more commonly known as giant cell reparative granuloma (GCRG). The term giant cell reparative granuloma originates from a report by Jaffe (1953), in which he describes lesions of the jaw formed in response to traumatic intraosseous hemorrhage. The mandible and maxilla are known to be the most common locations of GCRG, but we will limit our discussion to lesions that occur in the small bones of hand and feet (GCLSB).
Epidemiology
GCLSB is most common in the first and second decades of life, and 74 % of the reported patients are under the age of 30 years at the time of presentation. It does not have a predilection for a certain gender and is equally distributed between the sexes.
Common Locations
GCLSB affects the phalanges of the hand, metacarpal, metatarsal, carpal, and tarsal bones, in decreasing order of frequency. Within a given small bone, it most commonly involves the metaphysis with or without extension to the diaphysis. Unlike GCT, it rarely extends to the epiphysis.
Imaging Features
Radiograph
GCLSB typically appears as a meta(dia)physeal osteolytic lesion with expansile remodeling in the small bones of hands and feet. The cortex undergoes expansile remodeling and is thinned but not destroyed, and periosteal reaction is usually absent. It may accompany internal trabeculation and mineralization on radiography.
Magnetic resonance imaging
GCLSBs usually appear as solid lesions without cystic changes. It has been reported to exhibit intermediate signal intensity on T1-weighted images and heterogeneous hyperintensity on T2-weighted images.
Differential Diagnoses
- 1.
Giant cell tumor
Giant cell tumors rarely occur in the small bones of the hands and feet. They differ from GCLSB in that they extend to the epiphysis and lack intralesional mineralization.
- 2.
Aneurysmal bone cyst
GCLSBs are thought to be solid counterparts of aneurysmal bone cysts. The solid parts of aneurysmal bone cysts are histopathologically similar to GCLSB. On imaging, aneurysmal bone cysts can be differentiated from GCLSB, due to the presence of multiple fluid–fluid levels.
- 3.
Enchondroma
The most common bone tumor of the hands and feet is enchondroma. It may be differentiated from GCLSB by the presence of typical ring-and-arc pattern of chondroid mineralization.
- 4.
Other osteolytic lesions such as glomus tumors and epidermal inclusion cysts that affect the distal phalanx may need to be considered for differential diagnoses.
5.2 Giant Cell Tumor of Bone
Overview
Giant cell tumor (GCT) of bone is generally a benign tumor that falls into the category of “osteoclastic giant cell-rich tumors.” It is histologically characterized by the presence of multinucleated giant cells in a background of mononuclear stromal cells. It frequently occurs at the ends of long bones in skeletally mature patients. Although it is categorized as a benign lesion, GCT may be locally aggressive and may exhibit destructive features on imaging, may locally recur after surgical resection (15–50 % after curettage), and may also metastasize to the lung (2 % of cases). Malignant GCTs are rare, but do exist, accounting for approximately 2 % of all cases of GCT.
Epidemiology
GCT is a relatively common benign bone tumor, accounting for about 15–20 % of benign bone tumors and 3–5 % of all primary bone tumors. The peak age of presentation is the third decade, with most cases occurring between 20 and 40 years of age. They rarely occur in skeletally immature patients or in patients over the age of 50 years. GCTs have a slight female predilection with a male to female ratio of 1.5–2:1.
Common Locations
GCTs are most commonly found at the end of long bones (60 % of cases affect the long bone), with a majority of cases involving the distal femur, proximal tibia, distal radius, and proximal humerus. They originate in the metaphysis and extend into the epiphysis resulting in a metaepiphyseal location. GCT rarely occurs in the axial skeleton and flat bones, but among the vertebrae, the sacrum is most commonly affected. In flat bones, they appear at apophyses, which is an epiphyseal equivalent (refer to part 1 for more detail on apophyses). Giant cell tumors may occur secondary to Paget’s disease, and in this case, they may exhibit multiplicity.
Imaging Features
Radiograph
A typical GCT appears as an eccentric osteolytic lesion with a nonsclerotic well-defined border at the metaepiphysis of a long bone that is skeletally mature (Fig. 5.1). It frequently expands the cortex, and usually does not accompany periosteal reaction (Fig. 5.2). Usually, little or no matrix mineralization is seen within the tumor. Infrequently, GCTs may show thickened trabeculation along the periphery of the lesion, exhibiting a soap-bubble appearance (Fig. 5.2). Atypical cases may show more aggressive features with a wide zone of transition and cortical destruction. These aggressive features are more frequently found in bones with a small caliber, such as the fibula or ulna. The radiograph findings of lesions arising from the apophyses are identical to those arising in long bones (Figs. 5.3 and 5.4).
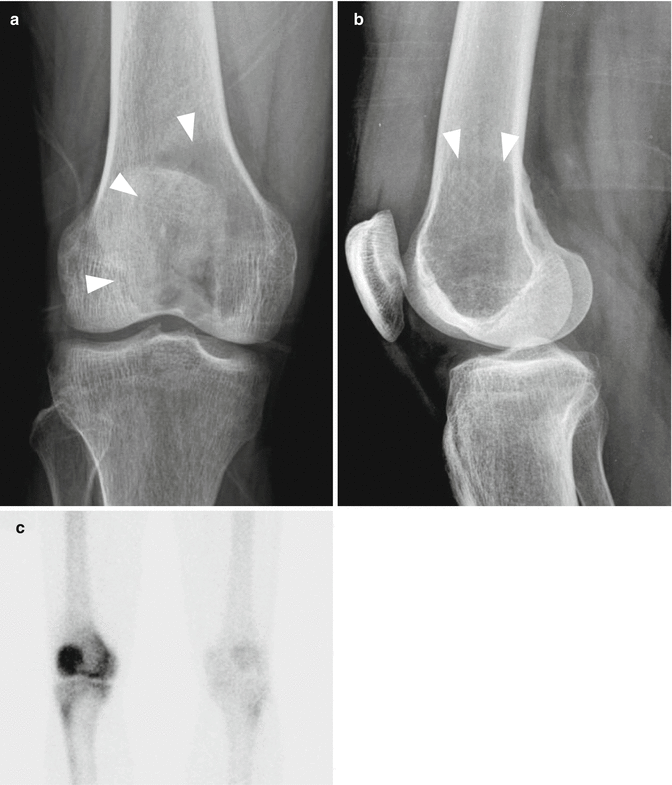
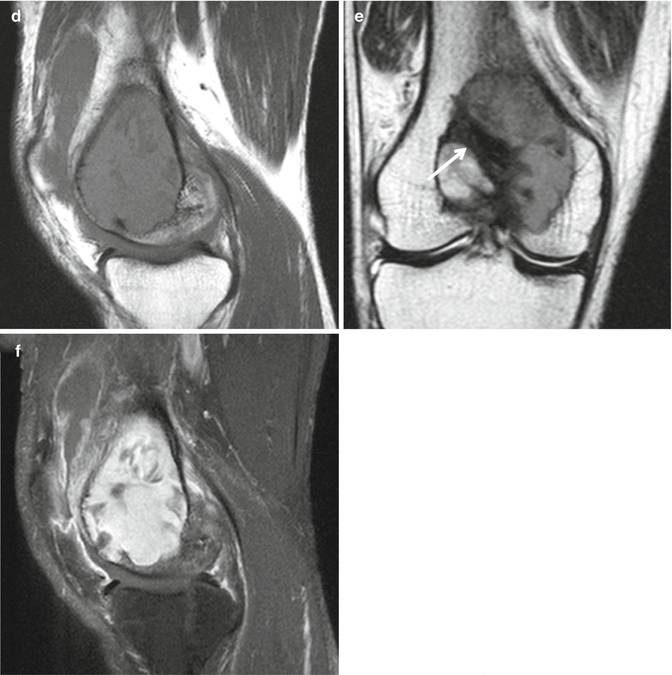


Fig. 5.1


Giant cell tumor in the distal femur. (a) Anteroposterior and (b) lateral radiographs of the right knee show a geographical osteolytic lesion without a sclerotic rim (arrowheads) at the distal epimetaphysis of the femur in a 31-year-old male. (c) Bone scan shows increased uptake in the right distal femur. On magnetic resonance imaging, the lesion shows intermediate signal intensity on sagittal T1-weighted image (d), heterogeneous on coronal T2-weighted image (e), and enhances intensely on sagittal T1-weighted fat-suppressed image acquired after administration of gadolinium-based contrast agent (f). Low signal intensity areas noted on T2-weighted image (arrow in e) are attributable to the hemosiderin deposition related to the extravasated erythrocytes in the tumor and the phagocytic function of the tumor cells
Stay updated, free articles. Join our Telegram channel

Full access? Get Clinical Tree


