Fig. 17.1
Relationship between age and hormones. This figure shows mean hormone values at 5-year age bands with 95% confidence interval (shaded area) in 3220 European men. Mean hormone values with increasing age were interpolated to approximate the age trend. Total testosterone (T) and free T levels were significantly lower and luteinizing hormone (LH) and sex hormone-binding globulin (SHBG) was significantly higher in the older age groups. There was an apparent inflection point around 70 years for LH. This figure is reproduced from Wu et al. [1] with permission from Endocrine Society
Diagnosis of Late-Onset Hypogonadism (LOH) in Aging Men
Given the age-related decline in T levels, it is unfortunate that age-specific population reference ranges for T are not widely available. T thresholds for diagnosis are based on the reference intervals of healthy and young men [29], or their association with specific symptoms [30]. Hence, the cut-points for partitioning hypogonadal from eugonadal older men (and indeed eligibility for reimbursement) remain controversial, relying mostly on opined recommendations [31] and consensus statements of various professional societies [32–34] that, not surprisingly, do not completely agree with each other (Table 17.1). For example, the International Society of Andrology (ISA), the International Society for the Study of Aging Male (ISSAM), the European Association of Urology (EAU), the European Academy of Andrology (EAA) and the American Society of Andrology (ASA) recommended the diagnosis of LOH when total T is below 8 nmol/L or within 8 and 12 nmol/L, if free T is below 225 pmol/L [32]. The EAU, however, suggests the threshold of 243 pmol/L for free T [34]. The Endocrine Society indicates a threshold between 9.8 and 10.4 nmol/L for total T, and for free T between 170 and 310 pmol/L while acknowledging that agreement on T thresholds is problematic and not truly evidence based [33]. There is agreement, however, on the requirement for two separate measurements of T for diagnosing LOH, based on the finding that subnormal T levels are not confirmed in almost 30% of repeat measurements [35]. Moreover, morning T levels are recommended (7.00–11.00 am) [32–34] because serum T exhibits a diurnal rhythm with peak levels in the morning [36].
Table 17.1
Clinical features of androgen deficiency and guidelines of the International Society of Andrology (ISA), International Society for the Study of Aging Male (ISSAM), European Association of Urology (EAU), European Academy of Andrology (EAA), American Society of Andrology (ASA) [32], the Endocrine Society [33], and the EAU [34]
ISA, ISSAM, EAU, EAA, and ASA [32] | Endocrine Society [33] | EAU [34] | |
|---|---|---|---|
Testosterone thresholds | |||
Total testosterone | 8 nmol/L 8–12 nmol/L: measurement of free T is recommended | 10.4 nmol/L | 8 nmol/L 8–12 nmol/L: measurement of free T is recommended |
Free testosterone | 225 pmol/L | 170–310 pmol/L: suggested in men with total T near to the lower limit of normal range and in those with suspected alterations of SHBG | 243 pmol/L |
Symptoms and signs | |||
Primary and secondary sexual characteristics | Gynecomastia and breast discomfort Testis hypotrophy Infertility Oligo-azoospermia | Gynecomastia Small testes Male-factor infertility | |
Reduced body hair and frequency of shaving | |||
Hot flushes, sweats | Decreased body hair | ||
Mild anemia | Hot flushes | ||
Sexual | Low libido | Reduced sexual desire Reduced sexual activity | Reduced sexual desire Reduced sexual activity |
Erectile dysfunction | Erectile dysfunction | ||
Decreased spontaneous morning erections | Fewer and diminished nocturnal erections | ||
Psychological | Decreased vitality | Decreased energy Decreased motivation Decreased initiative Decreased self-confidence | Fatigue |
Depressed mood | Depressed mood Feeling sad or blue Dysthymia Poor concentration and memory | Changes in mood | |
Sleep disturbance Increased sleepiness | Sleep disturbances | ||
Anger Diminished cognitive function | |||
Bone | Height loss | ||
Low trauma fracture | Low trauma fractures | ||
Decreased bone mineral density Osteoporosis | Low bone mineral density | Decrease in bone mineral density (osteoporosis) | |
Body composition and metabolic disorders | Decreased muscle strength Decreased muscle mass | Reduced muscle bulk and strength Diminished physical or work performance | Decrease in lean body mass and muscle strength |
Increased body fat | Increased body fat | Visceral obesity Metabolic syndrome Insulin resistance and type 2 diabetes mellitus | |
A further important issue is the method of T measurement. The most commonly used for clinical practice are platform-based immunoassays, but their accuracy and precision for T immunoassays have been questioned, especially at the low levels in children, women and severely hypogonadal men [37–40]. Liquid chromatography–tandem mass spectrometry (LC-MS/MS) is now considered the gold standard for steroid measurement, but its costs and technical demands do not make it universally available for routine clinical practice. With improved quality control and methodological stringency, immunoassays are capable of providing T results in good agreement with LC-MS/MS in men [41]. Assessment of free T (non-protein-bound fraction of T) remains a controversial aspect of the biochemical evaluation of gonadal status, and its direct measurement is burdened with even more challenging analytical issues than for total T. The usefulness of evaluating free T arises from the “free hormone hypothesis” which suggests that only free unbound hormones are biologically active in target tissues. This hypothesis, though widely accepted in clinical practice, has not to date been corroborated by robust experimental evidence. In addition, there is also some evidence that T bound to SHBG can be internalized into cells by endocytosis through megalin protein [42], thus suggesting the possibility of a direct biological action also for protein-bound T. How to assess free T is also a matter of debate. The gold standard is measurement of free T by equilibrium dialysis, a technique that is expensive, time-consuming and not widely available. Alternative methods of measurement based on a labeled T analogue are unreliable and should not be used [43]. To circumvent these methodological issues, algorithms for calculating free T, based on the law of mass action and binding stoichiometry, have been introduced by Vermeulen [44], Södergård [45], Mazer [46] and Zakharov [47]. Other equations, published by Nanjee [48], Ly [49] and Sartorius [50], are empirical estimates obtained through statistical extrapolation to laboratory FT measurements by equilibrium dialysis. The equations based on the law of mass action are strongly dependent on the association constant (K a ) for binding of T to SHBG and albumin. However, various K a are used in different methods [44, 45, 51, 52], so that these equations carry intrinsic systematic errors based on their assumptions. Furthermore, their reliability is dependent on the accurate determination of total T and SHBG [53]. A study comparing the results of free T obtained by different equations based on the law of mass action (Vermeulen and Södergård) [44, 45] found that these equations systematically overestimate the value obtained by equilibrium dialysis [54]. The small overestimation of percentage free T may be attributed to errors in the measurement of T and SHBG with immunoassays, incorrect T-binding stoichiometry for SHBG, or the use of different K a values [50]. Equations based on empirical assessment of free T may demonstrate better accuracy, but their applicability and transportability to different laboratories using different methods of hormone measurement is problematic. Despite the small systematic error associated with the mass action equations, a very high agreement between the calculated and the measured free hormone has been consistently found [44, 49, 55, 56]. Thus, despite the systematic, but nonetheless predictable, overestimation, the widespread application, accumulated credible clinical experience for more than 25 years, and convenience of the mass action calculations make it an acceptable method currently for evaluating free T in clinical practice until better alternatives are available. Accordingly, the U.S. Endocrine Society’s Expert Panel states that the use of equations based on the law of mass action provides the best approach for the estimation of free T concentration [57].
Based on these considerations, pending further studies demonstrating the clinical applicability of free T in the assessment of the androgenic status in men, total T measured by reliable methods, is still favored for the initial assessment and diagnosis of hypogonadism in men [57, 58]. However, recent data from EMAS showed that men with low total T levels do not have symptoms and signs of androgen deficiency if free T is normal, but when free T is low, even when total T is in the normal range, symptoms and signs of androgen deficiency are prevalent [59]. These results support the pivotal importance of measuring free T in conditions associated with alterations in SHBG levels, such as obesity or T2DM (low SHBG), or HepC or alcoholic liver cirrhosis, HIV infection or use of certain anticonvulsants (high SHBG) [32–34]. In these situations, the measurement of free T is essential for the accurate identification of LOH and to minimize its over-diagnosis [32–34].
Besides the uncertainty of T thresholds for hypogonadism in the elderly, the lack of precise knowledge on specific clinical features or consequences arising from pathologically low T levels in older men makes the diagnosis of LOH ever more challenging. Recommendations from professional societies require that the diagnosis of LOH requires low T levels together with androgen deficiency symptoms [32–34] (Table 17.1). However, symptoms of androgen deficiency are generally non-specific and overlap substantially with those of aging, depression and ill health. An attempt to create a working definition of LOH was based on the strength of the association between low T levels and the presence of symptoms [30]. After considering a large set of possible symptoms of hypogonadism, the presence of three sexual symptoms (i.e., erectile dysfunction, decreased sexual desire and impaired morning erections) was found to form a strong syndromic clustering with low T. Accordingly, LOH was defined as the simultaneous presence of erectile dysfunction, decreased sexual desire, and impaired morning erections in men with total and free T below 11 nmol/L and 220 pmol/L, respectively [30]. The specificity of sexual symptoms, but not physical and psychological ones, to low T, has been confirmed in the longitudinal extension of the EMAS, which showed that the fall of total T into the hypogonadal range during 4.3 years of follow-up is associated with the development of new sexual symptoms or the worsening of those already present at baseline [60]. Interestingly, testosterone replacement therapy (TRT), compared to placebo in 800 older hypogonadal men in a randomized clinical trial (RCT), has recently been shown to improve sexual symptoms, with variable to negative results on physical and psychological outcomes [61]. Another RCT, involving more than 700 adult men (>18 years of age) receiving T gel or placebo for 3 months, showed that TRT improved sexual symptoms, but not energy level or mood [62].
LOH, as defined by low T and three sexual symptoms, has an overall population prevalence of 2.1% [30]. The prevalence increases with age, BMI, and comorbidity (Fig. 17.2) [30]. This prevalence is much lower than that reported (5.6 and 12%) in other surveys of similar populations [25, 63], presumably due to the inclusion of less stringent or specific clinical features.
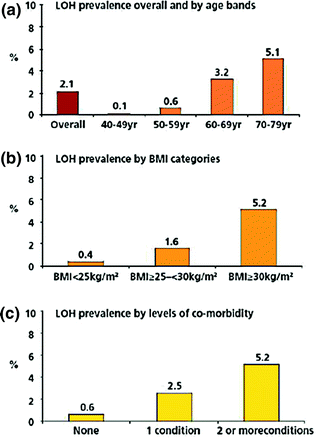

Fig. 17.2
Prevalence of the late-onset hypogonadism (LOH) in EMAS, as defined by at least three sexual symptoms and total testosterone levels of <11 nmol/L and free testosterone of <220 pmol/L, overall and stratified by age (a), body mass index [BMI; Panel (b)] and comorbidity (c). The figure is reproduced from Wu et al. [30] with permission from Massachusetts Medical Society
Obesity-Related Testosterone Decline and Potential Underlying Mechanisms
HPT Axis Dysfunction
Obesity, independently of age, is probably the most important condition associated with low T in men. This is an increasingly common clinical problem due to the rapidly rising prevalence of obesity. In a number of population-based studies [1, 15, 24, 27], obesity, independently of age, was associated with a substantial decrease in both total and free T levels. In the EMAS population, the mean total and free T in obese (BMI ≥30) men was about 5 nmol/L and 55 pmol/L lower, respectively [1], compared to the non-obese, approximating to a 15-year difference in age-stratified T distribution (Fig. 17.3). In contrast to the age-related decline, the fall in T in obese men is not accompanied by a compensatory rise in LH (Fig. 17.3) [1]. This pattern is consistent with secondary hypogonadism suggesting a derangement in HPT axis at the central level (hypothalamus-pituitary).
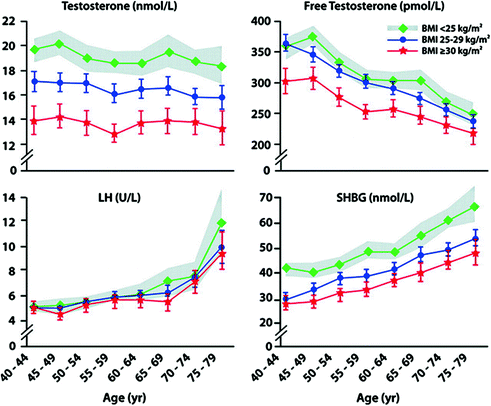

Fig. 17.3
Relationship between age, body mass index (BMI), and hormones. The EMAS cohort was stratified according to BMI into three groups: non-obese (BMI <25 kg/m2), overweight (BMI ≥25 to <30 kg/m2), and obese (BMI ≥30 kg/m2). Mean (95% confidence interval in shaded area and vertical lines) total and free testosterone (T) and sex hormone-binding globulin (SHBG) were significantly lower in the overweight and obese at all ages, compared with non-obese. The total T and SHBG age trends in the three BMI categories were similar (indicating no interaction between BMI and age); the free T age trend in the obese group was less steep than in the other two groups (indicating an interaction between BMI and age). Mean LH was not significantly different among the three groups at the median age of 60 years. LH was higher in the older than 70 years non-obese, compared with the overweight and obese groups, due to a negative BMI age interaction. This figure is reproduced from Wu et al. [1] with permission from Endocrine Society
The finding of T rising after weight loss offers evidence supporting the causative role of obesity for hypogonadism rather than the reverse [15]. A meta-analysis of the available RCTs has shown that, in obese men, weight loss, obtained with either low calorie diet or bariatric surgery, was associated with a significant increase in total and free T levels as well as gonadotropins [64] (Table 17.2). The improvement in hormone profile was proportionate to the extent of weight loss, thus demonstrating an apparent graded effect of weight loss on gonadal function [64]. Interestingly, the weight loss-related T increment was attenuated in older men [60, 64], exemplifying the multiple mechanisms at play in the aging HPT axis [vide supra]. Increased body fat and deterioration in health as well as age contribute to the suppression of HPT axis function at multiple levels, resulting in lower T in older men.
Table 17.2
Mean weighted differences and 95% confidence intervals of hormone levels before and after intentional weight loss obtained with low calorie diet or bariatric surgery
Mean difference between post and pre-treatment | p | |
|---|---|---|
Total testosterone (nmol/L) | ||
Low calorie diet | 2.87 (1.68–4.07) | <0.0001 |
Bariatric surgery | 8.73 (6.51–10.95) | <0.0001 |
Free testosterone (pmol/L) | 72.73 (41.86–103.60) | <0.0001 |
SHBG (nmol/L) | 14.49 (10.04–18.94) | <0.0001 |
LH (U/L) | 1.33 (0.75–1.91) | <0.0001 |
Obesity is not a mechanism, and the precise mechanism(s) by which obesity can suppress HPT axis function and induce hypogonadism is largely unknown. A preponderant role is attributed to the expansion of visceral adipose tissue, a source of many signaling molecules that can disrupt function and metabolism at multiple sites. Some of the most important are discussed below.
Leptin
Leptin is a peptide produced by adipose tissue (adipokine) whose circulating levels change according to nutritional status, being directly correlated with the amount of fat mass [65]. Leptin is involved in several functions, such as insulin sensitization, regulation of the balance between hunger and satiety, and hypothalamic–pituitary–gonadal function [66, 67]. Leptin signaling is one candidate to explain the link between nutritional status and gonadal function [68]. Animal models of leptin deficiency are characterized by hypogonadotropic hypogonadism with lack of pubertal development [69]. In women with hypothalamic amenorrhea induced by excessive physical exercise, or the weight loss of anorexia nervosa, low leptin levels are associated with gonadotropin deficiency [70], and treatment with exogenous leptin is able to increase LH pulse frequency and amplitude as well as improve ovarian function [71]. However, in obese subjects, leptin is increased, in the presence of hypogonadotropic hypogonadism, suggesting possible leptin resistance [72–74]. GnRH neurons lack leptin receptors [75, 76], and the effect of leptin on GnRH secretion is thought to be mediated via kisspeptin neurons, which express leptin receptors [77]. In support of the role of Kiss1 neurons as mediators of leptin action, ob/ob mice (carrying inactivating mutations of the leptin gene) have a lower hypothalamic expression of kisspeptin mRNA that is increased by the administration of leptin [77]. Furthermore, the intra-cerebroventricular administration of kisspeptin in pubertal rats pre-treated with an anti-leptin antibody restored the secretion of LH [78]. Short-term kisspeptin administration increased LH pulse frequency and amplitude as well as testosterone levels, indicating functional reversibility at or proximal to hypothalamic GnRH neurons, in obese men with low T levels [78].
TNFα
Obesity is associated with chronic low-grade systemic inflammation with increased expression of pro-inflammatory cytokines. Circulating TNFα is increased in obese men, and is a possible candidate linking visceral obesity with hypogonadotropic hypogonadism [79]. In an experimental model of high fat diet-induced metabolic syndrome, rabbits develop secondary hypogonadism and hypothalamic inflammation, with increased hypothalamic expression of IL-6, IL-8 and COX2 and a macrophage infiltrate that correlated with a reduction in circulating gonadotropins [80]. In this model, circulating TNFα is increased, and treatment with infliximab, an anti-TNFα mono-clonal antibody unable to cross brain-blood barrier, is associated with a decrease in hypothalamic inflammation [80]. Besides TNFα, other pro-inflammatory cytokines might be involved in the pathogenesis of obesity-related T decline. Recently, the acute administration of low to moderate doses of IL-2 reduced LH and T levels over a period of 24 h in 32 healthy volunteers, suggesting an inhibitory effect of this cytokine, involved in several systemic inflammatory conditions, on HPT at the hypothalamic/pituitary level [81].
Insulin Resistance
Another possible mechanism involved in the down-regulation of the HPT axis function in obese subjects is insulin resistance. Obesity is associated not only with peripheral but also with central insulin resistance [82]. Besides playing an essential role in glucose metabolism, insulin is involved in signaling satiety to the central nervous system [83]. Both GnRH neurons and kisspeptin neurons express insulin receptors [84, 85], and mice with a selective neuronal knockout for insulin receptors show an increased body mass and hypogonadotropic hypogonadism [86], suggesting a role for insulin in regulating the HPT axis. Accordingly, in vivo treatment of mice with increasing doses of insulin in hyperinsulinemic clamp studies was associated with an increase in circulating LH levels [87]. In addition, treatment of GnRH neurons with insulin in vitro induced a dose-dependent secretion of GnRH [88]. Obesity-related central insulin resistance could therefore negate the action of insulin on HPT axis, leading to secondary hypogonadism.
Estrogens
Estrogens have been, for a long time, the main candidate to explain the relationship between increased fat mass and down-regulation of the HPT. The hypothesis is that expanded adipose tissue in obese subjects leads to greater aromatase activity and thereby increased circulating estrogens, and an exaggerated feedback inhibition of GnRH-gonadotropin secretion. Accordingly, estrogen-antagonist [89] and aromatase inhibitor [90] treatment of overweight hypogonadal men increased LH and testosterone levels. However, the estrogen excess hypothesis is not entirely supported by data in obese diabetic [91, 92] and non-diabetic men [26], whose estradiol levels were low, rather than high, and showed a correlation with T but not with BMI. Only in cohorts of extremely obese men (candidates for bariatric surgery) estrogens are inappropriately high for the levels of T [93, 94] and show a positive correlation with BMI [95].
The Role of Low Testosterone in Development of Obesity
The relationship between T and obesity is complex and bidirectional. If a role of obesity in inducing hypogonadism is well recognized, some data also suggest that low androgen levels can lead to the development of obesity. Important information on the role of androgens in metabolism has been provided by the studies on androgen receptor (AR) knockout mice (ARKO). ARKO mice develop obesity with an increase in both subcutaneous and visceral fat, and they show a derangement in brown adipose tissue characteristics, which suggest a shift to the white adipose tissue profile [96]. Furthermore, ARKO mice display an increase in circulating triglycerides as well as in those stored within skeletal muscle and liver, and an impairment of glucose tolerance with hyperinsulinemia, hyperleptinemia, and hypoadiponectinemia [97]. In vitro studies demonstrated that androgens could inhibit the differentiation of pre-adipocytes in mice and in humans [98, 99]. Similar results have been provided by in vivo studies [100, 101]. In addition, androgen treatment of pluripotent mesenchymal cells increased myogenic but inhibited adipogenic differentiation [102]. Taken together, these data suggest a role for androgens in regulating both central and peripheral insulin sensitivity and body composition, which is best shown when androgen action is abolished rather than diminished.
A human model for the metabolic derangements arising from chemical castration is represented by men with metastatic prostatic cancer who are treated with androgen deprivation therapy (ADT). Several prospective studies demonstrated that ADT for prostate cancer is associated with significant weight gain and changes in body composition from the first months of therapy [103]. A meta-analysis of longitudinal studies shows that ADT is associated with a mean increase of 7.7% in fat mass and a decrease of 2.8% in lean mass from baseline, befitting the clinical feature of “sarcopenic obesity” [104]. These changes in body composition were accompanied by impairment in lipid profile and insulin sensitivity [103], and patients are at higher risk for developing metabolic syndrome and diabetes [105]. The role of T and androgen deficiency in modifying body composition was assessed in a study conducted in more than 400 healthy young men aged 20–50 years in whom severe hypogonadism was experimentally induced by a GnRH analogue [106]. Volunteers were then randomly assigned to receive for 16 weeks placebo or different doses of T gel with or without an aromatase inhibitor. Results showed that experimental androgen deprivation is associated with a reduction in lean mass and leg-press strength as well as an increase in total and subcutaneous fat mass, but no change in visceral fat [106]. Testosterone replacement with aromatase inhibition (pure T effect) maintained lean mass and muscle strength, but not fat mass [106]. These data suggest that the adverse effects of severe hypogonadism on lean mass are mediated by testosterone, and in adipose tissue, by estrogen deficiency.
It should be highlighted that hypogonadism induced by GnRH analogues, as in ADT in men with prostate cancer or experimental hypogonadism in eugonadal men [106], is associated with castrate T levels, which are much lower than those commonly found in LOH. A few longitudinal observational studies in the general population have evaluated the relationship between T and obesity with conflicting results. In the Rancho Bernardo study [107], a negative linear relationship between T or SHBG at baseline and waist-to-hip ratio at follow-up was found even for T levels within the eugonadal range (mean baseline total T of 18 nmol/L for those in the highest quartile of waist-to-hip ratio at follow-up). This observation is supported by a longitudinal study of 110 second-generation Japanese–American healthy male volunteers followed for 7.5 years [108]. In this study, the increase in intra-abdominal fat, as assessed by computed tomography, showed a linear negative relationship with total T at baseline, with a mean baseline total T of 14.8 nmol/L in the group with the highest increase in intra-abdominal fat [108]. More recently, longitudinal data from the EMAS showed that although low T at baseline is associated with incident metabolic syndrome, it was not associated with development of visceral obesity (determined by waist circumference) after 4.3 years [109]. Taken together, unlike the short-term changes associated with castration, chronic exposure over many years to moderately low T may predispose to abnormalities in central fat metabolism and body composition in men, but a causal relationship cannot be assumed from these observational data.
Testosterone Treatment (TRT) and Obesity
A number of uncontrolled registry studies appear to support the effect of TRT in improving body composition [110–115]. Several small RCTs of the metabolic outcomes of T therapy have been conducted. Meta-analysis of these results showed that T treatment was not associated with any change in BMI, body weight, or waist circumference [116]. However, a significant decrease in total fat mass and an increase in lean mass were consistently found in men treated with T, irrespectively of their gonadal status [116] (Table 17.3). The improvement in body composition by treating hypogonadal men with TRT is not necessarily accompanied by a substantial improvement in insulin sensitivity. In another meta-analysis of double-blind RCTs conducted in hypogonadal men with metabolic syndrome and/or diabetes mellitus [117], TRT showed only a modest, although significant, improvement in HOMA-IR as compared to placebo, whereas the effect of TRT on glycated hemoglobin was not different from placebo (Table 17.3). A recent RCT of 44 men with type 2 diabetes mellitus and low free testosterone with normal or low LH levels showed that i.m. T treatment for 24 weeks improved insulin sensitivity, as assessed by hyperinsulinemic-euglycemic clamp and fasting glycemia, without any change in glycated hemoglobin [118].
Table 17.3


Summary of the results from meta-analyses evaluating the effect of testosterone replacement therapy on body composition and metabolic outcomes as compared to placebo
Stay updated, free articles. Join our Telegram channel

Full access? Get Clinical Tree


