Nomograms for Prostate Cancer Decision Making
Andrew J. Stephenson
Michael W. Kattan
INTRODUCTION
The early detection of prostate cancer through the use of widespread prostate-specific antigen (PSA) screening and systematic ultrasound-guided prostate biopsy has resulted in the diagnosis of an increasing number of patients with clinically localized prostate cancer who are candidates for definitive therapy. A man diagnosed with localized prostate cancer today is faced with a challenging process of selecting the optimal treatment. He must choose between radical therapy and active surveillance for a cancer that may pose an uncertain threat to his longevity (1). If an aggressive treatment approach is chosen, radical prostatectomy, external-beam radiation therapy, and brachytherapy are the recognized standard treatment alternatives (with the exception of brachytherapy as monotherapy for high-risk disease), and none has been definitively proven in randomized trials to be superior in terms of cancer control.
Even if one therapy was proven to provide superior oncological results, it may not represent the optimal intervention for an individual patient. Long-term cancer control is not the only goal a patient wishes to pursue when choosing among treatment alternatives. He is also interested in minimizing the impact of therapy on his quality of life. He may be unwilling to accept the treatment option with the highest likelihood of cure if it is also associated with unacceptable morbidity (2). All treatments may negatively impact urinary, sexual, and bowel function to varying degrees, which the patient must consider (3). For example, radical prostatectomy is associated with a higher incidence of urinary incontinence while external-beam radiotherapy and brachytherapy are associated with higher rates of bowel dysfunction and irritative bladder symptoms. Each of these therapies also affects sexual function to varying degrees. When balancing this information, the patient must also consider his values and priorities.
In the absence of evidence demonstrating the superiority of one treatment over another in terms of quantity and quality of life, the patient is best suited to decide which treatment, if any, is best for him by weighing the consequences, both good and bad, for each treatment option under consideration. The relative impact of treatment-related morbidity on quality of life may be highly individualized. Only the patient can gauge how much he is willing to compromise urinary continence, for example, for long-term cancer control. As such, the physician is poorly positioned to make treatment decisions for these patients. At the heart of decision making is patient preference, which the physician is also unable to quantify. Some patients may have an aversion to radical surgery, while others will be satisfied only if the prostate cancer has been surgically removed. If the patient is not involved in choosing among treatment options for his prostate cancer, he is more likely to regret his treatment choice in the future, especially if he is to experience a bad outcome.
Accurate estimations of the likelihood of treatment success, complications, and long-term morbidity are essential to patient counseling and informed decision making. Properly informing the patient of the likelihood of treatment success and morbidity will likely improve his satisfaction after treatment. This rationale is based on the work in regret, where not consulting multiple specialists is a risk factor (4). If given an overly optimistic likelihood of success (both oncological and functional), a patient is more likely to be surprised and experience more regret when his treatment fails, compared to one who is informed by an accurate estimation of treatment success. Likewise, a patient who is given an overly pessimistic prediction of treatment success will regret the decision not to pursue definitive therapy as he learns down the road that he may have had a reasonable chance for a successful outcome. Accurate estimations of risk are essential for the physician if he is to recommend against treatment for a patient with indolent or incurable disease or for the rational application of adjuvant treatment strategies for patients at risk for disease progression after definitive local therapy. Accurate risk estimations are also required for clinical trial design to ensure homogeneous high-risk patient groups for whom new cancer therapeutics will be investigated.
Traditionally, clinical judgment has formed the basis for risk estimation, patient counseling, and decision making. However, humans have difficulty with outcome prediction due to the biases that exist at all stages of the prediction process (5,6). Clinicians do not recall all cases equally; certain cases can stand out and exert a disproportionately large influence when predicting future outcomes. We tend to be inconsistent when processing our mental database and tend to resort to heuristics (rules of thumb) when processing becomes difficult (7). When it is time to make a prediction, we tend to predict the preferred outcome rather than the outcome with the highest probability (5). Finally, we have difficulty learning from our mistakes during the feedback process. Numerous prognostic variables for prostate cancer progression have been identified including serum PSA, clinical stage, and biopsy Gleason score. Likewise, the recovery of potency after radical prostatectomy is influenced by preoperative erectile function, patient age, comorbid medical conditions, cavernous nerve preservation, and individual surgeon technique (8). Clinicians have difficulty weighing the relative importance of each of these factors when formulating outcome predictions.
To obtain more accurate predictions, researchers have developed prediction tools (9). In general, these prediction models have been proven to perform as well as or better than clinical judgment when predicting outcome probabilities (10). Outcome prediction tools for the likelihood of long-term cancer control, prostate cancer-specific mortality (PCSM), postoperative urinary continence, and postoperative potency will be useful for the individual patient when deciding upon radical prostatectomy as the treatment for his clinically localized prostate cancer.
DEVELOPING PREDICTION MODELS
A popular approach to developing prediction models is to group patients with similar characteristics and to make a prediction for each group. For example, D’Amico et al. developed a model that predicts cancer control for patients treated
with radical prostatectomy, external-beam radiotherapy, or brachytherapy by placing patients into mutually exclusive risk groups based on clinical stage, biopsy Gleason score, and pretreatment PSA level (11). While risk grouping is a logical approach, grouping patients is an inefficient use of the available data and tends to reduce the predictive accuracy of a prognostic model. When predicting outcome for a subset of patients, the relative importance of prognostic variables in another patient group is ignored. The method of counting risk factors/variables should also be avoided because this assumes that each variable exerts an equal prognostic weight on the outcome, which is unlikely to represent the true relationship between variables and prognosis (12). In addition, risk grouping requires converting continuous variables into categorical variables, which removes information about the actual value.
with radical prostatectomy, external-beam radiotherapy, or brachytherapy by placing patients into mutually exclusive risk groups based on clinical stage, biopsy Gleason score, and pretreatment PSA level (11). While risk grouping is a logical approach, grouping patients is an inefficient use of the available data and tends to reduce the predictive accuracy of a prognostic model. When predicting outcome for a subset of patients, the relative importance of prognostic variables in another patient group is ignored. The method of counting risk factors/variables should also be avoided because this assumes that each variable exerts an equal prognostic weight on the outcome, which is unlikely to represent the true relationship between variables and prognosis (12). In addition, risk grouping requires converting continuous variables into categorical variables, which removes information about the actual value.
Another popular method is the prognostic index. These models are often based on a Cox or logistic regression model and a numerical score is assigned to each parameter in the model based on its parameter estimate or hazard ratio. A total score is calculated by summing each of the scores for the individual parameters. The Cancer of the Prostate Risk Assessment (CAPRA) score is an example of a prognostic index (13). Patients are assigned a CAPRA score between 0 and 10 based on the points assigned for PSA (0-4), biopsy Gleason score (0-3), clinical stage (0-1), percentage of positive biopsy cores (0-1), and age (0-1). Each point on the CAPRA score corresponds with an estimated 5-year recurrence-free probability after radical prostatectomy.
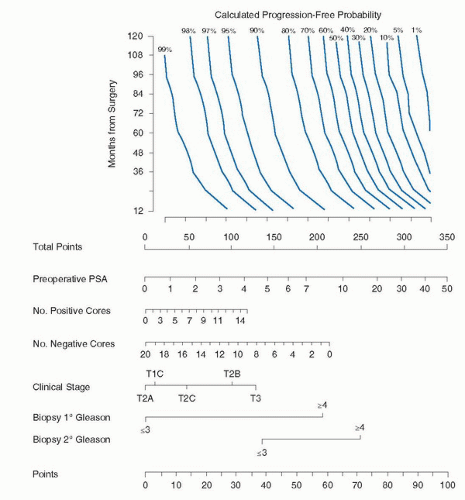
An alternative method to a risk group or prognostic index is to develop continuous multivariable models called nomograms. A nomogram is a graphic representation of a mathematical formula or algorithm that incorporates several predictors modeled as continuous variables to predict a particular endpoint. Nomograms consist of sets of axes; each variable is represented by a scale, with each value of that variable corresponding to a specific number of points according to its prognostic significance. For example, the nomogram shown in Figure 9.1 assigns each PSA level a unique point value that represents its prognostic significance. In a final pair of axes, the total point value from all the variables is converted to the probability of reaching the endpoint. By using scales, nomograms calculate the continuous probability of a particular outcome.
By incorporating all relevant continuous predictive factors for individual patients, nomograms provide more accurate predictions than models based on risk grouping and they generally surpass clinical experts at outcomes prediction by calculating probabilities in a uniform fashion (5,10,14). Several studies have documented the superior performance of nomograms compared to risk-grouping schemata (15,16,17). This may stem from the fact that risk groups consist of patients
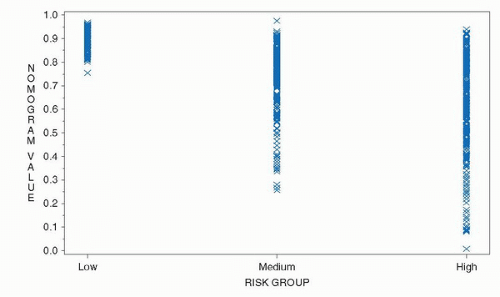
with similar—albeit not identical—characteristics, resulting in heterogeneity within a risk group that reduces the predictive accuracy (18,19). The heterogeneity inherent in risk groups is illustrated in Figure 9.2 where the 5-year progression-free probability (PFP) after radical prostatectomy was calculated using a continuous, multivariable preoperative nomogram among patients classified as low-, medium-, and high-risk using the criteria of D’Amico et al. (11,20). While low-risk patients uniformly had a high likelihood of being free of progression by the nomogram, a substantial proportion of intermediaterisk and even high-risk patients had a calculated 5-year PFP of 90% or more. A considerable overlap in the nomogram predictions is also evident among intermediate- and high-risk patients. A risk group is composed of a mixture of patients and is only useful for gauging the prognosis for that group of patients. A patient does not care about the outcome of his (heterogeneous) group; he cares about his individual prognosis. His physician should do the same.
with similar—albeit not identical—characteristics, resulting in heterogeneity within a risk group that reduces the predictive accuracy (18,19). The heterogeneity inherent in risk groups is illustrated in Figure 9.2 where the 5-year progression-free probability (PFP) after radical prostatectomy was calculated using a continuous, multivariable preoperative nomogram among patients classified as low-, medium-, and high-risk using the criteria of D’Amico et al. (11,20). While low-risk patients uniformly had a high likelihood of being free of progression by the nomogram, a substantial proportion of intermediaterisk and even high-risk patients had a calculated 5-year PFP of 90% or more. A considerable overlap in the nomogram predictions is also evident among intermediate- and high-risk patients. A risk group is composed of a mixture of patients and is only useful for gauging the prognosis for that group of patients. A patient does not care about the outcome of his (heterogeneous) group; he cares about his individual prognosis. His physician should do the same.
In contrast to risk groups, a nomogram makes a tailored predicted probability based on the characteristics of the individual patient. While nomograms are more complex than risk groups, this added complexity results in added predictive accuracy for both the patient and physician. Nomograms have been adapted for use on personal digital assistants and personal computers to facilitate their use in the office or for research purposes. These nomograms are available in the public domain for use online (www.nomograms.org or www.clinicriskcalculators.org).
The superior predictive accuracy of continuous, multivariable nomograms versus risk groups is illustrated by comparing the ability of the “Partin tables” to predict the pathologic features of prostate cancer with a suite of nomograms that we have developed. The “Partin tables” combined serum PSA (four categories), clinical stage (seven categories), and biopsy Gleason sum (five categories) to predict pathological stage of prostate cancer that is assigned as one of four mutually exclusive groups (organ confined, established extracapsular extension [ECE], seminal vesicle invasion [SVI], or lymph node involvement [LNI]) (21). These tables underestimate the probability of ECE, for example, since a substantial proportion of patients with lymph node metastases and SVI will also have ECE. Among patients with prostate cancer in our institutional database, the predictive accuracy of the “Partin tables” for predicting organ-confined disease, SVI, and LNI was 0.71, 0.72, and 0.74, respectively (22,23,24). In contrast, nomograms incorporating PSA, clinical stage, and Gleason sum modeled as continuous variables had a concordance index (or c-index) for predicting organ-confined disease, SVI, and LNI of 0.74, 0.84, and 0.76, respectively (22,23,24).
Several considerations apply when designing predictive models. A model should accurately predict which patients will and will not reach the endpoint (discrimination), generate predictions that closely approximate actual outcomes (calibration), and perform consistently when applied to different datasets (validation). Ideally, the patients in the cohort from which the model was developed on should be representative of the general population of patients to whom the model will be applied. The treatments the patients in the modeling cohort received should also be similar to the treatments the general population of patients at risk will receive. Rigorous patient selection and/or unconventional treatments received within the modeling cohort may limit the external validity of the model to future patients. The model should also be based on a sufficient number of cases; specifically, they must incorporate a large enough proportion of cases that reach the endpoint of interest. Predictive models should incorporate an appropriate number of variables, including variables that are statistically insignificant. If the model uses only statistically significant variables, they tend to exert an inappropriately large influence, resulting in falsely narrowed confidence intervals that make the nomogram appear more accurate than it is (25,26). Ideally, a predictive model should demonstrate generalizability. That is, it should repeatedly perform with similar accuracy when applied to heterogeneous novel populations. Prognostic models lose their generalizability when they use small datasets, use datasets with a large proportion of missing information, incorrectly impute or delete missing records, or incorporate an inappropriate number of variables (27). Further, for greatest utility in the clinical setting, nomograms should incorporate parameters that are reliable and routinely employed, and they should be easy to use. A cumbersome yet highly accurate statistical model is less useful than a simple risk group if the former is impractical to use in the clinic setting.
The nomograms developed by Kattan et al. are based on Cox proportional hazards or logistic regression analysis modified by restricted cubic splines. Unmodified regression models require variables to assume linear relationships, which is not ideal because it assumes that incremental changes represent the same significance across the spectrum of values. For example, a rise in PSA from 2 to 4 ng/mL would represent the same
impact as a rise from 302 to 304 ng/mL. The application of cubic splines imparts flexibility to the nomogram by allowing continuous variables to maintain nonlinear relationships. Machine learning modeling methods such as artificial neural networks offer greater flexibility than traditional statistical methods and theoretically may lead to enhanced predictive accuracy if datasets contain highly predictive nonlinear or interactive effects. However, traditional statistical methods appear to perform as well as machine learning methods and offer the added advantage of reproducibility and interpretability through the generation of hazard ratios and tests of significance for the predictors (28).
impact as a rise from 302 to 304 ng/mL. The application of cubic splines imparts flexibility to the nomogram by allowing continuous variables to maintain nonlinear relationships. Machine learning modeling methods such as artificial neural networks offer greater flexibility than traditional statistical methods and theoretically may lead to enhanced predictive accuracy if datasets contain highly predictive nonlinear or interactive effects. However, traditional statistical methods appear to perform as well as machine learning methods and offer the added advantage of reproducibility and interpretability through the generation of hazard ratios and tests of significance for the predictors (28).
These nomograms use data in their most elemental forms to extract the maximal amount of useful information. For example, the primary and secondary Gleason grades are used as independent variables, rather than the Gleason score alone, since several combinations of primary/secondary Gleason grades can result in the same Gleason sum (e.g., 3 + 4 = 7 and 4 + 3 = 7), but these combinations may reflect quite different
disease states with different prognoses (29). An important approach incorporated into many of the nomograms that predict cancer recurrence after therapy is that patients receiving secondary treatment before demonstrating disease progression are classified as treatment failures. This approach is used because the secondary treatment was probably prompted by an adverse feature associated with a high risk of recurrence or some evidence of recurrence, so the time of secondary treatment is assumed to be shortly before the recurrence would have been demonstrated (26). Censoring (or excluding) these patients would bias the nomogram toward improved outcomes, but by designating adjuvant therapy equivalent to disease progression, the efficacy of primary therapy is better evaluated. An alternative (and preferred) method is to consider the use of secondary therapy as a time-dependent covariate rather than a fixed parameter like pathological stage. This approach is called an extended Cox or competing risk model and requires more sophisticated computation (30).
The discrimination of these nomograms is measured using the c-index, rather than area under the receiver operator characteristic curve (AUC). While the AUC requires binary outcomes (e.g., cure/fail), the c-index functions in the presence of case censoring and is more appropriate for analyzing survival or time-to-event data (31).
Lastly, these nomograms are calibrated and validated to evaluate their accuracy. While external validation represents the gold standard for evaluating accuracy and reproducibility, internal validation methods such as jackknife, leave-oneout cross-validation and bootstrapping (32) remain legitimate alternatives that can be used alone or in concert with external validation to assess the nomograms precision (27).
CLINICAL STATES OF PROSTATE CANCER
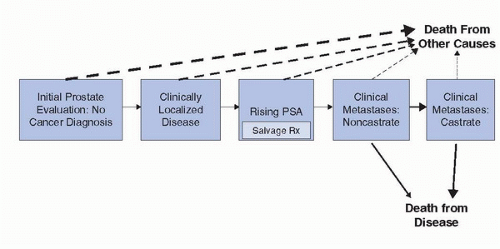
A conceptual way to think about prostate cancer is a series of clinical states from diagnosis to death from prostate cancer (or death from competing causes), which reflects the treated natural history of the disease (Fig. 9.3) (33). At each clinical state along the prostate cancer continuum, a man is faced with different prognoses in terms of the risk of progressing to the next clinical state (and ultimately dying from his disease) versus dying from competing causes and different treatment decisions about the need of further therapy and the nature, risks, and benefits of those treatment alternatives. Appropriate treatment of the patient within each of these clinical states (and informed decision making) requires accurate estimates of treatment success and side effects. Fortunately, published validated nomograms are available to guide clinical decision making for some of the endpoints of interest at each state in this clinical states model. Currently, there are over 100 published prediction tools of various accuracy that have been developed for use in risk estimation for all clinical states of prostate cancer. We will review some of the prediction models that are available for each of these clinical states with an emphasis on those for localized prostate cancer.
Clinically Localized Disease
A man with localized prostate cancer is interested in knowing the risk of developing symptoms and/or dying from his disease, with or without definitive local therapy, the likelihood of treatment success with radical therapy, and the short- and long-term complications of therapy. Many nomograms exist for prostate cancer recurrence after definitive local therapy (9). Currently, similar nomograms that estimate the likelihood of treatment-related morbidity (e.g., urinary incontinence, sexual dysfunction, bowel dysfunction, hormonal symptoms) are lacking. This discussion, however, will be restricted to 13 contemporary models that predict the continuous risk of disease progression, developing distant metastasis, and/or PCSM after definitive therapy with radical prostatectomy (34,35,36,37,38,39), external-beam radiotherapy (17,18,40), or transperineal brachytherapy (41,42), and with expectant management (43,44). The models that predict the probability of remaining free from disease progression (i.e., the PFP) are largely based on evidence of a rising PSA level after treatment (termed biochemical recurrence). While biochemical recurrence universally antedates distant metastasis and PCSM, it is an imprecise proxy for these endpoints. At 15 years, the risk of death from prostate cancer for men with biochemical recurrence is 33%,
which is roughly the same as the risk of death from competing causes (45). Pretreatment nomograms are useful when deciding between the various treatment alternatives for clinically localized prostate cancer and/or the need for multimodal therapy. The posttreatment models are useful for deciding upon the need for adjuvant therapy and/or the appropriate intensity of posttreatment surveillance testing or imaging.
which is roughly the same as the risk of death from competing causes (45). Pretreatment nomograms are useful when deciding between the various treatment alternatives for clinically localized prostate cancer and/or the need for multimodal therapy. The posttreatment models are useful for deciding upon the need for adjuvant therapy and/or the appropriate intensity of posttreatment surveillance testing or imaging.
Stay updated, free articles. Join our Telegram channel

Full access? Get Clinical Tree


