Molecular Genetics of Acute Leukemia


Molecular Genetics of Acute Leukemia


Mary Ann Thompson

Utpal P. Davé


INTRODUCTION

Acute leukemia results when a normal hematopoietic stem or progenitor cell sequentially acquires mutations which confer clonal growth advantage. This clonal evolution model of cancer development involves gain of function of oncogenes and loss of function of tumor suppressor genes that cooperate to induce fulminant disease. The earliest view of the genome of acute leukemia was provided by cytogeneticists who karyotyped leukemic blasts, revealing recurrent chromosomal translocations. Cloning these translocation breakpoints led to the identification of genes whose altered activity could be directly linked to leukemogenesis. More recently, the genomes of acute leukemias have been probed at an unprecedented depth, revealing various lesions at the base pair level, such as amplifications, deletions, insertions/deletions, and point mutations, that can deregulate oncogene or tumor suppressor gene function. Acute leukemias of either myeloid or B-cell origin (i.e., acute myeloid leukemia [AML] and B-cell acute lymphoblastic leukemia [B-ALL]) have been classified by the World Health Organization (WHO) by the presence of recurrent chromosomal rearrangements which affect the choice of therapy and have significant prognostic value. Acute leukemias without recurrent chromosomal rearrangement have been traditionally classified by their cell of origin, but recently these leukemias have been subjected to whole genome analyses, revealing the presence of novel recurrent molecular lesions. As clinical data matures, the list of oncogenes and tumor suppressors deregulated by mechanisms other than chromosomal rearrangement may be incorporated into a new classification schema. In this chapter, we focus on the more common recurrent genetic abnormalities found in acute leukemias, with special emphasis on how the genetic defects inform our concept of leukemia pathogenesis. We provide specific examples where the genetic lesions have led to the development of targeted therapies with fewer side effects than traditional cytotoxic chemotherapy. This is truly an exhilarating time for hematologic oncology, where laboratory findings have direct relevance to current treatment modalities.


Reasons for Studying Molecular Genetics of Acute Leukemia

A major reason for understanding the molecular genetics of acute leukemia is to develop novel molecular treatments for this disease. The paradigm for the translation of basic research knowledge to clinical treatment has been chronic myelogenous leukemia (CML). The first leukemia to be associated with a recurrent translocation, t(9;22)(q34;q11.2) (the Philadelphia chromosome),1 CML was also the first leukemia where the product of the translocation, breakpoint cluster region (BCR-ABL1) was characterized.2 In addition, CML was the first leukemia for which a specific molecular inhibitor, imatinib (Gleevec), was designed.3 Research and clinical trials are currently underway to increase the armamentarium of targeted molecular therapies. An additional benefit of being able to identify the molecular lesions in a given acute leukemia is the ability to carry out more accurate risk stratification of newly diagnosed patients. Numerous clinical studies have correlated clinical prognosis with the set of genes that are altered in a patient’s leukemic blasts. Results from the initial cytogenetic and molecular studies on a patient’s leukemic blasts are used to stratify the leukemia as favorable or unfavorable, as listed in Tables 72.1 and 72.2 for adult AML and pediatric B-cell ALL, respectively. Finally, the particular array of mutated genes in the leukemic blasts provides a very sensitive method for determining efficacy of treatment by using these aberrant molecular markers to quantify minimal residual disease after treatment.

A large number of the genes altered by translocation encode transcriptional regulatory proteins that often preserve the original DNA-binding specificity of one of the fusion partners, but have altered properties of transcriptional activation or repression. The search to understand these altered properties has led investigators to basic discoveries of how transcriptional regulatory proteins modify chromatin structure to open up or inhibit the transcription of target genes. However, the genes that are recurrently mutated in acute leukemias also belong to other functional classes of proteins. Kinases which are rendered constitutively active by mutation can deregulate the cell’s signal transduction pathways and lead to uncontrolled proliferation. Mutations in genes encoding proteins involved in modification of histones or methylation of DNA can lead to altered expression of groups of genes that can have effects as dramatic as those caused by mutations in transcription factors. Additional functional categories of genes that are recurrently mutated in leukemia are inhibitors of apoptosis and nuclear pore proteins. This chapter will focus on the mechanisms by which mutations in genes in each of these major functional classes may contribute to the pathogenesis of leukemia. If we understand the mechanism by which “driver” mutations work, we may be able to reverse or inhibit their actions to develop novel treatment modalities for leukemia.


Multiple Hit Model of Leukemia

Another theme that emerges from the study of the molecular genetics of leukemia is that usually more than one genetic hit is necessary for the development of leukemia.4 This principle has been repeatedly demonstrated in mouse models, where introduction of the fusion gene found in acute leukemia by transgenic technology or retroviral transduction results in predisposition to acute leukemia with long latency, unless the accumulation of additional genetic hits is facilitated by treatment with a mutagenic agent. The multistep model of carcinogenesis is not limited to leukemias, and is reviewed in Hanahan and Weinberg’s recent update5 of their original paper6 first outlining the six hallmarks of cancer. These hallmarks, now updated to eight, are properties that cancer cells must acquire through multiple mutations in order to become malignant: sustained proliferative signaling, evading growth suppression, enabling replicative immortality, resisting cell death, inducing angiogenesis, activating invasion and metastasis, avoiding immune destruction, and deregulating
cellular energetics.5 In the field of leukemia research, attention has been focused on deregulation of proliferation (Class I mutations), and a block in differentiation (Class II mutations).4 The block in differentiation is visually striking under the microscope, as blasts have morphologic characteristics of hematopoietic stem cells (HSCs). However, what is relevant to leukemogenesis is that HSCs have self-renewal. Many of the well-characterized recurrent translocations in acute leukemia produce fusion genes that encode mutant transcription factors that can no longer activate the genes required for differentiation. However, some translocations (notably BCR-ABL1), and some of the genes most commonly affected by point mutations (FLT3) encode kinases that cause deregulated proliferation.4 Through new advances in technology outlined in the next section scientists have discovered a host of additional gene mutations that occur in leukemia, suggesting many more than two hits in the path toward leukemia. In addition, a further layer of regulation at the epigenetic level has been hypothesized due to the number of genes mutated in leukemia that are active in modification of histones or in regulation of DNA methylation.


TABLE 72.1 RISK GROUPS IN ADULT ACUTE MYELOID LEUKEMIA BASED ON CYTOGENETIC AND MOLECULAR ANALYSIS


Cytogenetic Classification


Cytogenetic Abnormality


Mutation in FLT3


Other Mutations


Overall Risk Profile


Favorable


RUNX1-RUNX1T1 CBFB-MYH11


FLT3-ITD-neg or positive


Any


Favorable


Intermediate-I and -II


Normal karyotype MLLT3-MLL


FLT3-ITD-neg


Mutant NPM1 or IDH1/2


Unclassified cytogenetics


FLT3-ITD-neg


Wild-type ASXL1, MLL-PTD, PHF6, or TET2


Intermediate


FLT3-ITD-neg or positive


Mutant CEBPA


FLT3-ITD-positive


Wild-type MLL-PTD, TET2, and DNMT3A, or trisomy 8-negative


FLT3-ITD-neg


Mutant TET2, MLL-PTD, ASXL1, or PHF6


Unfavorable


FLT3-ITD-positive


Mutant TET2, MLL-PTD, DNMT3A, or trisomy 8, without mutant CEBPA


Unfavorable


RPN1-EVI1 DEK-NUP214 MLL rearranged -5 or del(5q), -7 Abnl (17p) Complex karyotype


FLT3-ITD-neg or positive


Any


From Patel JP, Gonen M, Figueroa ME, et al. Prognostic relevance of integrated genetic profiling in acute myeloid leukemia. NEJM 2012;366: 1079-1089 and Mrozek K, Marcucci G, Nocolet D, et al. Prognostic significance of the European LeukemiaNet standardized system for reporting cytogenetic and molecular alterations in adults with acute myeloid leukemia. J Clin Oncol 2012. doi:10.1200/JCO.2012.43.4738.


TABLE 72.2 RISK GROUPS IN PEDIATRIC B-CELL ACUTE LYMPHOBLASTIC LEUKEMIA BASED ON CYTOGENETIC AND MOLECULAR ANALYSIS


Risk Group


Cytogenetic or Molecular Abnormality


Target Genes


Favorable


t(12;21)(p13;q22.3)


ETV6-RUNX1


Hyperdiploid > 50 chromosomes


Simultaneous trisomies of 4, 10, and 17


Unfavorable


t(9;22)(q34.1;q11)


BCR-ABL1


t(4;11)(q21.3;q23)


MLL-AFF1


Hypodiploidy < 44 chromosomes


iAMP21


RUNX1


Deletion 7(q13)


IKZF1


Mutation in JAK1/2


JAK1/2


Deletion/translocation of CRLF2


CRLF2


From Pui C-H, Evans WE. Acute lymphoblastic leukemia. NEJM 1998;339:605-615 and Zhou Y, You MJ, Yong KH, et al. Advances in the molecular pathobiology of B lymphoblastic leukemia. Hum Pathol 2012;43:1347-1362.


Advances in Technology: A Genomic Perspective of Acute Leukemia

The tremendous advances in technology in the few years since the previous version of this chapter have revolutionized our ability to analyze individual genomes (Table 72.3). As mentioned above, G-banding of chromosomes was our first view of the leukemia genome and is still highly informative in identifying translocations, aneuploidy, and other gross chromosomal rearrangements (>4 megabases).7,8 More focused analyses such as interphase fluorescence in situ hybridization (FISH) have improved the resolution of standard cytogenetics so that amplifications or deletions of 100 kilobases may be visualized.9 In the last 10 years, oligonucleotides covering the entire human genome have been printed onto arrays allowing hybridization of fluorescently labeled leukemic and control genomic DNA.10,11 This array comparative genomic hybridization (CGH) can identify copy number variation (CNV), and has been powerfully employed in identifying recurrent
deletions and amplifications in acute leukemias. Similar microarrays were designed to cover common single nucleotide polymorphisms (SNPs) for genotyping purposes, but they too have been used to identify CNVs, particularly copy number neutral loss of heterozygosity (also known as uniparental disomy) in leukemia.12 Array CGH and SNP arrays display the human genome as small probes and will not detect balanced translocations. Most excitingly, major advances in whole genome sequencing now provide single base pair resolution so that point mutations may be identified as well as chromosomal rearrangements.13 These powerful technologies are readily deployed in the diagnosis of acute leukemia and provide a complete genomic perspective of the disease; however, there are important caveats. Human genomes are full of rare and common structural variants and SNPs.14, 15, 16, 17 and 18 Therefore, mutations can only be interpreted as being acquired in leukemogenesis if they are not present in normal somatic tissue. Thus, matched normal somatic tissue is frequently subjected to the same genomic analyses as leukemic blasts.


TABLE 72.3 RESOLUTION OF TECHNOLOGIES AVAILABLE TO IDENTIFY GENETIC ALTERATIONS IN ACUTE LEUKEMIA


Technique


Resolution


Molecular Lesion


References


Whole genome sequencing


1 bp


Point mutations, amplifications, insertions, deletions, translocations


13,325


Whole exome sequencing


1 bp


Point mutations, amplifications, deletions


326,327


Transcriptome sequencing


1 bp


Gene expression, fusion transcript detection, point mutations


328,329


Gene expression microarray


Gene expression


244,246,330


Interphase FISH


100 kb


Focal amplifications or deletions


9


Array comparative genomic hybridization


100 kb amplification 3-5 Mb deletion


Amplifications, deletions


10,11


SNP array


100 kb


Amplifications, deletions


11,12,331


Cytogenetics/karyotyping


3-4 Mb


Amplifications, deletions, translocations


8,332


FISH, fluorescence in situ hybridization; SNP, single nucleotide polymorphism.


The sequence of the human genome was completed in 2001 at 90% coverage after 10 years of collaborative and arduous work from multiple laboratories for a cost of 1 billion dollars; the draft genome sequence contained gaps that were filled in 2004, resulting in a highly accurate reference sequence currently at build 37(2012).19, 20 and 21 At this writing, a sample human genome can be sequenced in 6 weeks for approximately 40 thousand dollars.22 This remarkably short processing time and reduction in cost were made possible by massively parallel sequencing technologies, collectively known as next generation (or second generation) sequencing.23 The original draft human genome sequence was generated by Sanger sequencing or dideoxynucleotide chain termination and capillary electrophoresis, first generation technologies. In second generation technologies, the addition of nucleotides occurs in parallel on multiple DNA strands and is multiplexed frequently on microchips or beads.24 This has resulted in an incredible information glut. As DNA sequencing technologies race toward the $1,000 genome, the burden has shifted toward efficient and timely informatics analysis. Some of the complexity of genome assembly can be avoided by targeted sequencing or whole exome sequencing. Here, capture technologies utilize DNA hybridization to purify all the exons of a given genome. These are then fully sequenced; of course, in this case the mutations discovered are limited only to the coding regions of the genome, and mutations within regulatory regions may also be present. Besides mutation analysis, next generation sequencing has expedited our ability to define whole genome chromatin marks,25 CpG methylation,25,26 microRNAs,27 and noncoding RNAs.28 For chromatin analysis, immunopurification can enrich for genomic DNA that is associated with specific histone marks that denote active or inactive gene expression. These tools will be important in analyzing the effects of mutant leukemia proteins that modify histone residues.

In 2008 the entire genome sequence of a cytogenetically normal AML patient was completed for the first time.29 In 2009 further refined techniques were used to sequence a second AML genome to a higher level of coverage (98%),30 and in 2010 DNA from the first patient was subjected to deeper sequencing.31 In each patient multiple acquired somatic mutations were identified by comparison to normal skin from the same patient. Somatic mutations unique to the leukemia cells were found in coding sequences, as well as in conserved or regulatory portions of genes. All of the mutations were shown to be heterozygous and were present in the majority of the blasts. Screening of a large panel of AML samples for novel coding region mutations identified in the two sequenced genomes demonstrated two genes not previously thought to be involved in leukemogenesis that were recurrently mutated: IDH1, (mutated in 16% of cytogenetically normal AML samples),32 and DNMT3A (mutated in 22% of AML samples).31

A recent study greatly expanded this breakthrough work by deep sequencing the genomes of 12 patients with AML with a normal karyotype and 12 patients with acute promyelocytic leukemia (APL) with the t(15;17).33 Again, bone marrow and skin samples were compared, and all single nucleotide variations (SNVs) were validated by Illumina sequencing. An average of 440 SNVs per genome were identified. The number of SNVs per genome was not different between the cytogenetically normal leukemia cases and the t(15;17) leukemia cases, and the number was proportional to age. Interestingly, the number of mutations detected in HSCs from normal patients was similar and also varied with age, suggesting that mutations randomly accumulate in stem cells and that the hundreds of mutations in the AML genomes most likely preexisted before the initiating mutation that gave growth advantage to the AML clone.33 Thus only a few mutations may be relevant to the pathogenesis of the clone. An average of 11 mutations with translational consequences were present in cytogenetically normal AML genomes and 10 in APL (counting promyelocytic leukemia-retinoic acid receptor-α [PML-RARA] itself). Only a few were recurring in other AMLs, with an average of 3 recurring mutations in each cytogenetically normal AML genome and 2 recurring mutations, including PML-RARA, in the AML genomes with t(15;17).33

The complexity of mutations that contribute to the leukemic phenotype is visually appreciated in Figure 72.1, a summary of coexpression of mutations in a cohort of 398 patients with AML that were screened for mutations of eighteen gene loci.34


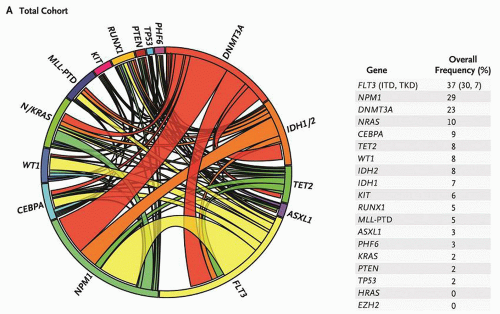
FIGURE 72.1. Mutational complexity of acute myeloid leukemia (AML). The Circos diagram depicts the relative frequency and pairwise co-occurrence of mutations in patients with newly diagnosed AML who were enrolled in the Eastern Cooperative Oncology Group E1900 clinical trial. The length of the arc along the outer circle corresponds to the frequency of mutations in the first gene, and the width of the ribbon corresponds to the percentage of patients who also had a mutation in the second gene listed on the opposite end of the ribbon. Pairwise co-occurrence of mutations is denoted only once, going in the clockwise direction. The frequency of occurrence in the test cohort of the 18 genes in the test panel is listed to the right of the Circos diagram. From Patel JP, Gonen M, Figueroa ME, et al. Prognostic relevance of integrated genetic profiling in acute myeloid leukemia NEJM 2012;366:1079-1089, Copyright 2012 Massachusetts Medical Society. Reprinted with permission from Massachusetts Medical Society.


ACUTE MYELOID LEUKEMIA


World Health Organization Classification

A subset of the new WHO classification of acute myeloid leukemia is entitled “acute myeloid leukemia with recurrent genetic abnormalities”35 (see Table 72.4). These recurrent translocations occur most often in de novo acute leukemia, but are not restricted to this category. Another major category of acute myeloid leukemia is AML with myelodysplasia-related changes,35 where genetic mutations and chromosomal deletions occur secondary to the mutator phenotype of the underlying myelodysplastic syndrome (MDS) in some cases.


TABLE 72.4 WORLD HEALTH ORGANIZATION CLASSIFICATION OF ACUTE MYELOID LEUKEMIA


AML with recurrent genetic abnormalities


AML with t(8;21)(q22;q22); RUNX1-RUNX1T1


AML with inv(16)(p13.1q22) or t(16;16)(p13.1;q22); CBFB-MYH11


Acute promyelocytic leukemia with t(15;17)(q24.1;q21.1); PML-RARA


AML with t(9;11)(p22;q23); MLLT3-MLL


AML with t(6;9)(p23;q34); DEK-NUP214


AML with inv(3)(q21q26.2) or t(3;3)(q21;q26.2); RPN1-EVI1


AML (megakaryoblastic) with t(1;22)(p13;q13); RBM15-MKL1


AML with mutated NPM1


AML with mutated CEBPA


AML with myelodysplasia-related changes


Therapy-related myeloid neoplasms


AML, NOS


Myeloid sarcoma


Myeloid proliferations related to Down syndrome


AML, acute myeloid leukemia; NOS, not otherwise specified. From Swerdlow, SH, Campo, E, Harris, NL, et al., Eds. WHO classification of tumours of haematopoietic and lymphoid tissues. Lyon, France: IARC Press, 2008.


Whole genome sequencing has clarified our understanding of the clonal evolution from MDS to AML. Walter et al compared seven sets of samples from patients for whom there were paired samples of normal skin, preleukemic bone marrow diagnosed as MDS, and bone marrow involved by secondary AML.36 In each genome there were 304 to 872 somatic point mutants in coding regions or consensus splice site regions, and those point mutations with translational consequences comprised an average of 24 mutations per genome. These functional mutations occurred in a total of 168 genes over the 7 genomes. The strength of the study was that the number of mutations allowed study of clonal evolution from MDS to secondary AML. The clonal evolution described by the sequential acquisition of mutations (defined as five mutation clusters by unsupervised clustering analysis) is visually shown in Figure 72.2. A majority of the cells in the MDS sample contained the same cluster of mutations, meaning that before blasts were even detected morphologically, the marrow was involved by a clonal process. At the secondary AML stage, all the samples contained several clones, all of which had the original set of mutations, but which were defined by acquisition of new sets of mutations as well. Presumably most of these somatic mutations are “passenger” mutations, but the multiplicity of mutations tracked adds credence to the description of clonal evolution.36 The mutations that were in characterized genes ranged the gamut of genes involved in adhesion, cell death, cell cycle, differentiation, metabolism, motility, signaling, transcription, and transporters.36 In the subsequent sections, we will discuss how alterations of genes that fall in these functional classes contribute to leukemogenesis.


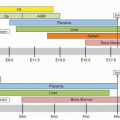
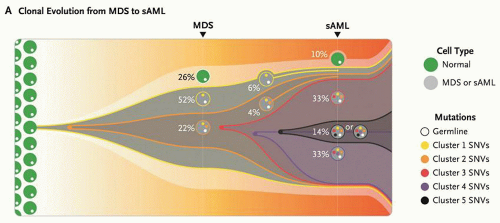
FIGURE 72.2. Clonal progression of MDS to secondary acute myeloid leukemia (AML). This model summarizes the clonal evolution from MDS to secondary AML (sAML) in one patient. Cells in clone 1 (yellow) contain cluster 1 mutations, 323 somatic single nucleotide variants (SNVs) present in approximately 74% of the bone marrow cells. Cells in clone 2 (orange) originated from a single cell in clone 1 and therefore contain all cluster 1 and 2 mutations. This clone became dominant in the sAML sample, in which three subsequent subclones (red, purple, and black) evolved through serial acquisition of SNVs (clusters 3, 4, and 5). From Walter MJ, Shen D, Ding L, et al. Clonal architecture of secondary acute myeloid leukemia. NEJM 2012;366:1090-1098. Copyright 2012 Massachusetts Medical Society. Reprinted with permission from Massachusetts Medical Society.


Transcription Factors


Promyelocytic Leukemia-Retinoic Acid Receptor-α

One of the most elegant examples of the interaction between clinical and molecular advances in the treatment of acute leukemia is APL. The association between the t(15;17)(q24.1;q21.1) translocation and the characteristic morphology of APL (hypergranular blasts with frequent Auer rods or microgranular variant with dumbbell-shaped nuclei) has been known for a long time. The ability to treat APL with retinoic acid (RA) and the understanding of the molecular basis for this treatment is a compelling example of the power of molecular medicine. The initial report from China37 that all-trans retinoic acid (ATRA) could induce complete remission (CR) in APL patients actually preceded the discovery that the t(15;17) translocation involved the RARA gene on chromosome 17.38,39,40

Of four translocations associated with APL, the most common is t(15;17)(q24.1;q21.1), in which the 5′ portion of the fusion protein is encoded by the PML gene from 15q24.1 and the 3′ portion is encoded by the RARA gene from 17q21.1. The RARA gene is a ligand-dependent steroid receptor that mediates the effects of the ligand, RA, on the cell. The breakpoint is invariant in intron 2 of RARA, yielding the C-terminal portion of the fusion protein, which includes the DNA-binding, ligand-binding, dimerization, and repression domains of RARA. There are three major breakpoints in the PML gene. The most common generates PML(L)-RARA, which includes the first six exons of PML encoding 554 amino acids of PML.41

The wild-type RARA is a nuclear receptor that acts as a transcription factor and binds to retinoic acid response elements (RAREs) in the promoters of many genes, including genes important in myeloid differentiation. RARA binds as a heterodimer with retinoid X receptor protein (RXR) and acts as a transcriptional repressor until ligand (RA) binding occurs, changing the conformation of the protein and resulting in transcriptional activation.42 Target genes important for myeloid differentiation include colony-stimulating factors (granulocyte colony-stimulating factor [G-CSF]), colony-stimulating factor receptors (G-CSFRs), neutrophil granule proteins (leukocyte alkaline phosphatase, lactoferrin), cell-surface adhesion molecules (CD11b, CD18), regulators of the cell cycle, regulators of apoptosis (BCL2), and transcription factors (RARs, STATs, HOX genes) (reviewed in Ref. 43). Expression of a dominant negative RARA in either a murine hematopoietic cell line or primary murine bone marrow cells, followed by stimulation with granulocyte-macrophage colony-stimulating factor (GM-CSF), results in arrest of granulocytic differentiation at the promyelocyte stage.44

In the absence of RA, the wild-type RARA, present as a heterodimer with RXR on the RARE, binds to the corepressor proteins SMRT, N-CoR, mSin3, and histone deacetylases (HDACs). Deacetylation of the histones at the target gene promoter results in transcriptional repression. Ligand binding at physiologic concentrations of ATRA causes a conformational change that results in release of corepressors and recruitment of a coactivator complex (SRC-1), which associates with histone acetyltransferases (Fig. 72.3A).45 Acetylation of the histones at the target gene promoter is associated with transcriptional activation (reviewed in Ref. 43).

Wild-type PML protein is normally localized in subnuclear PML oncogenic domains, also called nuclear bodies (NBs), in which other nuclear factors colocalize.46 PML may act as a tumor suppressor protein and is involved in growth suppression as well as in induction of apoptosis (reviewed in Ref. 43). Although it does not bind DNA directly, it influences transcription by interacting with both CREB-binding protein (CBP),47 a transcriptional activator, and HDACs, transcriptional repressors, possibly within the NBs. The protein encoded by the PML-RARA fusion transcript resulting from the t(15;17) is delocalized from the NBs to a microspeckled nuclear pattern.48

In APL, the PML-RARA protein binds to RAREs with similar affinity to the RARA protein and is able to heterodimerize with RXR. It acts in a dominant negative manner, competing with wild-type RARA for binding to the RAREs. It binds corepressor proteins in the absence of ligand (via the RARA portion of the protein). However, physiologic levels of ATRA (10-8 M) are not able to convert PML-RARA into a transcriptional activator; pharmacologic concentrations are required (10-6 M; Fig. 72.3B).45,49 This provides the mechanistic basis for the efficacy of treatment of APL patients with ATRA to include differentiation of the promyelocytes.

Understanding of the mechanism of the response of APL to ATRA was furthered by studies of an alternative translocation, t(11;17)(q23;q21.1), which is rarely seen in patients with APL.50 Patients with this translocation are resistant to treatment with pharmacologic doses of ATRA. The fusion partner gene on chromosome 11q23 encodes ZBTB16 (previously known
as promyelocytic zinc finger), a transcriptional repressor. The N-terminal portion of the fusion protein encoded by ZBTB16 includes the N-terminal POZ/BTB protein interaction domain, transcriptional activation and repression domains, and a variable number of zinc fingers important for protein and DNA interactions (reviewed in Refs. 43,45). ZBTB16 interacts with N-CoR, SMRT, mSin3A, and HDAC1 via the POZ/BTB domain,51,52 and therefore contributes a second binding site for corepressor proteins. Therefore, although pharmacologic doses of ATRA induce release of corepressors from the RARA portion of the fusion protein, the corepressors binding to ZBTB16 are unaffected (Fig. 72.3C).43,53 Significantly, concomitant treatment of cells with HDAC inhibitors such as trichostatin A (TSA) restores ATRA sensitivity, since TSA inhibits the deacetylase activity of the corepressors on the ZBTB16 moiety.49,52


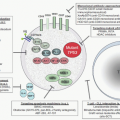
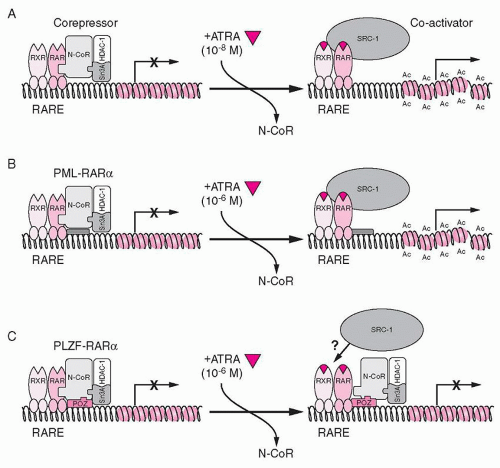
FIGURE 72.3. Model for the role of nuclear corepressors and retinoid acid receptor α (RARA) fusion proteins in the pathogenesis and treatment of acute promyelocytic leukemia. A: In the absence of all-trans retinoic acid (ATRA), RARA, promyelocytic leukemia (PML)-RARA, and promyelocytic leukemia zinc finger (PLZF; now known as ZBTB16)-RARA associate with N-CoR/sin3A/HDAC1 corepressor complex, which deacetylates histone tails, resulting in a compressed chromatin and transcriptional repression. Binding of ATRA at a physiologic concentration induces a conformational change in RARA, causing release of the corepressor complex and binding of coactivator (SRC-1) with histone acetyltransferase activity. Acetylation (Ac) of histone tails opens up the chromatin, facilitating transcriptional activation. B: In the case of PML-RARA protein, pharmacologic doses of ATRA are required to achieve dissociation of the N-CoR repressor complex. C: Because of additional interactions of the PLZF (ZBTB16) moiety of PLZF-RARA fusion protein with corepressors, they do not dissociate even in the presence of pharmacologic doses of ATRA. Therefore, the chromatin still remains in the repressed state. From Guidez F, Ivins S, Jhu J, et al. Reduced retinoic acid-sensitivities of nuclear receptor corepressor binding to PML- and PLZF-RARα underlie molecular pathogenesis and treatment of acute promyelocytic leukemia. Blood 1998;91:2634-2642, with permission.

Subsequent studies have demonstrate that PML-RARA recruits the polycomb-repressive complex 2 (PRC2) to the promoters of its gene targets. The PRC2 has a H3K27 methylase activity and can initiate gene repression through trimethylation of H3K27.54 ZBTB16-RARA additionally recruits polycomb-repressive complex 1 (PRC1); treatment with RA releases PRC2 from both PML-RARA and ZBTB16-RARA, but does not release PRC1 from ZBTB16-RARA.55


Core-Binding Factor Translocations

The t(8;21) is present in approximately 15% of patients with acute myeloid leukemia,56,57 and the RUNX1 (runt-related transcription factor 1, formerly called AML1) gene, cloned from the t(8;21) (q22.3;q22) breakpoint,58,59 is mutated in another 3% of AML. The activity of the murine counterpart of RUNX1 was first described as part of the core-binding factor (CBF), which binds to a core enhancer sequence of the Moloney murine leukemia virus long terminal repeat.60 Another component of CBF, the non-DNA-binding CBFβ was found to be associated with inversion 16 in AML.61 Finally, the fusion partner of RUNX1 in t(8;21), named RUNX1T1, or ETO (eight-twenty-one), also encodes a transcriptional regulator.62 A gene related to RUNX1T1, CBFA2T3 (or MTG16), is involved in yet another translocation involving RUNX1, t(16;21).63 The structures of the fusion proteins resulting from these CBF translocations are shown in Figure 72.4.

RUNX1 is located at chromosome 21q22.3 and is encoded by 12 exons over 260 kb of DNA. The N-terminal portion of the protein contains the runt homology domain (RHD), which is homologous to the Drosophila runt protein64 and is responsible for the official HUGO name, RUNX1. This is the DNA-binding domain and it is mutated in familial platelet disorder (FPD) and in AML associated with RUNX1 mutations.65,66 CBFB interacts via this domain and changes the conformation of RUNX1 to increase DNA-binding affinity.67 C-terminal to the RHD are potential MAP kinase phosphorylation sites, followed by three weak activation domains, a nuclear matrix target signal, a dimerization domain, and sequences that are recognized by corepressor proteins (reviewed in Ref. 68).

The CBFs are essential for hematopoietic development. Gene deletion of either Runx169 or Cbfb70 in mice results in fetal death at E11.5 to 12.5. These embryos lack all fetal hematopoiesis. Further transgenic experiments have demonstrated that Runx1 is essential for development of HSCs in the aorta/gonadal/mesodermal (AGM) region, the source of definitive hematopoiesis.71 The essential role of RUNX1 in hematopoietic development appears to be through its function as a transcriptional activator. It regulates lymphoid genes such as B-cell tyrosine kinase, T-cell receptor α and β,72 cytokines (interleukin-3 [IL3],73 GM-CSF74), and granulocyte proteins (myeloperoxidase and neutrophil elastase),75 to name a few. In addition, RUNX1 acts as a transcriptional repressor of genes such as p21Waf1/Cip1 via interactions with the mSin3a corepressor76 and with SUV39H1, a histone methyltransferase.77

The ETO gene, now called RUNX1T1, was cloned from the t(8;21) fusion58 and is the mammalian homolog of the Drosophila
nervy gene.78 The four homology domains shared with the Drosophila protein include a region of similarity to TAF110, a hydrophobic heptad repeat (HHR), an ND domain of undetermined function, and two zinc finger motifs that may be a protein-protein interaction domain (Fig. 72.4A).68 RUNX1T1 does not appear to bind DNA specifically on its own. However, it may act as a corepressor protein.79 It associates with N-CoR and mSin3A, and directly binds to the Class I HDACs, HDAC-1, HDAC-2, and HDAC-3 (Fig. 72.4A).80


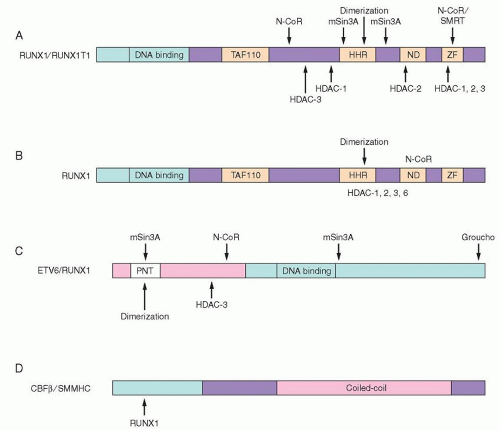
FIGURE 72.4. Schematic diagram of the t(8;21), t(16;21), t(12;21), and inv(16) fusion proteins with known corepressor contacts. A: t(8;21) RUNX1/RUNX1T1. The RUNX1 portion is shown in light pink, with the DNA-binding domain indicated. The RUNX1T1 portion is the dark pink box with domains conserved between RUNX1T1 and its Drosophila homolog in light gray boxes. Known contacts with corepressors and histone deacetylases are shown. B: t(16;21) RUNX1-MTG16 (now known as CBFA2T3). RUNX1 is shown as a light pink box, and MTG16 is shown in a similar manner to RUNX1T1 in A. C: t(12;21) ETV6-RUNX1. ETV6 is the dark pink box, with the conserved pointed (PNT) domain indicated. The RUNX1 portion is the light pink box. Interactions with corepressors and HDACs are shown. D: Inv(16) CBFB-SMMHC (now known as MYH11). The CBFB portion, which interacts with RUNX1, is light pink, and the SMMHC is dark pink, with the coiled-coil domain indicated as well as the C-terminal portion, which is necessary for interaction with mSin3A and HDAC8.77 HHR, hydrophobic heptad repeat; ND, nervy domain; TAF110, a domain with homology to the TAF110 coactivator; ZF, zinc finger domain. From Hiebert SW, Lutterbach B, Amann J. Role of corepressors in transcriptional repression mediated by the t(8;21), t(16;21), t(12;21), and inv(16) fusion proteins. Curr Opin Hematol 2001;8:197-200, with permission.

In the t(8;21) translocation, the RUNX1 gene is fused to the RUNX1T1 gene on chromosome 8. The breakpoint in the RUNX1 locus is between exons 5 and 6,81 yielding a fusion protein with the N-terminal 177aa of RUNX1.58 In this fusion protein, the DNA-binding domain is present, but the C-terminal activation domains, corepressor interaction sites, and nuclear localization signals (NLSs) of the wild type are not present (Fig. 72.4A).68 The breakpoint in the RUNX1T1 gene occurs in the introns between the first two alternative exons of RUNX1T1, resulting in the inclusion of almost all of the coding region for RUNX1T1 in the fusion transcript.58

The RUNX1-RUNX1T1 protein specifically binds to the same DNA-binding site as RUNX1 and can heterodimerize with CBFB.82 Therefore, the RUNX1-RUNX1T1 protein can act as a dominant negative inhibitor of wild-type RUNX1. However, cotransfection experiments demonstrated that RUNX1-RUNX1T1 can also function as an active transcriptional repressor, not only inhibiting activation of a reporter gene containing the GM-CSF receptor promoter by cotransfected RUNX1, but also reducing the expression of the reporter gene below baseline.83 The ability of RUNX1-RUNX1T1 to act as a transcriptional repressor depends on its association with HDACs (via RUNX1T1; Fig. 72.4A), since the HDAC inhibitor TSA can abrogate effects of RUNX1-RUNX1T1 on the cell cycle.80 In addition, examination of the M-CSFR gene in Kasumi-1 cells (high expressors of RUNX1-RUNX1T1) reveals an increase in histone H3Lys9 methylation.84 Targets of RUNX1-RUNX1T1 repression are presumed to include genes important for granulocyte differentiation. In addition, RUNX1-RUNX1T1 represses the tumor suppressor genes P14ARF and NF1.85,86 P14ARF stabilizes TP53 by antagonizing MDM2, an inhibitor of TP53.87 Therefore, repression of P14ARF reduces the checkpoint control path of TP53, and may be a key event in t(8;21) leukemogenesis. The promoter of P14ARF has eight RUNX1 DNA-binding sites, and wild-type RUNX1 can activate P14ARF. However, transfection of RUNX1-RUNX1T1 into cells that have only low levels of RUNX1 and high endogenous levels of P14ARF results in repression of P14ARF. Samples of bone marrow from patients with t(8;21) leukemia have low levels of P14ARF transcript by quantitative real-time polymerase chain reaction analysis.85 Surprisingly, expression of RUNX1-RUNX1T1 in myeloid progenitor cells inhibits cell cycle progression. However, this may contribute to leukemogenesis by allowing time for accumulation of mutations in a cell immune from TP53-induced apoptosis due to inactivation of P14ARF.85


Finally, inversion 16, present in about 8% of AML cases, involves the CBF complex member CBFB and is associated with a morphologically distinct subset of AML, previously considered M4Eo in the French-American-British Cooperative Group Classification. This disease is a myelomonocytic leukemia with abnormal eosinophils that have dark purple as well as orange granules.35 This cytogenetic abnormality in which the CBFB gene is fused to the smooth muscle myosin heavy-chain (SMMHC) gene, MYH11, results in fusion of the first 165aa of CBFB to the C-terminal coiled-coil region of SMMHC protein (Fig. 72.4D).61 A C-terminal region of SMMHC/MYH11 is necessary for the activity of CBFB/MYH11 as a transcriptional corepressor, and this region also associates with mSin3a and HDAC8. Presumably CBFB/MYH11, which cannot bind DNA on its own, interacts with RUNX1 to form a transcriptional repressor complex.88

A number of experiments demonstrate that the CBF translocations are necessary but not sufficient for induction of leukemia. In order to determine whether expression of RUNX1-RUNX1T1 is sufficient to produce leukemia, mice were generated with a conditional Runx1Runx1t1 knock-in allele using the Lox-Cre system. This obviates the embryonic lethality that results when Runx1Runx1t1 is introduced into transgenic mice (recapitulating the phenotype of the Runx1 null mouse). No leukemia developed in 20 Runx1Runx1t1+ mice in 11 months, and no hematologic abnormality was detected except for a slight increase in the number of hematopoietic colony-forming cells. Interestingly, expression of Runx1Runx1t1 did not cause a significant block in differentiation of hematopoietic precursors. When the mice were mutagenized with the DNA alkylating agent, ethylnitrosourea (ENU), 31% of the mice developed granulocytic sarcoma or AML.89 This supports the hypothesis that several genetic “hits” are necessary for the development of leukemia.

Another study used retroviral transduction of CD34+ human hematopoietic progenitor cells to investigate the effect of RUNX1-RUNX1T1 on proliferation and differentiation.90 In mice reconstituted with RUNX1-RUNX1T1 expressing HSCs there was an expansion of the HSC population and immature myeloid cell populations, although the mice did not develop acute leukemia.91 Therefore, the expression of RUNX1-RUNX1T1 promotes accumulation of immature cells and prolongs the period of time during which progenitor cells may accumulate additional mutations.

Further support for the hypothesis that genetic mutations besides a mutant RUNX1 locus are necessary for development of acute leukemia comes from the study of patients with FPD with a propensity to develop AML (FPD/AML). These patients have mutations in one allele of RUNX1.92 They have defective platelets and progressive pancytopenia, and develop myelodysplasia and a high incidence of AML with age. However, second mutations appear to be necessary before progression to AML occurs. This implies that acquisition of additional mutations is necessary for development of leukemia.


CCAAT/Enhancer Binding Protein-a

CCAAT/enhancer binding protein-α (CEBPA) is a transcription factor that regulates granulocytic differentiation.93 Cytogenetically silent mutations of CEBPA have been identified in about 10% of AML cases.94 In addition, mutations in other oncogenes in leukemia often lead to CEBPA downregulation. For example, RUNX1-RUNX1T1 represses the CEBPA promoter.95 FLT3-ITD activation of ERK leads to modification of CEBPA which reduces its activity.96

In addition, the CEBPA promoter is methylated in half of AML cases.97 The importance of CEBPA in granulocyte differentiation is demonstrated by the lack of mature granulocytes in Cebpa knockout mice,98 while its conditional expression triggers granulocyte differentiation in bipotential precursors.99 CEBPA transactivates the genes for G-CSF and GM-CSF receptors and several granulocyte-specific proteins. The gene produces two proteins using alternative start sites. The larger and predominant 42-kD protein consists of two N-terminal transactivating domains, with a C-terminal bZIP domain consisting of a basic (b) region that mediates DNA sequence binding and a leucine zipper (ZIP) domain that mediates dimerization.100 The shorter 30-kD protein is transcribed from an alternative internal start site, and retains its bZIP domain but lacks the first transactivation domain. Mutations in CEBPA are of two types: C-terminal bZIP domain mutations and N-terminal truncating mutations that lead to enhanced production of the 30-kD protein.101,102,103 The former type inhibits dimerization and DNA binding. The latter type dimerizes with the long form, but inhibits transactivation by the dimer, functioning in a dominant negative manner. In two-thirds of AML with CEBPA gene mutations, one allele has an N-terminal mutation and the other allele has a C-terminal variant. Several families with familial AML have been documented to have germline CEBPA N-terminal mutations, and progression to AML has been shown to correlate with a somatic mutation in the C-terminus.104 CEBPA mutations most often occur in intermediate-risk AML with normal cytogenetics, and these patients have a significantly improved outcome.94 Interestingly, mutation of CEBPA at both alleles is associated with a better overall survival than mutation of CEBPA at a single allele.105 Approximately one-third of AML with CEBPA mutations also have FLT3 mutations, and the CEBPA mutation confers a more favorable prognosis in this group of AML patients as well.34


GATA1

GATA1 is a zinc finger transcription factor that regulates erythroid and megakaryocytic differentiation. In the acute megakaryoblastic leukemia (AMkL) that occurs in children with Down syndrome (DS), mutations of GATA1 have been described in all tested cases.106,107,108 Familial missense mutations in GATA1 result in a syndrome of dyserythropoietic anemia and thrombocytopenia, while conditional knockout of Gata1 in megakaryocyte precursors in mice leads to thrombocytopenia and megakaryoblast proliferation. Approximately 10% of DS patients develop transient myeloproliferative disorder (TMD) in the neonatal period (usually in the first week, almost always within the first 2 months of life), and these patients have mutations in GATA1.106,109 About one-third of DS patients with TMD later develop AMkL within 5 years, and identical GATA1 mutations have been identified in the AMkL blasts as were present in the TMD. A large study demonstrated that there is no difference in the GATA1 mutations present in patients who just developed TMD compared to patients who went on to AMkL.110 The mutations in GATA1 result in transcription of a truncated form that lacks its N-terminal transactivation domain, GATA-1s. This shorter form has similar DNA-binding activity but reduced transactivation compared to wild-type, and it therefore can act in a dominant negative manner. By introducing the truncated GATA1 into GATA1-deficient fetal liver progenitor cells by retroviral transduction, Muntean and Crispino demonstrated that GATA-1s restored terminal differentiation but that abnormal proliferation occurred.111 Interestingly, analysis of a knock-in mouse model where Gata1s replaces wild-type Gata1 demonstrates that fetal liver megakaryocytes abnormally proliferate, but that megakaryocyte proliferation is normal in adult bone marrow.112 This may explain why TMD occurs in the neonatal period in DS patients. Research into the gene(s) on chromosome 21 that cooperate with mutant GATA1 to produce AMkL in DS children is ongoing; a recent mouse study reported evidence that Dyrk1a (dual-specificity tyrosine-phosphorylation-regulated kinase 1A) can cooperate with mutant Gata1 to promote megakaryoblast expansion.113


AMkL in Down syndrome is sensitive to cytosine arabinoside/anthracycline-based chemotherapy, with event-free survival rates of 80% to 100%.114 Interestingly, a putative target of GATA1 regulation is cytidine deaminase (CDA), which inactivates ara-C by deamination to the inactive uridine arabinoside. Presumably failure of GATA-1s to transactivate CDA increases the efficacy of ara-C treatment.111


Epigenetic Factors Modifying Chromatin and DNA


IDH1/2 and TET2 Mutations

In the whole genome sequencing of blasts from a patient with cytogenetically normal AML, mutations in isocitrate dehydrogenase 1 (IDH1) were detected and were found to be present in 16% of a panel of 80 cytogenetically normal AML samples.30 IDHI mutations had previously not been described in AML, though IDH1/2 mutations are common in gliomas.115 In a further screen of AML DNA, it was found that IDH1/2 mutations are mutually exclusive with mutations in TET2 (ten-eleven translocation 2) in de novo AML (Fig. 72.5). Additional findings suggesting a functional link between the products of these two genes are that AMLs with mutations in IDH1 have similar patterns of DNA hypermethylation as AMLs with mutations in TET2.116 In addition, these two mutational categories of AML share patterns of aberrant gene expression at the level of 93%.116 The link became clear upon further investigation of the enzymatic activity of IDH1/2 and TET1/2. Wild-type IDH1/2 catalyzes production of α-ketoglutarate (α-KG), whereas the neomorphic enzymatic activity of mutant IDH1/2 produces 2-hydroxyglutarate (2-HG). α-KG-dependent enzymes such as histone demethylases and TET1/2 are inhibited by 2-HG, which is structurally similar enough to α-KG that it can bind in place of α-KG and inhibit these enzymes.117 The TET proteins catalyze the conversion of 5-methyl cytosine (5mC) to 5-hydroxymethyl cytosine (5hmC), which is thought to be a first step in demethylation of the cytosine.118 Experiments using a fluorescent-tagged antibody to 5hmC demonstrate that cotransfection of plasmids encoding IDH1 and TET2 result in a global increase in 5hmC, whereas cotransfection of plasmids encoding mutant IDH1 and wild-type TET2 fail to demonstrate an increase in 5hmC.117 Therefore, mutations in IDH1 and TET2 both produce increased DNA methylation: mutant IDH1 by inhibiting TET2, and mutant TET2 by loss of its ability to convert 5mc to 5hmC, and thereby promote demethylation.116, 117, 118 and 119 The significance of these changes for pathogenesis of AML is demonstrated by experiments in which either stable expression of mutant IDH1 or shRNA-mediated knock-down of TET2 in primary mouse bone marrow cells resulted in increased c-kit expression and decreased expression of the mature myeloid markers Mac-1 and Gr-1 by flow cytometric analysis.116 Therefore, the hypermethylation and resultant silencing of genes as a result of IDH1 and TET2 mutations presumably inhibit myeloid differentiation and thereby promote development of AML. This mechanism suggests new avenues of molecular therapy in that drugs that mimic α-KG or that inhibit the mutant IDH1/2 may restore proper enzymatic function to histone demethylases and TET2, promoting normal histone and DNA methylation patterns.117 In studies performed to date, mutations in IDH1 and TET2 have not been shown to have a significant impact on survival.105


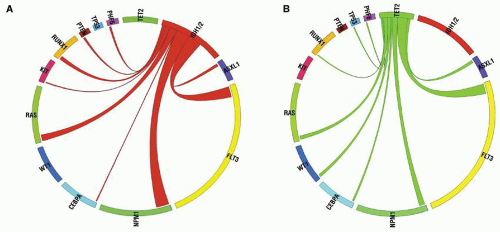
FIGURE 72.5. IDH1/2 mutations are mutually exclusive with mutations in TET2 in de novo AML. A: Circos diagram revealing relative frequency and pairwise co-occurrences of mutations in IDH1 and IDH2 in a cohort of 385 patients with de novo AML. B: Circos diagram revealing relative frequency and pairwise co-occurrences of mutations in TET2 in a cohort of 385 patients with de novo AML. Reprinted from Figueroa ME, Abdel-Wahab O, Lu C, et al. Leukemic IDH1 and IDH2 mutations result in a hypermethylation phenotype, disrupt TET2 function, and impair hematopoietic differentiation. Cancer Cell 2010;18:553-567, with permission from Elsevier.


DNMT3A

Deep sequencing of DNA from the first AML patient with a normal karyotype revealed additional mutations, including a mutation in DNA methyltransferase (DNMT3A). Sequencing of the DNMT3A gene in DNA from 281 AML patients revealed a mutation rate of 22.1%. The DNMT3A mutations were found in patients with intermediate-risk cytogenetics. As a group these patients had a mean overall survival significantly shorter than the patients with wild-type DNMT3A: 12.3 months compared to 41.1 months.31 The mutations detected in patients with AML map predominantly at the interface where they disrupt tetramerization of the DNMT3A molecules. Dimeric DNMT3A molecules still have methylase activity, but they dissociate from DNA more quickly than wild-type, so
that fewer cytosines in a CpG island are methylated.120 The effect on tetramerization explains why the DNMT3A mutations are dominant negative, usually occurring in just one allele. Global methylation does not seem to be affected in DNA from AML with mutated DNMT3A, but analysis of DNA methylation by MeDIP-Chip (methylated DNA immunoprecipitation-Chip) analysis in a matched set of DNAs from 5 AML patients with mutated DNMT3A and 5 AML patients with wild-type DNMT3A demonstrated 182 genomic sites where the DNA from patients with mutated DNMT3A was hypomethylated.31 Studies of DNA methylation in Dnmt3a-null murine HSCs demonstrated a complex story with poor correlation between changes in methylation sites and changes in gene expression comparing wild-type to Dnmt3a-null HSCs. However, changes in gene expression patterns may be due to changes in methylation of regulatory regions of directly affected genes, whose expression then alters regulation of many other genes by mechanisms other than methylation. Transcriptional profiling of Dnmt3a-null HSCs did reveal that genes involved in the multipotency of normal HSCs were upregulated, whereas genes necessary for differentiation of the HSCs were downregulated. This suggests that the DNMT3A mutations may contribute to the block in differentiation that occurs in leukemic blasts. Interestingly the Dnmt3a-null mice have not yet developed leukemia, suggesting that DNMT3A mutation alone is not sufficient for leukemogenesis.121

Only gold members can continue reading. Log In or Register to continue

Stay updated, free articles. Join our Telegram channel

Oct 21, 2016 | Posted by in HEMATOLOGY | Comments Off on Molecular Genetics of Acute Leukemia

Full access? Get Clinical Tree

Get Clinical Tree app for offline access