Molecular Genetic Aspects of Non-Hodgkin Lymphomas
Molecular Genetic Aspects of Non-Hodgkin Lymphomas
Annette S. Kim
INTRODUCTION
The non-Hodgkin lymphomas (NHLs) are a diverse group of mature lymphoid neoplasms with a wide range of cellular morphologies, histologic presentations, clinical presentations, cells of origin, etiologies, and responses to therapy. Due to the protean manifestations, NHLs remain a significant diagnostic challenge for hematopathologists. In fact, using morphology alone, the interpathologist consensus is 41% to 93%, depending on the diagnosis.1 This lack of consensus is especially true of the T-cell lymphomas which are even more varied in presentation than their B-cell counterparts. Incorporation of clinical history and immunophenotyping can improve the consensus, but pathognomonic diagnostic clues are often missing.
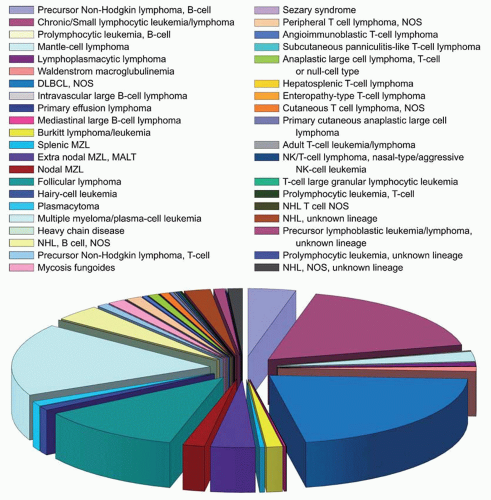
The NHLs represent 4% of all cancers with an overall annual incidence of 19.6/100,000 in the United States (Fig. 87.1), making it the seventh most common cancer in both males and females.2,3,4 Despite their relatively high frequency in clinical practice, the NHLs have defied numerous attempts to classify them. Early classification schemes relied heavily upon morphology. However, as the classification of acute leukemias moved to emphasize the cell of origin, so too did lymphoma classifications attempt to identify a cell of origin and stage of maturation. Most recently, leukemia classification schemes have advanced beyond morphologic or immunophenotypic criteria to molecular genetic criteria for the subclassification of acute leukemias. Not only are leukemias defined by their genetic translocations, but rapidly molecular mutations, invisible on the metaphase cytogenetic level of resolution, are defining diagnostic and prognostic categories.
In fact, the researchers of the NHLs were pioneers in the discovery of molecular genetic underpinnings of hematolymphoid malignancies. The first reciprocal translocations that caused tumorigenesis were identified in Burkitt lymphoma (BL), translocations involving the MYC oncogene.5 These were followed by the discovery of the t(14;18) in follicular lymphoma (FL).6 However, after an initial flurry of activity, the NHLs have lagged behind their leukemia counterparts in the identification of the molecular genetic causes of neoplasia. The most recent 2008 World Health Organization classification scheme still largely relies upon cell of origin as the primary discriminator of the B-cell NHLs,4,7,8 and T-cell lymphomas are even less well understood in general, with many of the classifications defined by the site of the tumor. Molecular changes in NHLs, although often associated with a given type of lymphoma, do not solely characterize that entity.4,9 For example, 10% to 15% of FLs lack the hallmark t(14;18),10 whereas t(14;18) can be seen in some types of de novo diffuse large B-cell lymphoma (DLBCL) without a preceding history of FL. Other molecular genetic changes are often more phenomenologic, rather than pathognomonic, of the particular type of lymphoma and only further highlight the molecular heterogeneity of these neoplasms.
However, other molecular aberrations are likely as yet unrecognized and new efforts in next generation sequencing (NGS) and mutational analysis in general are slowly elucidating new markers of disease. It is possible, however, that disease classification in the future of NHL will not be defined by single molecular aberrations, but by pathway dysregulation. Therefore, more global methods of assessing molecular genetic aberrations may become more prominent in the diagnosis and prognosis on NHLs in the years to come.
OVERVIEW OF METHODOLOGIES
Commonly Used Techniques
One of the mainstays of molecular testing in lymphoid malignancies is the use of clonality testing. These methods are based upon the unique rearrangement of either the B-cell receptor (BCR), composed of an immunoglobulin (Ig) heavy chain and one of two light chains, or the T-cell receptor (TCR), heterodimers of either α/β subunits or γ/δ subunits. However, there are other recurrent reciprocal translocations that can also be assessed by polymerase chain reaction (PCR), quantitative real-time polymerase chain reaction (q-PCR), fluorescent in situ hybridization (FISH), or metaphase cytogenetics (MC). The latter two methodologies can also identify other structural or numeric aberrations as well. These other methodologies, often in conjunction with clonality testing, are useful diagnostically as well as potentially for the measurement of minimal residual disease (MRD) during therapy monitoring. Gene naming conventions throughout the chapter follow the nomenclature recommendations set forth by the HUGO Gene Nomenclature Committee.11
Clonality Testing
Immunoglobulin Gene Rearrangements
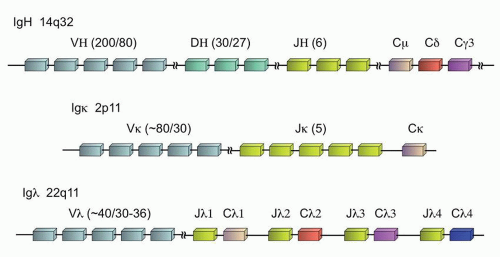
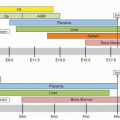
The expression of Ig is one of the defining characteristics of all mature B-cells. At the earliest stages of B-cell ontogeny, recombination of the Ig heavy chain (IGH@) can be detected, well before the expression of the complete heterotetrameric product composed of two heavy chains and two light chains on the surface of the B-cell, where the light chain can be either kappa or lambda (Fig. 87.2). Although the individual Ig genes are located at disparate locations in the genome—the IGH@ locus on chromosome 14q32, the kappa locus (IGK@) at 2p11, and the lambda locus (IGL@) at 22q11—the genes are all structured in a similar fashion to enable the unique somatic recombination of germline gene segments that create the antigen specificity of the final Ig protein heterotetramer. During this recombination process, individual variable regions (V regions), joining regions (J regions), and constant regions (C regions) are selected which form the body of the final Ig chain and contribute to the antigen specificity. In addition, the IGH@ locus also contains diversity regions (D regions), for a final VDJC rearrangement (versus VJC for the light chains).12
Each gene segment is marked for potential recombination by a recombination signal sequence (RSS) which is acted upon by the recombination-activating genes 1 and 2 to create double-stranded DNA breaks that are recombined through nonhomologous end-joining, with assistance from the DNA-bending proteins, HMG1 and HMG2. The D-J recombination is the first rearrangement of the IGH@ locus, followed by V-DJ and VDJ-C. At each recombination site, these double-stranded breaks can be further modified by being filled in with palindromic nucleotide insertions (P nucleotides), removal of one to two nucleotides through a random exonuclease activity, or further varied by the addition of N nucleotides that are not present in the germline sequence through terminal deoxynucleotidyl transferase. These actions also contribute to the diversity of the Igs. The cut and modified ends of the coding sequence are then also repaired by nonhomologous end-joining.12
FIGURE 87.1. Surveillance epidemiology and end result (SEER) data for the relative incidence of non-Hodgkin lymphomas. See Reference 3.
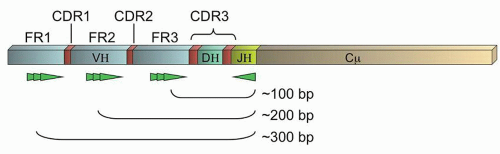
The variable regions of all the Ig proteins form a canonical beta-sheet structure which necessarily means that the majority of amino acids are paradoxically highly conserved.13 These conserved regions are termed the framework regions, FR1-3 (Fig. 87.3). Between these framework regions are the truly variable complementary determining regions (CDRs1-3) which encode sequences of approximately 10 amino acids that project from the tips of the beta-sheet as fingers reaching out to contact antigen. Therefore, although the IGH@ gene contains up to 200 different V regions (approximately 80 of which are widely used in human biology),12 consensus primers can be constructed against the V regions that will permit the amplification of the gene across the VDJ recombination sites by PCR. Due to the variability of the encompassed CDRs as well as the diversity created by the random exonuclease activity and N nucleotide addition, physiologic B-cells should each have a distinctively sized PCR product, and clonal populations should have identical PCR products. This forms the basis of the Ig gene rearrangement studies by PCR. Southern blot (SB) methods, which look for the unique rearrangements on unamplified DNA, have been considered the gold standard for gene rearrangement studies, but have fallen into disuse with the ease of PCR-based methods and now next generation sequencing.
FIGURE 87.2. Immunoglobulin genes and their chromosomal organization. The number of subunits of each type (V, D, or J) is noted in parentheses as follows: total number of subunits/number of subunits in physiologic use.
FIGURE 87.3. Schematic of an immunoglobulin gene rearrangement. Shown are the framework regions (FR1-3, light blue), complementary determining regions (CDRs, red; note CDR3 is composed of the DH region and the flanking variable junctions created by random exonuclease activity and N and P nucleotide insertions), and representations of potential locations of primers in the FRs noted (bright green). General sizes of polymerase chain reaction (PCR) products are indicated.
PCR primers may be constructed against any of the three framework regions. Although more variability is theoretically captured by using FR1 primers, the PCR products are longer and therefore more difficult to obtain using standard methods (Fig. 87.3). Therefore, many labs use only FR3 primers (coupled with J region primers), or a combination of FR3 and FR2 primers. However, somatic hypermutation (SHM), a process that occurs physiologically in the germinal centers of lymphoid tissues when a B-cell is exposed to antigen, can cause sequence changes in both the CDRs and the FRs.7,13 This normal physiologic process can prevent the binding of individual primers should a mutation occur in the targeted “consensus” sequence. Thus, SHM limits the clinical sensitivity of limited sets of primers to detect clonal populations of B-cells (e.g., some clones may not be detected by PCR due to failure of the consensus primers to bind to that clone’s specific sequence). However, several commercial kits are now available that utilize multiplexed sets of primers against all the FRs, in the hopes that at least one primer will have an intact unmutated sequence to permit amplification of the unique PCR product.14,15,16,17 In addition, primers against IGK@ and IGL@ can also be utilized, although the PCR products do not form a well-dispersed Gaussian distribution as in the case of the IGH@ assay, complicating their interpretation.16
Table 87.1 shows the range of clinical detection rates (clinical sensitivity) of multiplexed IGH@ PCR assays compiled from several published papers.14,15,17 These data clearly demonstrate the high clinical detection rates for neoplasms of pre-germinal center B-cells (pre-GCB). However, the gene rearrangement assays have a lower clinical sensitivity for neoplasms of post-GCB-cells and particularly of germinal center lesions, during which active SHM may be ongoing, resulting in very low detection rates.7,18IGK@ or IGL@ assays can be used if the IGH@ assay fails to detect a clonal rearrangement for a known neoplastic B-cell process. Therefore, combinations of primers of all three frameworks of IGH@ and for IGK@ are required to ensure reasonable clinical sensitivity across all B-cell neoplasms.14,15,17 On the other hand, the detection of an apparently clonal population does not equate with neoplasia, as pseudoclonality can be seen in reactive conditions with a strong reaction to a particular antigen, or in cases of a limited B-cell repertoire.
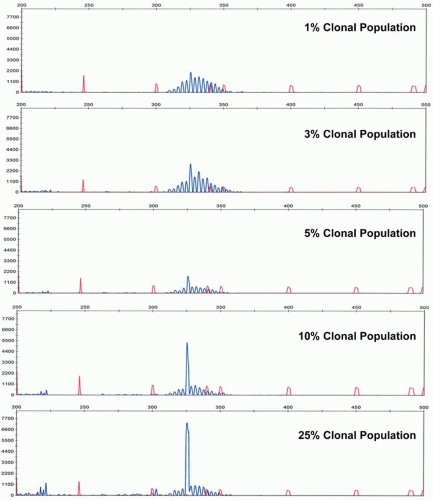
Analytical sensitivity of the IGH@ PCR assay depends upon the number of polytypic background B-cells. In cases of limited background B-cells, the neoplastic clone can be detected at 1 cell in 100 nonneoplastic (and non-B lineage) cells, or approximately 1%. However, in cases of significant numbers of background polytypic B-cells, the detection of a clonal peak rising above the Gaussian distribution of background B-cell rearrangements can be as low at roughly 5% analytical sensitivity (Fig. 87.4). The analytical sensitivity can be increased by the design of allele-specific oligonucleotide primers. However, this technique requires sequencing of the patient’s specific clonal Ig rearrangement. With the advent of rapid sequencing methods, this may become more practical in the future. However, recently next generation sequencing itself has been developed as a method to determine clonality and to monitor MRD.18a
T-cell Gene Rearrangements
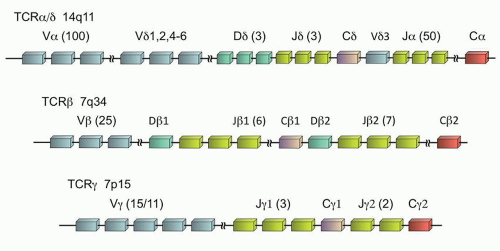
The TCR is a heterodimer of two proteins that form the functional receptor, either αβ or γδ. During T-cell ontogeny, the γ (TRG@) and δ (TRD@) genes rearrange first, so that the γδ receptor is the first to be expressed. Subsequently the α (TRA@) and β (TRB@) genes rearrange, and ultimately 85% to 98% of mature peripheral T-cells express the αβ receptor.19,20 It is interesting that the location of these genes is such that the δ locus is actually embedded within the α gene on chromosome 14q11 (Fig. 87.5). Thus, in the vast majority of the cases, the subsequent rearrangement of the α gene results in excision of the δ gene from the cell’s DNA, and any previously rearranged sequences are lost. However, the β and γ loci, although both on chromosome 7, are distinct (7q34 and 7p15, respectively), and the rearrangement of the γ loci is retained, even if the cell ultimately expresses the αβ T-cell receptor.
Like the immunoglobulin genes, the TCR genes are composed of V, D (β and δ genes only), J, and C regions (Fig. 87.5). However, unlike the immunoglobulin genes, there are no specific framework regions, and therefore consensus primers are difficult to design for the various V regions. Therefore, with the exception of homology between a few of the V regions, separate V region primers are required to assess all physiologically relevant TCR gene rearrangements. Due to the location of the α gene within the δ gene which limits its utility, the limited number of γ gene V regions (only Vγ1-11 are physiologically relevant of the 15 Vγ segments),21 and the homology between the Vγ segments 1 to 8 which allows the use of a common primer for those segments, typically TRG@ is the common target of most clinical assays, with or without the addition of TRB@ assessment as well.
TABLE 87.1 CLINICAL SENSITIVITIES OF THE IMMUNOGLOBULIN GENE REARRANGEMENT STUDIES14,15,17
FIGURE 87.4. Analytical sensitivity of immunoglobulin gene rearrangement studies as illustrated by dilutions of a clonal population into a polyclonal background.
FIGURE 87.5. T-cell receptor genes. The number of subunits of each type (V, D, or J) is noted in parentheses as follows: total number of subunits/number of subunits in physiologic use.
The clinical sensitivity of the TRG@ assay is higher than for the corresponding Ig assay due to the absence of SHM of the TCR. However, the assay still does not detect 100% of all neoplastic rearrangements due to other acquired mutations, and the true clinical sensitivity is approximately 89% to 94%.15,17,22 In cases of a known neoplastic T-cell process, TRB@ assay can also be used to look for a clonal marker of disease. The analytical sensitivity of the TCR clonality assays is similar to that of the immunoglobulin assays, although for biologic reasons limited T-cell repertoires can often lead to pseudoclonality or oligoclonality in certain tissues (such as skin), making it easy to overcall or undercall TCR clonality results. Therefore, the presence of an apparently clonal population does not equate with neoplasia, and the absence of a clonal population does not exclude a neoplastic process. Next generation sequencing methods have also been developed for diagnostic and MRD purposes for the assessment of T cell clonality.18a
Southern Blot
As alluded to earlier, SB is the gold standard, albeit outdated, method for all clonality testing and has been used to test for various translocations or other chromosomal aberrations as well. First introduced in 1975, this technique uses unamplified genomic DNA from the sample which is fragmented using restriction enzymes.23 These cleavage products are separated by size via agarose gel electrophoresis and then transferred or “blotted” to a nitrocellulose membrane. The membrane is then treated with typically radiolabeled probes that are complementary to a particular sequence of interest. The radiolabel provides signal amplification at the final detection stage that affords an analytical sensitivity of approximately 2% to 3% tumor cells of the sample cellularity.
This method is extremely time consuming, labor intensive, and requires numerous precautions for the handling and disposal of radioactivity. For these reasons, SB has been replaced in most clinical laboratories by methods based upon PCR.
Polymerase Chain Reaction
PCR is a commonly used method for template amplification due to its ease, versatility, and analytical sensitivity. The achievable levels of amplification are such that as few as 1 neoplastic cell can be detected out of 105 to 107 cells (0.001% to 0.00001% analytical sensitivity). Amplification also permits the use of this assay in small sample volumes. In addition, if the size of the amplicon (product of the PCR reaction) is small, even partially sheared DNA, such as that obtained from formalin fixed paraffin-embedded tissue, is adequate for the assay. The high sensitivity of the assay also makes it ideal for the detection of MRD.
In this assay, forward and reverse primers (typically 15 to 25 bp in length) are generated against the target region. These primers may be specific for a mutated versus a wild-type sequence or may flank the area of interest (especially flanking areas of small insertions or deletions, or flanking a translocation site). Using a specific temperature-resistant polymerase (Taq polymerase) that allows repeated cycles of strand melting (separation of double-stranded DNA), primer annealing, and polymerase-mediated extension of the primers based upon the target sequence, the targeted region in DNA can be doubled per cycle. If compatible conditions can be designed for multiple sets of primers, the PCR assay can be multiplexed. The template can consist of genomic DNA, or mRNA that has been reverse transcribed into clonal DNA (cDNA).
PCR products, or amplicons, can be detected in several different ways. Qualitative detection methods include agarose gel electrophoresis and capillary electrophoresis, both of which allow the separation of amplicons by size. In the latter method, fluorescently tagged primers are used, which allows separation of the amplicons along the capillary tube and detection using a fluorescent camera as the separated products exit the tube. By using multiple different fluorophores on each primer set, even multiplexed assays can be analyzed by this method.
Quantitative detection methods can also be used, typically involving some version of quantitative real-time PCR (q-PCR). In this technique, fluorescence is directly proportional to the amount of amplicon generated. This fluorescence can be generated after the amplification is completed by the intercalation of a fluorescent dye, such as SYBR green, or can be continuously generated during each cycle of amplification by the release of fluorescence during the extension step (e.g., Taqman probes). Using pre-made dilutions of the desired amplicon to generate a standard curve, direct quantitation of the amount of the target in the sample can be made.
Fluorescent In Situ Hybridization
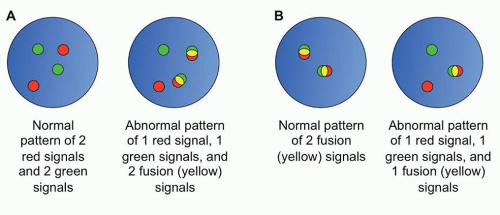
FISH is another molecular method of interrogating genomic aberrations. FISH utilizes longer probes than PCR (typically 200 to 400 bp in length) which bind in a complementary sequencespecific fashion to the intact chromatin of interphase cells.24 FISH is commonly used to identify balanced translocations, and can also identify copy number variations (CNVs) of large segments of chromatin. In the former case, by using probes directed against the translocation partners, each labeled with a different fluorophores, the presence of a translocation is marked by fusion of the two signals (Fig. 87.6). FISH can also be used in cases where the translocation partner is unknown by the use of breakapart probes, probes located adjacent to each other on either side of the putative breakpoint in the one known translocation partner, which appear as a fused signal when the gene is intact, and separate signals when a translocation occurs.
FIGURE 87.6. Examples of FISH patterns. A: Schematic of dual color dual fusion fluorescent in situ hybridization (FISH) probes. B: Schematic of breakapart FISH probes.
This method, like that of PCR methods, is necessarily targeted and therefore biased by the subjective nature of which probes are selected for study (Table 87.2). Unlike PCR, FISH has low resolution of the sites of aberrancy, in the range of 2 to 5 kb (kilobase pairs).24 The analytical sensitivity depends upon the nature of the probes utilized in the assay and the number of interphases assessed. However, typical analytical sensitivities range from 1% to 5% for 200 interphase cells evaluated. Nevertheless, FISH remains a mainstay in the identification of genetic aberrances in lymphoid lesions due to the variety of breakpoints and translocation partners in these malignancies which often limit the use of the highly targeted PCR methods.
Metaphase Cytogenetics
Conventional karyotyping, based upon metaphase cytogenetics (MC), is a mainstay in hematopathology due to its unbiased and uniform genomewide coverage (Table 87.2). Due to the requirement to culture the cells in order to obtain metaphase spreads and the time-consuming microscopy to generate the karyotypes, the method takes typically at least 2 days. In addition, terminally differentiated cells, such as mature lymphocytes and plasma cells, do not readily undergo mitosis, and therefore standard methods often fail to identify the neoplastic karyotype of most lymphoid neoplasms.25,26
TABLE 87.2 CHARACTERISTICS OF DIFFERENT GENOMEWIDE STUDIES
aCGH, array comparative genomic hybridization; aSNP, array single nucleotide polymorphisms; CN LOH, copy neutral loss of heterozygosity; FISH, fluorescent in situ hybridization; NGS, next generation sequencing; PCR, polymerase chain reaction; UPD, uniparental disomy.
a Clonality is typically defined as involving at least 2 of 20 metaphases.28 For PCR and NGS methods, depending on the design of the assay/experiment, different questions may be answered. For instance, if normal and tumor tissues are examined for a particular mutation, somatic versus germline mutational status can be ascertained by PCR.
Portions adapted from Reference 27.
The resolution of MC is low, 5 to 10 Mb (megabase pairs).27 In addition, due to the need to construct the individual karyotypes manually, even with the aid of computers, typically only 20 metaphases are examined, and the analytical sensitivity is therefore only approximately 10% (for balanced translocations, 2 of 20 metaphases must demonstrate the same abnormality for it to be considered a clonal change, and 3 metaphases must demonstrate the same CNV for it to be considered clonal).28 Thus, this methodology is of limited utility in MRD testing and often is not helpful for lymphoid neoplasms with routine culture conditions.
Other Techniques
Somatic Hypermutation
SHM testing can be used both to identify clonal rearrangements of the IGH@ gene and to calculate the percent of nucleotides that have undergone SHM in the V regions of IGH@. This assay has been used to understand the biology of many B-cell neoplasms. However, its main clinical utility has been in the determination of the mutational status in chronic lymphocytic leukemia/small lymphocytic lymphoma (CLL/SLL). Typically a cutoff of 98% homology to germline is used to determine the mutational status, with greater than 98% homology corresponding to the unmutated designation, which carries a poor prognosis in CLL, and less than or equal to 98% homology describing a somatically hypermutated state, which is associated with a better prognosis in CLL.29,30
PCR using typically FR1 primers or leader primers (primers located in the leader region upstream from FR1) are used in conjunction with partner JH primers. PCR can be performed on either genomic DNA (gDNA) or cDNA. Many laboratories report both results which typically are very similar, although each input type has its distinct advantages. Utilization of gDNA is the easiest to perform inasmuch as it involves the isolation of the more stable DNA from the samples (compared to labile RNA required for the preparation of cDNA) and avoids a requisite reverse transcription step. However, cDNA is better for the identification of function rearrangements as well as double in-frame small insertions and deletions (indels). In addition, it is better at defining the Ig isotype. After PCR, the amplicons can then be directly sequenced using labeled sequencing primers by capillary electrophoresis, or can be cloned into a plasmid and then sequenced following colony expansion and plasmid extraction. The latter method is required if there is significant background amplification (background polyclonal B-cells), but is quite time consuming and labor intensive.
Array Comparative Genomic Hybridization and Array Single Nucleotide Polymorphism
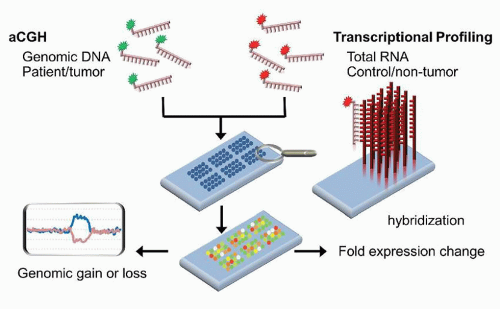
CGH was initially developed as a method to identify CNVs in patient tissues. The methodology is based upon the differential labeling of patient and control DNA, followed by competitively hybridizing those labeled samples to metaphase spreads. Areas of deletions would be seen as regions with a predominance of the control DNA fluorophore, whereas areas of duplications show a predominance of the patient DNA fluorophore. Due to the limitations of metaphase spreads, the array format was developed to contain an array of probes that span the genome (Fig. 87.7). The probes for array comparative genomic hybridization (aCGH) can be obtained from bacterial artificial chromosome (BAC)-derived sequences, cDNA, or from oligonucleotides. Using this method, CNVs and unbalanced translocations can be interrogated uniformly throughout the genome at a resolution as low as 5 to 6 kb (kilobase pairs) in some cases (Table 87.2).27,31,32 The analytical sensitivity varies from 2% to 30% sensitivity.
By contrast, aSNP (array single nucleotide polymorphisms) is a single-color experiment that hybridizes labeled patient DNA or amplicons to an array composed of probes that are sequence-specific to interrogate individual SNPs. Because these are designed to target specific SNPs at their nonrandom genomic locations, the genome coverage is not uniform and this method is not useful in identifying balanced translocations or in distinguishing germline from somatic changes.27,32 However, aSNP is especially useful in the identification of copy neutral loss of heterozygosity and uniparental disomy that are not assessed by aCGH. Analytical sensitivities are similar to those for aCGH. To leverage the advantages of both aSNP and aCGH, many commercial platforms are now available that combine the two array methods.
Due to the challenges of obtaining metaphases in lymphoid neoplasms, aCGH was rapidly applied to the study of chronic lymphocytic leukemia (CLL), for which disease aCGH can identify clonal abnormalities in 100% of cases.26 For comparison with FISH and metaphase cytogenetics, other studies have demonstrated the ability of aCGH to detect abnormalities in 12% of normal karyotype CLL cases26 and in 21% of cases where no aberration was detected by FISH.33
Metaphases are also difficult to obtain in plasma cell neoplasms, leading to the prominent role of FISH in the diagnosis and prognosis of myeloma. However, because FISH is targeted, it cannot provide an unbiased genomewide assessment as can be achieved by aCGH. Gutierrez et al. found CNVs by aCGH in 69% of myeloma patients and that those patients had significantly decreased overall survival.34 The prognostic significance of other specific loci, which include gains of 1q and 7q, have also been studied using aCGH.35,36 The latter study also highlighted the utility of this method in paraffin-embedded tissue.
Next Generation Sequencing
Whole genome sequencing (WGS) provides the theoretically optimal combination of uniform unbiased genomewide coverage with nucleotide-level resolution for the discovery of acquired genetic aberrations in oncology (Table 87.2). The caveats, of course, center upon the cost and analysis of the potentially terabytes of data accumulated by a single WGS analysis. Prior to 2005, nearly all DNA sequencing was performed using some variant of Sanger sequencing, a method by which sequencing was achieved by chain termination first described in 1977.37 These Sanger-based methods typically required large quantities of input DNA since the DNA needed to serve as the template for at least as many polymerase extension reactions as nucleotides to be sequenced. The polymerase products are separated by size to determine the sequence. This traditional sequencing is plagued by poor quality of the initial 15 to 40 bases of the sequence, and read lengths are limited to 500 to 1,000 bases.38
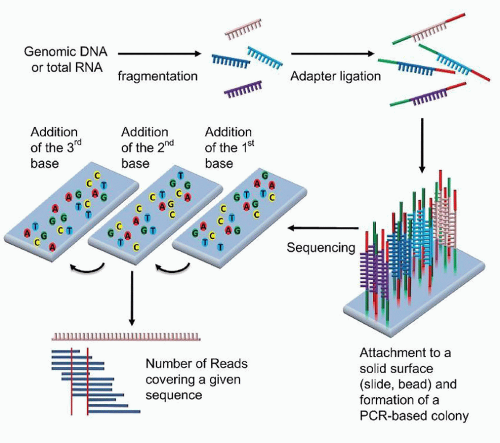
All NGS methodologies are based on read-through sequence determination, or sequence by synthesis, rather than chaintermination technology, and the sequencing is conducted in a massively parallel fashion (Fig. 87.8).38,39 Sheared DNA, the template, is immobilized in spatially fixed and arrayed positions by a variety of means and then iteratively interrogated by the repeated addition of each of the 4 nucleotides. Several methods of detection are utilized by the various commercial platforms. Illumina and Helicos BioSciences both use dye-labeled nucleotides which are reversible chain terminators; i.e., after detection of addition of a labeled nucleotide, the chain termination is chemically reversed before the next nucleotide is added (Fig. 87.7). Roche’s pyrosequencing-based technology and Ion Torrent’s semiconductor-based platform are both based upon the detection of the release of pyrophosphate or H+ ion, respectively, which are chemically produced each time a nucleotide is added by the polymerase. Applied Biosystem’s SOLiDTM platform uses a library of probes which encompasses all combinations of a dinucleotide sequence that are iteratively added through ligation to the growing strand.
FIGURE 87.7. Schematic of array comparative hybridization (aCGH) and transcriptional profiling using a dual-channel platform. Patient and control genomic DNA (aCGH) or RNA (transcriptional profiling) are differentially labeled with fluorophores, then stoichiometrically mixed and allowed to hybridize to probes fixed to a solid surface. The relative amounts of fluorescence at each feature is measured to gain information about gains or losses in the patient sample compared to control (aCGH) or about over- or underexpression of genes (transcriptional profiling).
FIGURE 87.8. Schematic of next generation sequencing using dye-labeled nucleotides which act as reversible chain terminators. The DNA is first sheared and modified with adaptors. These adaptors can be used to immobilize the DNA fragments and serve as primers for polymerase chain reaction (PCR) amplification and for sequencing using the reversible chain terminators. The sequence of each fragment is determined, followed by the computational alignment of the fragments to construct the genomic sequence.
Although the first human genome project took approximately 13 years and cost nearly 3 billion dollars to complete through Sanger-based methods, the advent of NGS has dramatically changed the landscape.40 Today, a full genome can be sequenced at a cost of $1 to $5000 and take less than a day.38 The read length for NGS is significantly shorter than for Sanger sequencing, often 30 to 400 bp. Therefore, the ability to map these sequences back to the genome requires significant overlap of the reads, from tens to even millions of reads per nucleotide. The higher number of reads are required to detect even small insertions and deletions or translocations. The analytical sensitivity for typical NGS can approach 5% tumor cells in a background of nonneoplastic cells.41 However, newer deep sequencing methods have been adapted for MRD testing. Using very high read depths, sensitivities of 0.0001% can be achieved.18a
WGS can encompass vast amounts of data, however. For example the roughly 3 Gb (gigabase pairs) of the human genome at only 30 reads per nucleotide results in 90 Gb of data. However, by targeting the sequencing to a smaller portion of the genome, the data generated can be significantly decreased. Therefore, methods have been developed to conduct whole exome sequencing (WES), targeted WES, transcriptome sequencing (RNA-seq), sequencing of DNA methylation sites (bisulfite seq), mirnome sequencing (miRNA-seq), sequencing of immunoprecipitated DNA (ChIP-seq), and many others.38 Targeting 500 kb at 100 reads generates only 50 Mb of data. Many of these targeted platforms can essentially perform expression profiling by sequencing.
Transcriptional Profiling
Initially developed in the 1980s, transcriptional profiling was the first omic technology to see widespread utilization. This methodology enables the assessment of the transcriptome, the sum of expressed genes reflected in the mRNA population of the cell(s). Since the 1990s, a number of high-density commercial microarray platforms, in addition to the numerous academic methods, have been available, differing in their amplification methods, types of probes, probe content, probe design, probe adherence technologies, and labeling and hybridization methods.42 The two main types of DNA microarrays that have dominated the field involved probes made from either cDNA libraries or oligonucleotides, although the majority of the commercial platforms now use oligonucleotide probes. Transcriptional profiling can be performed as either a single-channel or a dual-channel experiment (Fig. 87.7).
This methodology does not capture the protein expression of various genes and any post-translational modifications. In addition, when the mRNA levels are varied between two samples, it is impossible to determine in a single timepoint comparison whether the differences are due to primary changes at the DNA mutational level, primary changes at the transcriptional level, or secondary changes at the transcriptional level resulting from the true disease-causing aberration. Therefore, the results are largely phenomenologic until extensive research is conducted to deconvolute the true disease-causing aberrancy. In addition, the methodology has limited analytical sensitivity for small fold changes, and limited clinical sensitivity if the reference samples are not chosen wisely. This methodology may be falling into disuse with the advent of NGS.
Nonetheless, transcriptional profiling has led to significant discoveries in lymphoid malignancies. One main utility has been in the definition of prognostic subgroups. For example, its use in the study of SHM status in CLL led to the identification of ZAP70 expression as an independent poor prognostic marker.43 Similarly, in DLBCL, transcriptional profiling has identified three widely used prognostic subgroups: GCB-like with better prognosis, and activated B-cell (ABC) and type 3 DLBCL, which does not express either set of genes at a high level, the latter two subgroups with poorer prognosis.44
Gene expression profiling studies have also been useful in clarifying the biologic relationships between various hematolymphoid neoplasms. Studies have demonstrated, for example, the similarities at the transcriptional level between primary mediastinal large B-cell lymphoma (PMBL) and classical Hodgkin lymphoma (cHL)-derived cell lines,45 or between anaplastic large cell lymphoma (ALCL) and cHL.46
MicroRNAs, Epigenetic Changes
MicroRNAs
Both plants and animals have evolved microRNAs (miRNAs), single-stranded RNAs of ˜21 nucleotides, as a mechanism for translational regulation. These miRNAs are encoded in the genome and are transcribed by DNA polymerase II. Following processing in both the nucleus and cytoplasm, the mature miRNA, mediated by the RNA-induced silencing complex, binds in a complementary fashion to the 3′untranslated regions (3′-UTR) of target mRNAs to cause translational repression.
Physiologically, miRNAs play a key role in the development and identity of different cell types.47,48 The pattern of transcription of miRNAs during ontogeny is tightly regulated.49,50 Additionally, miRNAs expression patterns are also associated with specific cell types at a given stage of development. For example, differentiation of the hematopoietic lineages involves carefully co-ordinated changes of expressed miRNAs.51,52 In addition, to their roles in differentiation, whether at the organism or cellular level, miRNAs are important in cell identity.53 Thus, miRNAs, individually or in profiles, can be markers of tissue type.
Due to their roles in cell identity and differentiation, miRNAs have been investigated in numerous tumor types. Interestingly, the location of all miRNAs in the human genome is nonrandom. It has been demonstrated that miRNAs are concentrated by a factor of nine in genomic fragile sites and others that are commonly altered in cancer.48 Thus, over one-half of 186 miRNAs evaluated in one study were located at cancer-associated genomic regions, such as regions of loss of heterozygosity, common breakpoints and areas of amplification. These findings suggest that aberrant miRNA expression might be a common pathway in oncogenesis.
For example, the commonly deleted region in CLL (13q14) contains two miRNAs, miR-15a and miR-16-1.56,54,55 These are consequently down-regulated in CLL, resulting in overexpression of their target mRNAs, BCL2 and MCL1, and an overall antiapoptotic effect.56 By contrast, miR-155 has been identified as up-regulated in a number of B-cell lymphomas. First identified in cases of childhood BL, expression of the pre-miRNA for miR-155 was found to be up-regulated in BL, DLBCL (associated with the ABC subtype), CLL, and marginal zone lymphoma.57,58 and 59,60,61 The miRNA polycistron miR-17-92, located at 13q31, is also implicated in lymphomas such DLBCL, FL, mantle cell lymphoma (MCL), and primary cutaneous B-cell lymphoma, among others.62
Using miRNA RT-PCR, microarrays, and NGS methods, miRNA expression patterns have been interrogated and represent an unfolding field of lymphoma research. The future may see these miRNAs as the target of diagnostic, prognostic, or even therapymonitoring assays.
Epigenetics
Epigenetics involves the heritable alterations in gene expression that are not caused by actual changes in the genomic sequence. Epigenetic changes occur through one of two main pathways. Methylation of the 5-position of cytosines, particularly in CpG rich sites such as CpG islands, shores, and shelves, results in transcriptional repression. CpG islands are defined as regions >500 bp in length with a CG percentage >55% and an observed to expected CpG ratio of >65%.63,64 Alternatively, post-translational modification of the amino acids of histones via methylation or acetylation can result in heritable changes in histone structure and therefore the accessibility of the DNA to transcription. DNA methylation has been the better-examined epigenetic mechanism of the two, and methylome studies can be conducted via NGS, methylation arrays, and targeted methylation methods.
All methods to interrogate methylation status depend upon one of three main techniques.65,66,67 Isoschizomer restriction enzymebased methods rely upon the selective cleavage of either methylated or unmethylated sequences by specific restriction enzymes. A second method uses the chemistry of bisulfite to convert unmethylated cytosine to uracil, thereby causing a sequence change in unmethylated CpG sites but not in methylated sites. These differences can then be identified via sequencing or sequencespecific hybridization methods. Lastly, proteins that selectively bind to methylated CpG sites, whether the naturally occurring methylation binding protein or antibodies generated against CpG sites, can be used to pull down methylated fragments of DNA. All three techniques can be used to prepare samples for sequencing, arrays, or more targeted methods.
RECURRENT MOLECULAR ABERRANCIES IN B-CELL AND T-CELL NEOPLASMS
Tables 87.3 and 87.4 list many of the common reciprocal translocations found in B-cell and T-cell malignancies, respectively. Of note, many of the reciprocal translocations involve one of the immunoglobulin genes in the case of B-cell lymphomas (most commonly IGH@ on chromosome 14q32). A smaller proportion of T-cell lymphomas involve the TCRα/δ locus on chromosome 14q11. The ensuing text highlights some of the better known translocations, and discusses selected other molecular aberrancies identified in specific lymphoid neoplasms.
Mature Neoplasms of B-cells
Burkitt Lymphoma
BL is a highly aggressive B-cell neoplasm that can have a lymphomatous, leukemic, or combined presentation, although these forms are not biologically distinct. However, there are three subtypes of BL that appear to have different epidemiologic and molecular bases, while related by their common dependence upon MYC dysregulation.4 The endemic variant of BL is prevalent in equatorial Africa, tending to occur in young children between the ages of 4 and 7, with involvement of the mandible, maxilla, other facial bones, and abdomen.5 There is an association of this form of BL with Epstein-Barr virus (EBV) which is also endemic to that geographic region, and approximately 95% of endemic BL contains clonal EBV DNA. Sporadic BL is found predominantly in adolescents and young adults of Western countries, and is the most common form of childhood lymphoma in the United States. In these cases, the disease is predominately abdominal with less frequent association with EBV in 5% to 30% of cases.4,9,68 Immunodeficiency-associated BL is the third biologic subtype, where the most common association is with human immunodeficiency virus (HIV), although this form of BL can be seen secondary to other causes of immunodeficiency, both primary and secondary in nature. In approximately 25% to 40% of cases, there is an association with clonal EBV as well.69,70
Translocations of the MYC gene characterize BL as well as a subset of aggressive DLBCLs, many of which are currently best classified as B-cell lymphoma, unclassifiable, with features intermediate between DLBCL and BL. Thus, although essentially all BLs have some form of a MYC translocation, a MYC translocation is not specific to BL.
TABLE 87.3 COMMON CHROMOSOMAL TRANSLOCATIONS IN B-CELL NHL
a Indicates adverse prognostic significance in addition to diagnostic role.
b Indicates favorable prognostic significance in addition to diagnostic role.
The most common translocation partner of MYC, located at 8q24, is the IGH@ locus on chromosome 14q32. This t(8;14) (q24;q32) can be identified in 80% of all BL and results in the overexpression of MYC.71,72 The remaining cases of BL place MYC under the regulation, not of the heavy chain locus, but under one of the light chains, with a kappa light chain partner in a t(2;8) (p11;q24) and with lambda in t(8;22)(q24;q11).73,74 The MYC gene is composed of three exons, the first noncoding, and the remaining two coding. MYC encodes for a transcription factor involved in both cell proliferation as well as apoptosis (Fig. 87.9]). Dysregulated function of MYC results in increased cell cycling through its inhibition of p21 and p27 as well its promotion of CDK2 and CDK4.75 This is manifest pathologically by the numerous mitoses in BL as well as the extremely high proliferation rate, with Ki-67 expression typically >99%. In addition, MYC is proapoptotic, correlating with the numerous apoptotic bodies that create the classic “starry sky” histologic appearance of these tumors.
Although all cases of BL contain a translocation of MYC, the different subtypes of BL are molecularly distinct as well.76,77,78,79 All the translocations with immunoglobulin genes result in the transcription of the full MYC coding sequences. However, the breakpoints of MYC and immunoglobulin genes vary among the BL subtypes. In endemic BL, the MYC breakpoint is located approximately 300 kb upstream from exon 1. This breakpoint translocates the full MYC gene to the JH region of IGH@. By contrast, the MYC breakpoint in sporadic BL can occur 5′ to exon 1 or within intron 1, still translocating the full MYC coding region in either scenario to the one of the C regions of IGH@ (Cµ, Cγ, and Cα have all been documented). In the translocations involving either IGK@ or IGL@, the MYC gene typically remains on chromosome 8, with the breakpoint 3′ to the third and final coding exon to which the IGK@ or IGL@ locus is affixed at either a V or J segment. These differing molecular breakpoints may be related to differences in the stages of B-cell development during which the oncogenic change occurs. The sporadic cases may develop during class switching, whereas endemic cases may occur during SHM.9
TABLE 87.4 COMMON CHROMOSOMAL TRANSLOCATIONS IN T-CELL NON-HODGKIN LYMPHOMA
a Indicates favorable prognostic significance in addition to diagnostic role.
b Indicates adverse prognostic significance in addition to its diagnostic role when extra copies of 7q are identified.
As a result of the wide range of potential breakpoints in both the MYC gene and the immunoglobulin genes, PCR-based assays for MYC translocations are not practical, although primers have been generated against specific MYC breakpoints.80 Rather, FISH is the optimal means for detection of MYC translocations at diagnosis. Specific probes against both MYC and IGH@ can be used to assess for the t(8;14)(q24;q32). However these probes will be less sensitive for the variant light chain rearrangements. Therefore, MYC breakapart probes provide greater sensitivity for any MYC rearrangement, regardless of the immunoglobulin partner.81
In addition to BL, 5% to 16% of DLBCLs may contain a MYC translocation82,226 and MYC translocations are seen in 35% to 50% of B-cell lymphoma, unclassifiable, with features intermediate between DLBCL and BL.4 Therefore, the presence of a MYC translocation alone does not define BL in the absence of the appropriate morphologic and immunophenotypic features. In cases where either the morphology or the immunophenotype is not classic for BL, additional FISH studies are recommended to rule out a double- or even triple-hit lymphoma.83,84 These include FISH assessment for the BCL2-IGH@ translocation t(14;18)(q32;q21) as well as for rearrangements of BCL6 on chromosome 3q27. In addition, use of MYC breakapart probes are critical in these cases as the translocation partner in some cases may involve nonimmunoglobulin-related genes.4
Gene expression profiling studies have clearly supported the distinction of BL from DLBCL and the category formerly known as atypical BL (many of which are currently classified as B-cell lymphoma, unclassifiable, with features intermediate between DLBCL and BL).85,86 These studies have also highlighted the overexpression of T-cell leukemia 1 (TCL1) in BL which appears to be dependent upon the presence of EBV. Other studies have identified significant overexpression of miR-155.57,59 In fact, the combinatorial decreases of several miRNAs, including miR-34b, may help explain the overexpression of MYC in those cases that appear to lack a MYC rearrangement (up to 10% of BL in some studies).86,87,88 Another mechanism to account for these rare cases may be mutations in the MYC gene, although most of these are found in addition to a MYC translocation and may enhance the tumorigenicity of the MYC dysregulation.89
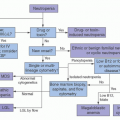
Guidelines for Molecular Testing in Burkitt Lymphoma
FISH confirmation of a MYC rearrangement is recommended at diagnosis of BL. However, FISH is not a sensitive marker of MRD. Due to the extensive SHM of BL as a neoplasm of GCBs, PCR-based immunoglobulin gene rearrangement studies have very poor clinical sensitivity, and, in the absence of allele-specific primers, PCR for immunoglobulin gene rearrangements is not superior to FISH in terms of analytical sensitivity. PCR directed against the MYC rearrangement itself sees little practical use due to the low clinical sensitivity. NGS may provide a good means for MRD testing. Therefore, FISH remains the optimal diagnostic test, and there is a limited role for any testing for MRD other than potentially NGS. As mentioned earlier, in cases that do not have the classic morphologic or immunophenotypic profile of BL, additional FISH studies for BCL2 and BCL6 gene rearrangements are also recommended.
Diagnosis
MRD
FISH for MYC
Consider NGS for Ig gene rearrangement studies
Consider FISH for BCL2 and BCL6
Consider NGS for Ig gene rearrangement studies
Follicular Lymphoma
FL accounts for approximately 20% of all lymphomas, and is the second most common B-cell lymphoma, especially prevalent in Western nations.4 FL is predominantly a disease of adults and subclassifications are based upon the histologic grade and degree of nodularity. Notable subtypes include primary cutaneous FL, pediatric FL, and FL of specific extranodal sites such as the duodenum or testes.
A BCL2 translocation can be found in approximately 85% to 90% of cases of FL as well as in 20% to 25% of de novo DLBCLs (not transformed from a known prior FL), occasional cases of CLL, and rarely in other lymphomas.10,90,91,92 Therefore, although the BCL2 rearrangement is the canonical cytogenetic abnormality associated with FL, it is not pathognomonic for this entity.
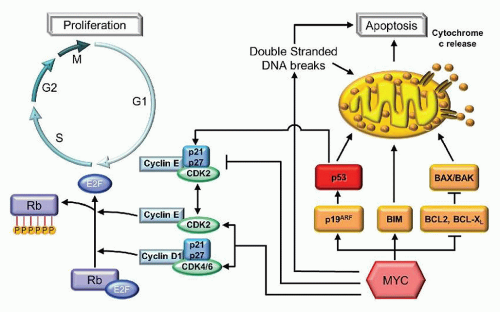
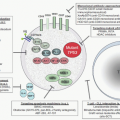
FIGURE 87.9. Apoptosis and proliferation pathways illustrating some of the roles of cyclin D1, MYC, and BCL2. Cyclin D1 associates with the cyclin-dependent kinases, CDK4 and CDK6, to form a complex that hyperphosphorylates the retinoblastoma protein (Rb). When phosphorylated, Rb is unable to sequester and inhibit the function of E2F1 in promoting entry into S phase and promoting cell cycling. MYC inhibits p21 and p27, inhibitors of the cyclin-dependent kinases, and promotes the expression of CDK2 and CDK4. MYC also inhibits several antiapoptotic proteins, such as BCL2. BCL2 forms a heterodimer with BAX, thereby preventing the formation of proapoptotic BAX/BAK homodimers. MYC also promotes the p19ARF activation of p53-mediated apoptosis and cell cycle arrest through p21 and p27.
The t(14;18)(q32,q21) is involved in the pathogenesis of FL, placing the BCL2 gene on 18q21 under the regulation of the IGH@ gene locus at 14q32. The translocation, which appears to be directed by the RSS-mediated VDJ rearrangement process, results in the overexpression of BCL2 which can be determined by immunohistochemical staining (IHC) except in cases when a mutation in BCL2, superimposed on the rearrangement, prevents the antibody from binding.93 BCL2 is a mitochondrial membrane-bound protein that plays a critical role in the prevention of apoptosis (Fig. 87.9). BCL2 forms a heterodimer with BAX, thereby preventing the formation of proapoptotic BAX or BAK homodimers.94,95 For GCBs, which should undergo apoptosis in the absence of appropriate nonself antigen stimulation, the overexpression of BCL2 results in the failure of the neoplastic cells to apoptose. This pathogenesis explains the rather indolent behavior of this lymphoma in the absence of additional hits that create a more proliferative drive.
Because FL is a neoplasm of GCBs, ongoing SHM limits the utility of immunoglobulin gene rearrangement molecular assays. Indeed, these assays have a notoriously low clinical sensitivity for FL using a single set of IGH@ FR3 primers, ranging from 13% to 52%.14,15,17 This corresponds to the extremely high average frequency of mutations in FL, of 11.6% for IgG clones, 9.9% for IgA clones, and 7.8% for IgM clones.96 VH contains an overall of 11.0% mutations in essentially 100% of cases of FL, where VK contains a mean mutation rate of only 0.5% in only 33% of cases.97 Therefore, the addition of IGK@ primers greatly enhances the clinical sensitivity of the assay for FLs. The IGK@ locus tends to harbor fewer mutations, 4.7% according to one study.98 Therefore, by combining multiple immunoglobulin primers against both IGH@ and IGK@, a clonal rearrangement can be identified.14,15,17,97 However, without the development of allele-specific primers, any background B-cells can decrease the sensitivity of the detection of the clone to 1% to 5%.
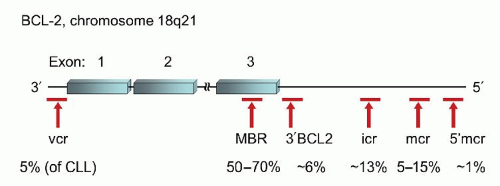
FIGURE 87.10. Location of breakpoint clusters in theBCL2gene and their relative frequencies in follicular lymphoma and other B-cell neoplasms. MBR, major breakpoint region; mcr, minor cluster region; icr, intermediate cluster region; vcr, variable cluster region.99,100
However, within the BCL2 locus there are several clusters of breakpoints spread out over the entire length of the coding gene and extending to more than 30 kb downstream from the final exon 3 (Fig. 87.10).99,100 The majority of the potential breakpoint clusters involve translocation of the full coding sequence of BCL2 to chromosome 14. The major breakpoint region (MBR) is located within the 3′-UTR of exon 3 and accounts for 50% to 70% of potential breakpoints in BCL2. The minor cluster region (mcr) is located 20 to 30 kb farther downstream of exon 3, accounting for 5% to 15% of cases. The most common laboratory practice is to design primers for the MBR and mcr regions separately, using partner primers in the JH subunit. These two sets of primers are able to detect approximately 70% to 85% of potential rearrangements.10 However, there are several additional sites within the BCL2 locus that can also be involved in rearrangements with immunoglobulin.99,100 The intermediate cluster region (icr) may actually be more prevalent in neoplasms than the mcr, accounting for approximately 13% of translocations. The icr is located between the MBR and the mcr as is the 3′ BCL2 cluster which accounts for 6% of cases. The 5′ mcr is the farthest downstream breakpoint region, but only accounts for approximately 1% of cases. Lastly, the variable cluster region (vcr) is located 5′ to the first exon but is found predominantly in the rare cases of CLL which harbor a t(14;18) as well as rare cases of FL. The vcr is the only one of the breakpoint regions that occasionally can be involved in translocations involving either IGK@ or IGL@ instead of IGH@. Unlike in BL, there is no definitive evidence that the location of the breakpoint plays a particular role in prognosis or disease biology.100
Given the only 70% to 85% clinical sensitivity of most clinical PCR-based assays for t(14;18)(q32;q21), FISH for the rearrangement does play a role in those cases where the diagnosis is not definitive and the molecular testing fails to identify the translocation.101 The clinical sensitivity of FISH is significantly higher (100% correlation with SB) due to the far longer probes used in this method which are not dependent upon the specific site of the break. However, due to the limited analytical sensitivity of FISH compared to PCR-based methods, FISH is less useful in monitoring patients for MRD. For cases in which there is morphologic concern for a more high-grade process (foci of grade 3B or concomitant DLBCL), FISH for MYC and BCL6 rearrangements may also be helpful to identify transformation to a double- or triple-hit lymphoma.83,84
Even with the more clinically sensitive FISH studies, still approximately 10% of FLs will be negative for a t(14;18). Approximately 5% to 15% of FL cases may have translocations involving BCL6 instead, often associated with more aggressive lesions with increased large cells.102,103,104,105 In addition, the FL variants such as primary cutaneous FL and pediatric FL are also typically t(14;18)-negative.4 Higher grade FL is also associated with a higher incidence of t(14;18)-negativity.106 These t(14;18)-negative FLs have been associated with down-regulation of miR-16, miR-26a, miR-101, miR-29c, and miR-138, supporting a later germinal center cell of origin.107
Studies on the prognostic significance of t(14;18) testing results have demonstrated that the achievement of PCR-negativity after induction chemotherapy did not significantly effect progression-free survival.108 However, there is a significantly better survival in those patients who were PCR-negative in the bone marrow at diagnosis and for those who achieved PCR-negativity in the bone marrow after maintenance rituximab chemotherapy.108,109 Thus, there is a role for molecular testing of t(14;18) in prognostication, although the role in MRD testing may be limited to after long-term maintenance therapy.
The use of molecular testing for BCL2-IGH@ rearrangements for MRD monitoring carries one significant caveat. Using highly sensitive nested PCR methods or RT-PCR, t(14;18) may be found in up to 50% of normal individuals, the incidence increasing with age.110 At this time, there is no indication that these t(14;18)-positive individuals are at any higher risk of developing FL. This phenomenon may serve as the basis for those individuals who enjoy prolonged complete remission while remaining PCR-positive.111
The presence of t(14;18) in normal individuals suggests that overexpression of BCL2 alone is not tumorigenic. Indeed, careful cytogenetic examination of FL by karyotype, aCGH, or aSNP can identify additional aberrations in up to 97% of FLs, including loss of 1p, 6q, 10q, 13q, and 17p as well as gains of 1q, 2p, 7, 8, 12q, 18q, and X.112,113 Even in those cases without a CNV, copy neutral loss of heterozygosity can occur.114 Cytogenetic abnormalities tend to accumulate with transformation of FL to DLBCL, and deletions or mutations of TP53 located on 17p13, deletions of 6q or 9p are particularly associated with poor prognosis.115,116 Losses or copy number neutral LOH of 1p36, at which site TP73 and TNFRSF14 are located, have been associated predominantly with diffuse FL.117,118 In addition, acquisition of a MYC translocation may also be associated with transformation.4
Only gold members can continue reading. Log In or Register to continue